


Register for a Free Live Training
The Hot Stocks Outlook uses VantagePoint’s market forecasts that are up to 87.4% accurate, demonstrating how traders can improve their timing and direction. In this week’s video, VantagePoint Software reviews forecasts for Ford Motor ($F), Walt Disney ($DIS), Phillips 66 ($PSX), Schlumberger ($SLB), Discovery ($DISCA), Hess ($HES)
Hello again, traders, and welcome back to the Hot Stocks Outlook for January 14th, 2022. Hope you all are having a great week out there in the markets and as always, a lot to cover here.
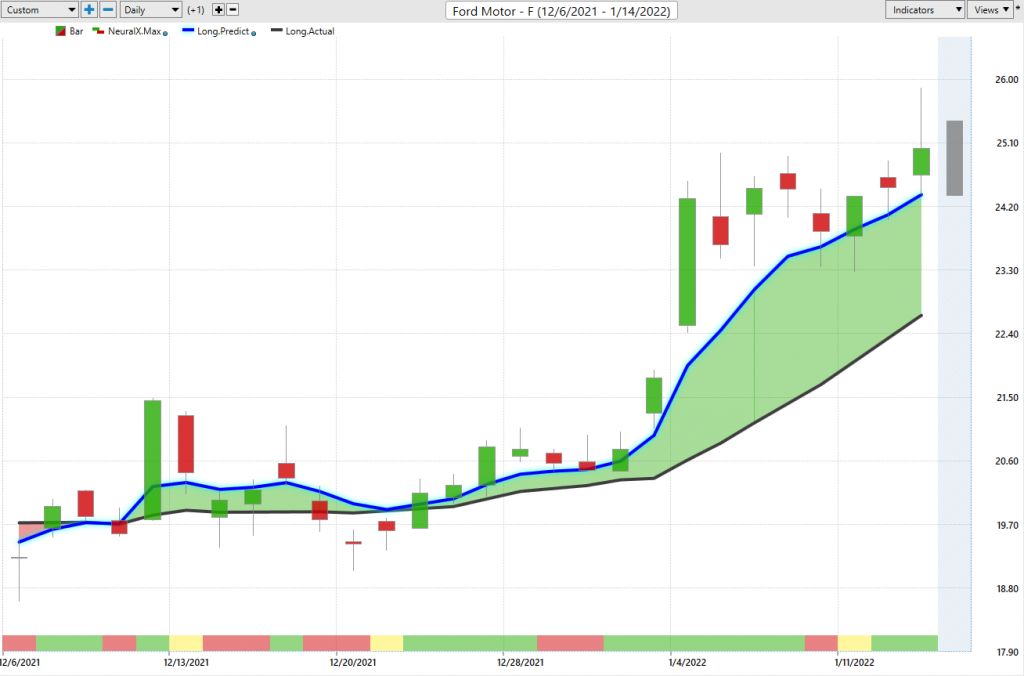
So we’re going to start out with shares of Ford Motor, a lot of tension going on there. We’ll also look at some of the correlations happening in markets. We look at Walt Disney, we’ve also got Discovery here, and then we’ll revisit some of these energy shares that we looked at over the past few weeks. And so recognizing some areas of strength and last week focusing on some areas where there’s some weakness, but certainly here in Ford, let’s go ahead and take a look. So what we have here is daily price action. So each one of these candles represents a complete trading day, but right up against that price data, you’ll see that there is a black line and a blue line.
Now, you’ll also notice at the very bottom of the screen, you have this bar that goes from green to red and at the very right hand top corner here is what we call shadow candle. And this is actually a predicted high and a predicted low for the next trading day. And I want to point all these out ahead of time, really highlighting that truly the combination of these three predictive indicators that are utilizing this technology of artificial neural networks to help traders make those better trading decisions. But specifically here with what we’ll call the predicted moving average, this black line and blue line. What you have here with that black value on the chart is a regular, simple moving average or what we refer to as the actual simple moving average. And that’s a very common technical indicator in that it looks back over the previous 10 close prices in this case, it’ll add those all together and divide by 10.
And so it’s going to smooth out the price data and let us know where market price has been over a given period. But as traders, we want to be ahead of the move and understand, look where prices likely to go next. And what we’re able to do is compare that black line or that black value to this blue value. And so for that number to be plotted against the chart, this is where Vantage Point’s technology of artificial neural networks come in. And specifically what it’s doing is when trying to make a forecast for the future direction of Ford through, again, the combination of these predictive indicators, it’s looking at markets that are known to drive and influence future price. Now on the stock side, that can be things like the broader indices, ETF groups, as well as important relationships with individual stocks. But there’s other really important market relationships like the commodity markets for oil and gold, things like the value of the dollar index or global interest rates.
And these are also being factored in and specifically understanding how this is affecting forward among these different timeframes, and you’ll see how this really all works when we wrap this together. But whenever we see that blue line or that blue value crossing above the simple moving average or what we can think of that lagging moving average, it’s suggesting average prices are going to start moving higher. Now, what’s really great about this is we don’t have to look at every single chart. We actually have scanning features in the software that will help you utilize these predictive indicators. You can set up your scans to identify exactly when all of these things are coming together for you to match your trading style. So when we take a look at the broader look here, we can say, okay, well Ford’s had a really nice run here, shares up about 19, 20% since those crossovers came through but we want to look more closely at the shorter term forecasts.
And that’s where we can utilize at the very bottom of the chart, you see this bar that goes from green to red and back to green. Now this indicator is also utilizing that technology, but it’s tuned in to a different way. It’s trying to solve a different problem and that problem being very short term strength or weakness over really what we’d call these subsequent 48 hour periods. I mean, it’s tuned to be a two day, 48 hour indicator. And what it’s warning you of is short term strength or weakness. So you see here, the neuro index goes bearish, you see you sort of run sideways for a couple of days. It gets bullish here. And that’s where we start gaping up and really starting to move. It gets bearish here again, you see some lower lows over that 48 hours of price action. There’s some nuances to this as far as volatility, but typically how I think of it is we want to look for lower lows typically towards those predicted lows, but in the context of the bigger system.
So what we can do here is look at, again, kind of wrapping this all together of the predicted high, the predicted low, this crossover coming through and alerting you that, hey, Ford is an area where you could focus your attention, but you’re going to get these things updated much like they’re updating at the very right hand side of the chart. They’re updating in the exact same way, all the way back, really at the end of December here. And so you see that as this market moves forward, it’s alerting you before this trading day occurs, you have that predicted high and predicted low much like you have it here today, and it’s warning you that, hey, if you’re coming into this trading day, look for the markets to move lower. After that day, it says, expect some weakness over the next couple of trading days. You might trade down to these lower lows, but clearly the blue line still above the black line and you’d want to get long.
And then again, you see this volatility really starts to pick up and that’s where this adaptive technology really does a great job at pinpointing these areas and getting you back on track to keep exploiting that opportunity and keep making money and managing it well based on how those conditions are changing over time. And so, yes, 20% move, but also multiple entries along the way to manage the position, take profits and make the most of it.
Now here’s Disney, and I really wanted to bring this through because this doesn’t get a 20% rally. This is a much slower moving stock here that hasn’t seen this tremendous advance or anything like that, about 4% rally. But what I want to point out is, if you understand that, okay, well, things are a little bullish here in Disney, at least going into late December.
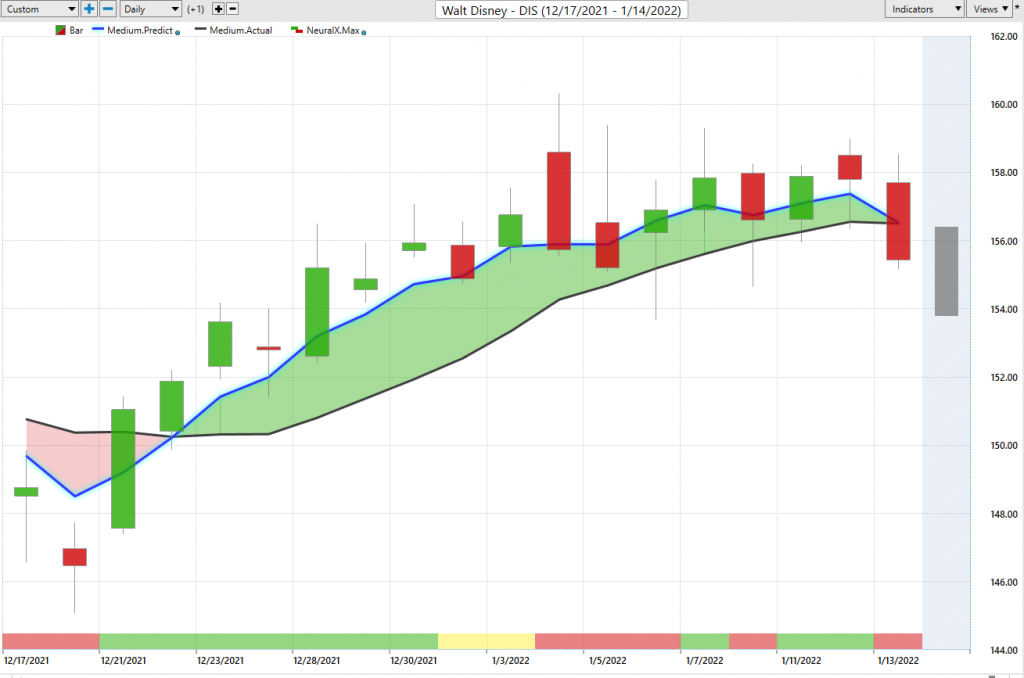
And then we have that guidance from the predicted highs and lows. So the short term trader says, okay, well, I’m going to buy here, look to target there and then rinse and repeat doing this over and over again, looking for pullbacks to target those higher price levels in the market. So it’s not about that huge sweeping move, which sometimes you’re going to be a part of, and that’s great. But typically that happens by identifying the opportunity, managing it well so you can deal with the future volatility, but walking it forward each and every day so that if you do get that big pop in advance, like we recently saw on the energy stocks, you’re there, you’re making money and really have a great position in a market that’s moving.
Here’s Discovery, so again, staying in the same area here, but recognizing, hey, there’s some strength in this area of the market.
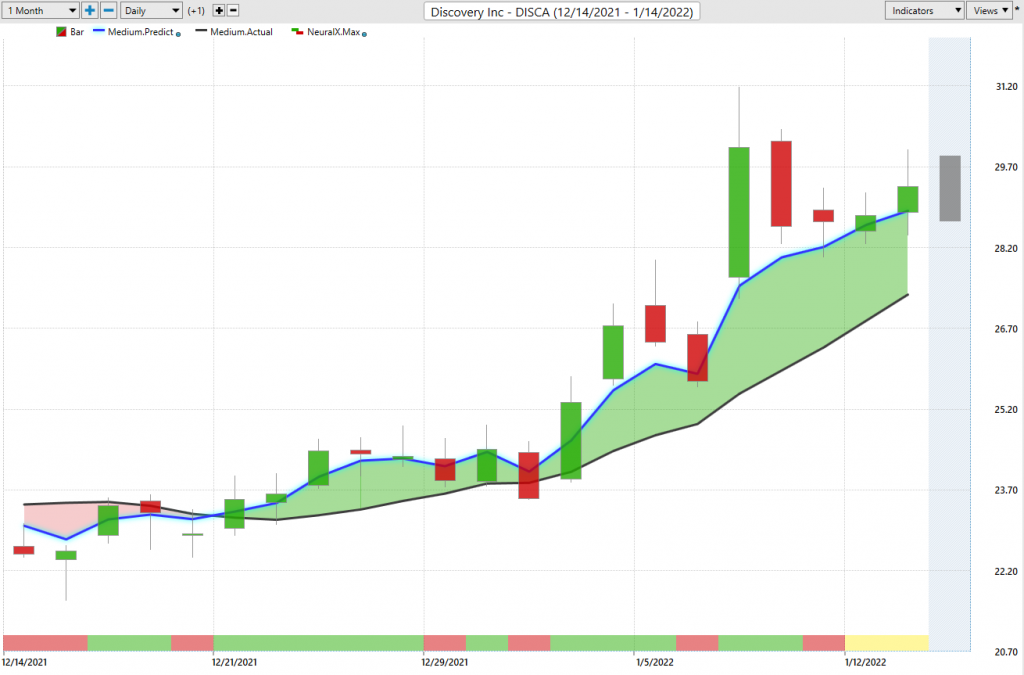
You see the neural index goes bearish here. A little bit of bearishness here, bearishness here. But that predicted moving average, that blue line healthily above the black line saying average prices are still expected to move higher. And as shorter term trader can be using again, these very short term tools. And I keep bringing out these every week. If you see how days like this, where you close lower, where you go right to that previous day’s predicted low and back off to the races. A lot of times you get this volatility, heats up to the upside and you get a sharp pull back, but Vantage Point is doing a pretty good job with that as far as letting you know where should be expecting things to pull back and when have things really reversed and you need to go ahead and get out of the way. So shares picked up a little bit more here than in Disney, about 22% rally, again, just over the past 15 trading days.
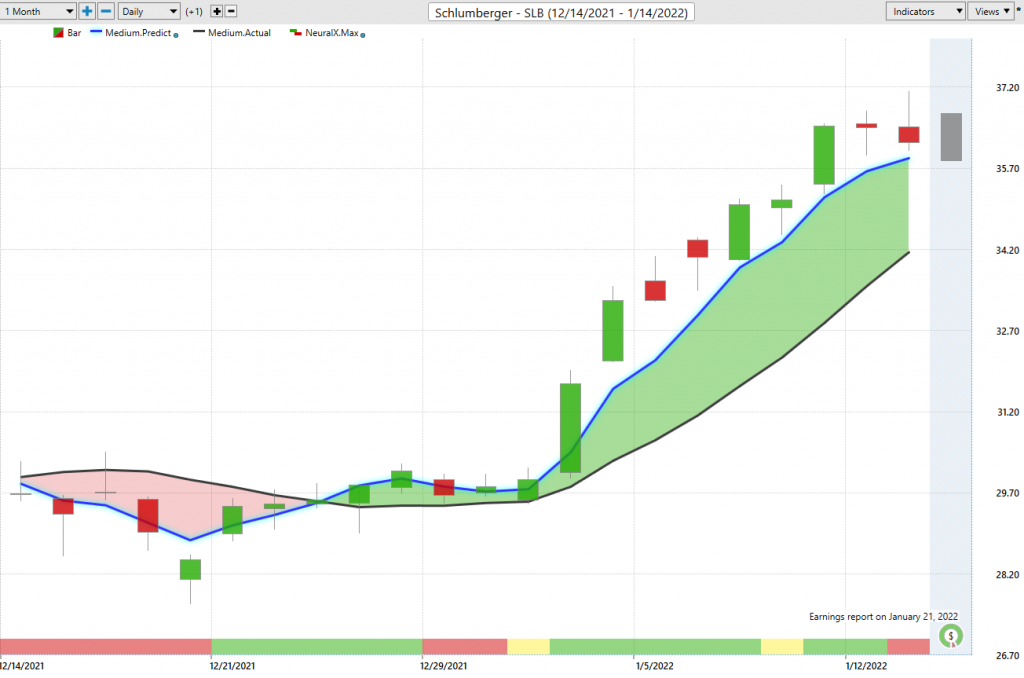
And now we’ll just move over to the energies because this is where we were last week, as far as identifying, just like with these other opportunities.
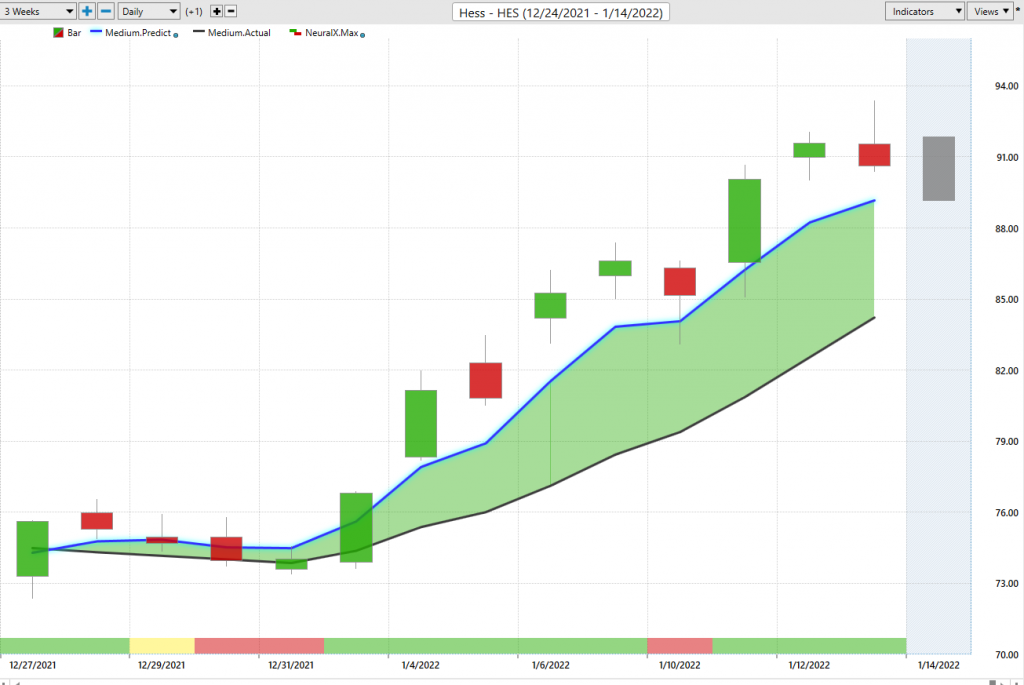
Some of these energy shares are corresponding with Ford, and there might be some important correlations there that software’s picking up on. But still here with Hess, crossover here, blue line over black line, you see helping with that neural index as far as that weakness. But we went over this last week and so as far as the most current update, well, you have a market that’s clearly in an up trend, predicted lows coming down to these levels here would likely be on the radar and getting about a 7% pop or so there in the shares.
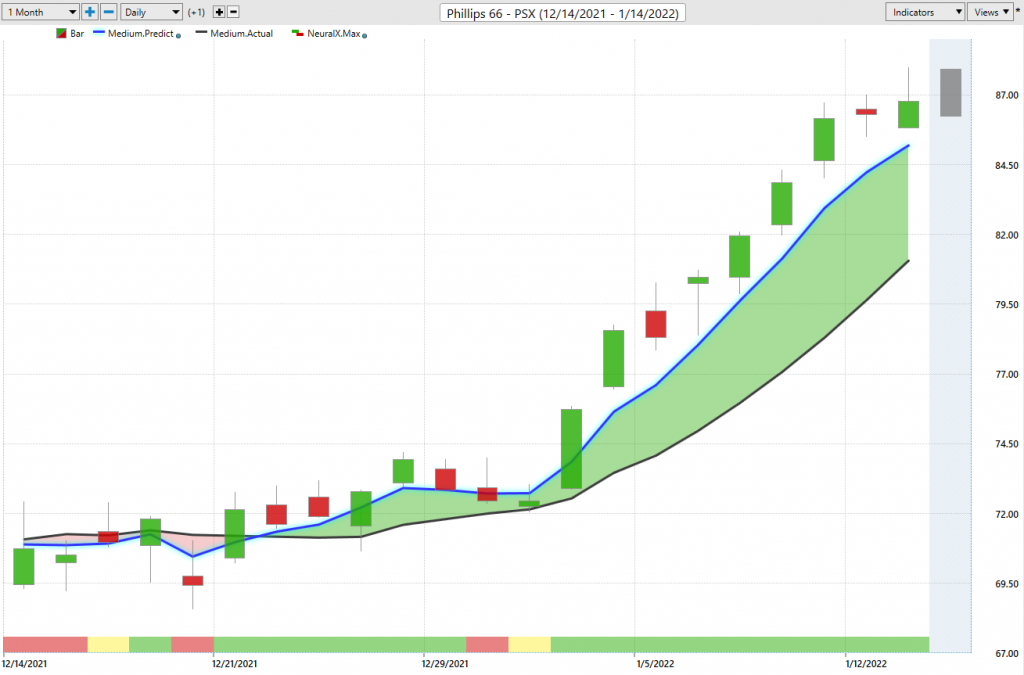
But when you have really the tools that say, okay, well, where should the focus be, where should the attention be? It’s not too hard to figure out a narrative to construct that portfolio. So here in Hess, really nice move just over the past couple weeks. Now that’s turning into a 23% rally, really just from the past few days. There’s about an 8% move there and probably still moving higher still. Here in Phillips, not going to go through these in too much detail, but it just makes it pretty clear to figure out where should we focus on?
And just like some of the hot stocks outlook from previous weeks, where should we really avoid, where are areas in the market that there’s really no sense in bringing these things into the portfolio. And we should then focus the portfolio, maybe in other areas that are atypical, but certainly set up to garner some gains here. So you see about a 22% rally on very similar moves across Ford and these energy shares, as well as some of these media companies. So again, this has been our Hot Stocks Outlook for January 14th, 2022, now, going into the new year. So hope you have a great rest of the week. Thanks again. And bye for now.


