


Register for a Free Live Training
Hot Stocks Outlook uses VantagePoint’s market forecasts that are up to 87.4% accurate, demonstrating how traders can improve their timing and direction. In this week’s video, VantagePoint Software reviews forecasts for Crispr Therapeutics ($CRSP), Blue Bird ($BLBD), Robinhood Markets ($HOOD), Oracle ($ORCL), Moderna ($MRNA)
VantagePoint A.I. Hot Stocks Outlook for July 11, 2025
Hello again, traders, and welcome back to the Hot Stocks Outlook for July 11th, 2025. Hope you all have had an excellent week out there in the financial markets. And as always, we’re here to take a look at the most recent VantagePoint A.I. predictive forecasts.
So, if you haven’t already, go ahead and click on the link down in the description below, and you can get signed up for a live demonstration and learn all the specifics about how these predictive indicators and technologies are helping traders make much better trading decisions out in the marketplace.
Uh, now we’ll go ahead and start out with a somewhat new example. We actually took a look at this stock back in April, coming out of sort of the news around tariffs. Uh, and more recently, we started to see this market go back into an uptrend.
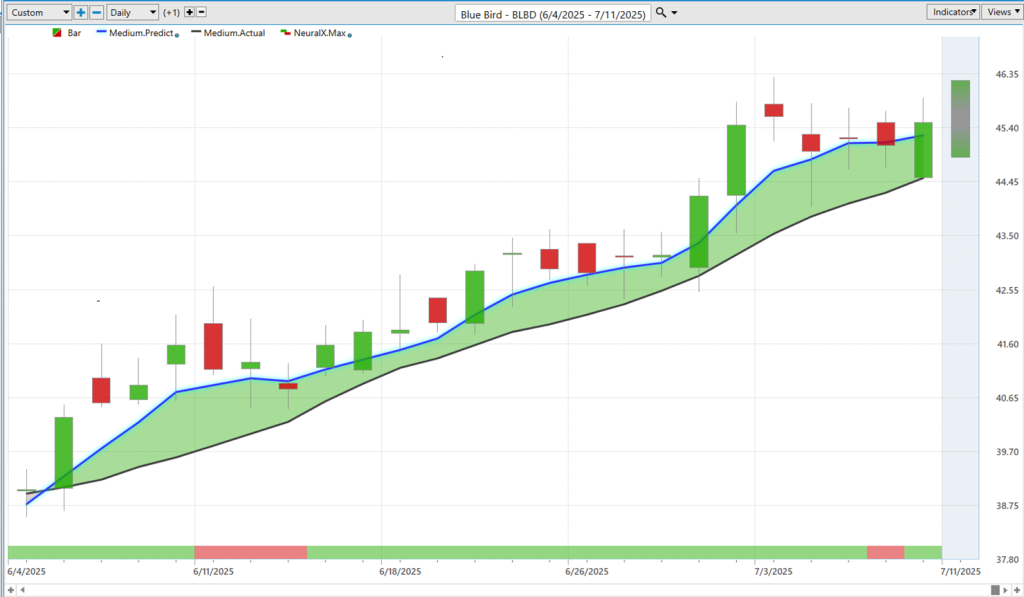
Blue Bird ($BLBD) Shares of Bluebird. It’s a really great example of how all of these predictive indicators work together to really round out that forecast. Uh, and then we’ll go ahead and actually return to a lot of these markets we’ve looked at over the previous weeks and highlight some of the shorter-term indicators and really how they’ve performed over this past couple of weeks here.
So, uh, starting out here with Bluebird, what we have, of course, is daily bars and candles. So, each one of the candles that you see there will represent a full and complete trading day. And the first thing that’s going to jump out to you is that there’s a black line and blue line value that gets plotted right against those daily bars and candles.
And so, what that black line value is, is a simple moving average. And so, we actually call it the actual simple moving average. Uh, and this is very simply a 10-period simple moving average. So, it would look back at the previous 10 close prices, it would add those all together, and then divide by that number.
Um, and traditional technical analysis like this—one of the weaknesses is that all the data comes from the past. So, it really just reconfigures what’s already occurred in the marketplace. And so, VantagePoint traders want to use that actually as a baseline, right? To let us know where market prices have been. But what we’re able to do is compare that value to the proprietary predicted moving average.
And for this number, which we can think of as a price that’s going to get plotted on the chart every evening, well, for that number to get calculated, this is where the technology of artificial neural networks comes into play, and they’re performing what we would call intermarket analysis. And so, what that means is that rather than just looking at past prices like traditional technical indicators, we really use the data set of correlated and sometimes inversely correlated markets.
And so, what the neural network’s able to do is identify a lot of these relationships, whether they take place in individual stocks or ETFs—and oftentimes, where applicable, in things like the futures market—that extends all the way to the bond market and interest rates, as well as, you know, particular commodities. Uh, you know, for something like gold, we can think of gold miners being heavily affected by gold, silver, platinum prices. And so, it’s looking at really dozens of what we would call intermarkets as really the data set used to generate these highly accurate price predictions.
And so, whenever we see this blue line, in this case, skew above that lagging moving average of the black line, well, it’s suggesting that average prices are going to start moving higher, and traders may want to look to take a bullish or long position.
Now, that’s not the entirety of the forecast. That gives us really the overall trend direction of the market. And we have some other indicators. If we look at the very bottom of the chart here, you see this bar that goes from green to red and back to green. And this gets updated every evening. And what it’s doing is anticipating short-term strength or weakness over the next 48 hours. So, you can think of that as really just two trading days moving forward.
And how this is interesting is that, you know, we can look at the overall trend direction using that neural network approach, but we can also use that approach to solve different problems. And in this case, we’re utilizing that neural network to really identify, again, just short-term strength or weakness over a 48-hour period.
And lastly, we’re getting down to intraday. So, if you look at the very right-hand side of the chart here, you can see this shadow candle. Um, and what this does is really highlight intraday predicted highs and lows that are expected for the next trading day. So, now we’re down to really an intraday time frame and really providing really exact levels here as far as where those neural networks expect prices to move.
Uh, and so, as we look back at Bluebird, we can see, okay, well, this overall market has been in an uptrend, but how accurate have those short-term predictions been along with that uptrend? And we can actually see how accurate each one of these, uh, uh, trading ranges is relative to the real trading data that gets filled in.
You can see how effective this is. Once traders identify the trend direction, well, they have really individual pinpoint levels to expect markets to move. And so, you see here how, uh, the market moves higher. We got to close at this predicted low, and then it’s telling you the next trading day, expect prices to move back down a little bit lower, settle a little bit lower. Uh, and then we see that trend really start to pick up with a gap up in the chart.
But we got numerous opportunities here where the market scoots down towards these predicted lows, and within pretty short order here, is moving higher. So, you’ve got about four, five, six, seven, eight, nine, ten, eleven, twelve, uh, uh, trading days where we move down towards that predicted low, uh, and we see the overall trend resuming to the upside.
So, overall here, about a 12% move here in just the past 22 trading days. This is a market that sort of settled around 40, goes back into uptrend, and we see that’s really where prices start to pick up again.
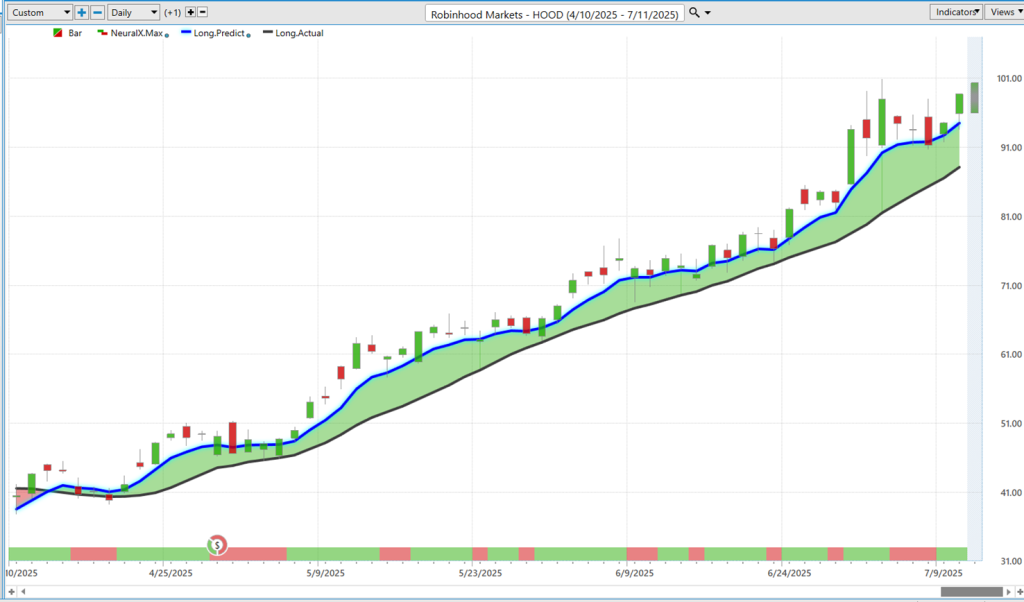
Now, Robin Hood, we’ve looked at probably a few times—Robinhood Markets ($HOOD)
—over the past couple of months here. Uh, and again, I just wanted to highlight and update some of these forecasts as we move higher and higher, and the trend remains to the bullish side.
Well, we can see, okay, well, how accurate are those short-term predicted high and low levels? And so, again, we can see here that, well, Robin Hood clearly in an uptrend. Uh, and where do we want to be looking to accumulate a position? Well, again, down at these VantagePoint predicted lows. Uh, and you see here, even from what would have been Tuesday here, moving down to this predicted low going into, you know, really the end of the day Friday here, we’ll get another candle—already up about 8% from those levels just on a weekly basis. So, just over the past three trading days, about an 8% move.
Now, when we look at this in its entirety, up about 140% over the past 57 trading days with a lot of opportunities to accumulate a position over that time.
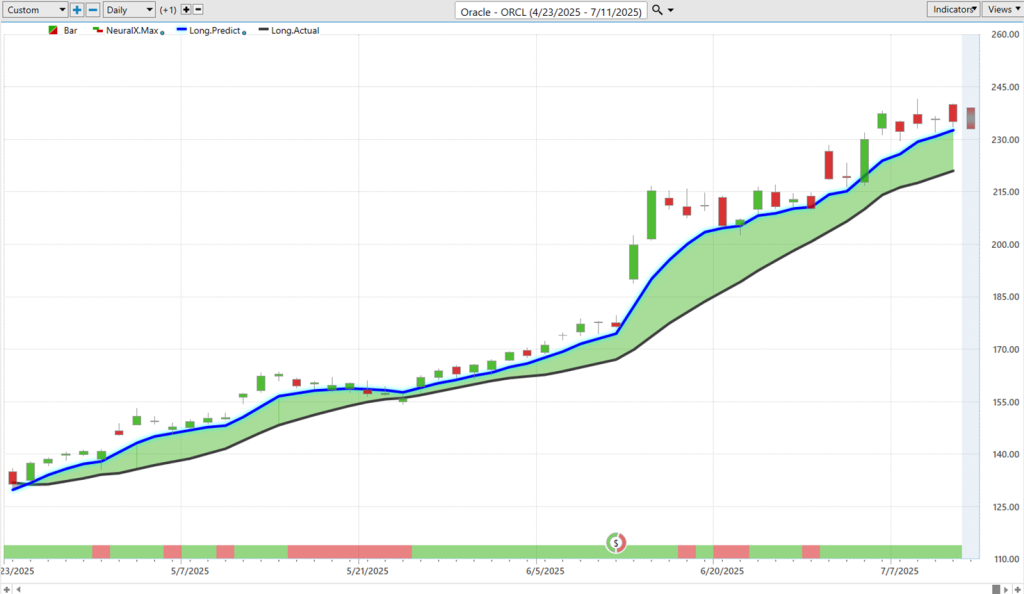
Uh, Oracle, another one of—Oracle ($ORCL)—these, uh, opportunities we looked at in previous weeks. And again, we can say, okay, well, as far as traders making adjustments in the market, where are these predicted highs and lows settling in at? And so, we see moving down to this predicted low, getting a nice uplift. Uh, and even in these, uh, weeks where we really run sideways, you see the software does a good job at saying, “Look, expect prices to remain down at these predicted lows, but still the overall trend is to the upside.” And so, you see you get a little bit of a gappy price action where you eventually scoot up to those predicted lows, settle lower, scoot back up and gap up to those predicted lows, uh, and the market resumes forward. You see that neural index very bullish, anticipating consistent strength over these subsequent 48-hour periods.
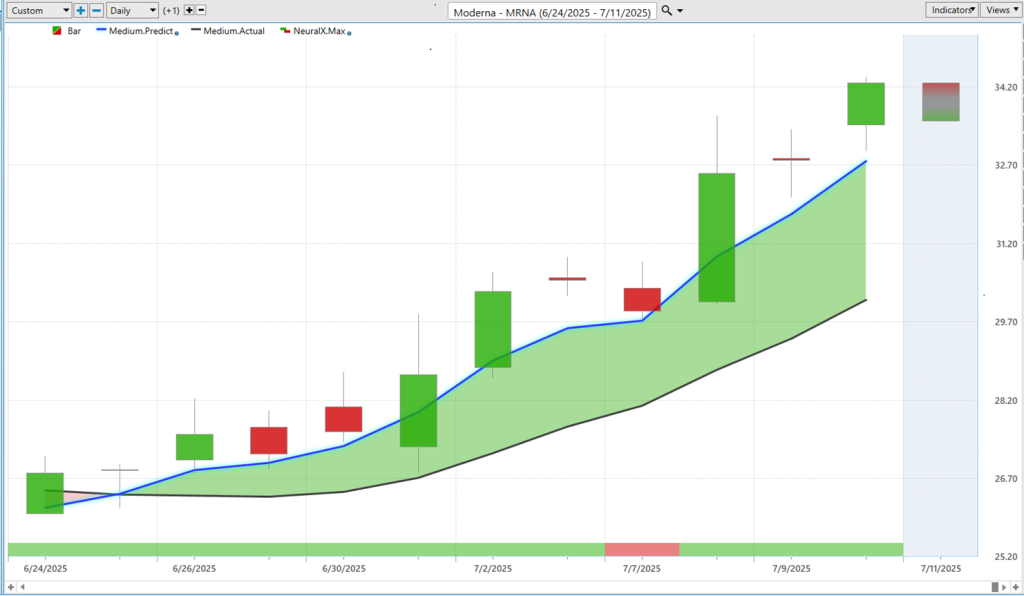
Uh, next here, we have Moderna ($MRNA).—had a really nice week. Uh, and very similar situation where when we really can use some of the scanning features found in VantagePoint here, uh, to identify these fresh crossovers, to identify where those predictive indicators are moving in a bullish way above the actual moving average, signaling that an uptrend is about to get started here.
Uh, and then the trader can then manage that opportunity. So, once they’ve identified that signal, you’ve got really updates every single day that are really adapting, right? Adapting to help the trader make sense of the price action. And so, as the market moves higher here, you see, okay, well, how are these levels adjusting? Well, expect this predicted low to scoot up. Uh, you might expect some volatility here. You see we gap down just a little bit here, but down to that predicted low. Shares getting bid up pretty aggressively here. Uh, and just over the past week—this would have been Monday here—scooting down to that predicted low and then immediately resuming that uptrend.
So, really nice opportunity here, again, just from a weekly perspective. You know, identifying: Where are these markets in strong uptrends? Well, that’s where I might want to utilize these short-term predictive indicators, uh, and look for a trading opportunity.
So, again, a 15% move here just in the past four trading days this week.
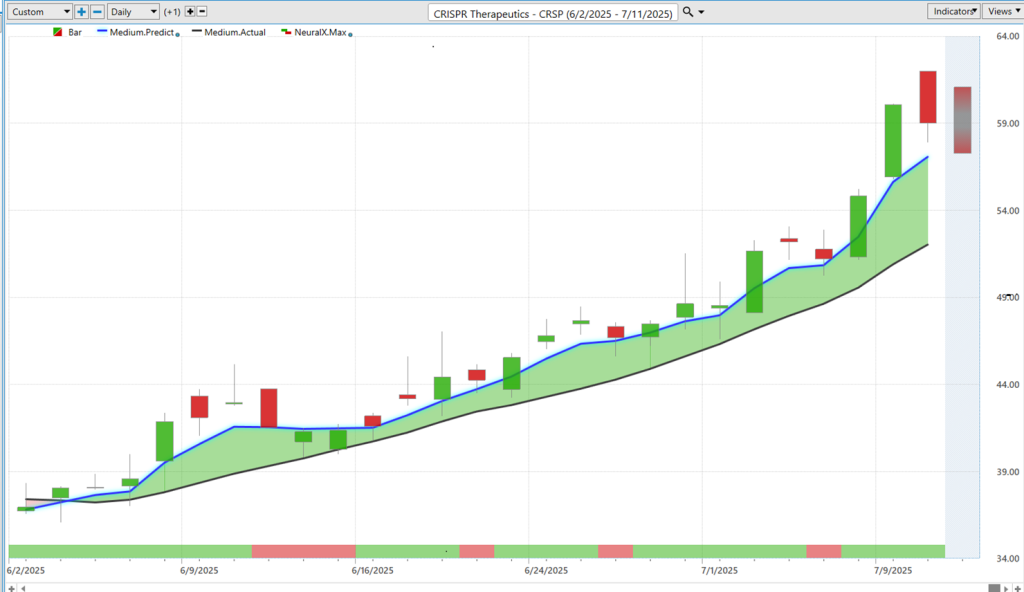
Uh, and lastly here, CRISPR Therapeutics ($CRSP)—another market we’ve looked at, uh, in previous weeks. And again, just highlighting that when you see these markets in uptrend—and especially if you can establish a position with those, you know, valuable predicted lows and get a nice entry into the market—well, then you potentially can get more aggressive and keep adapting with the market as, uh, time moves forward here.
And so, uh, here with a, uh, predicted high and low map here, uh, here coming into the week—this is from Friday, this is Monday right here—scooting down to the predicted low and getting a very strong rally, rally here, uh, continuing through.
So, we’ll see how we get, uh, markets on Friday. We’re seeing a little bit of volatility around tariffs and things like that. But again, another 16% rally here in just the past four trading days.
And so, uh, like I mentioned, some of these features in VantagePoint can really identify these fresh crossovers as they occur. So, whether it’s, you know, Bluebird here we have, uh, in June, Robin Hood all the way back in April, um, and continuing higher—so really making that move after tariffs and just continuing that uptrend, really not settling or slowing down at all.
Uh, and again, that allows traders to say, “Okay, well, this is where the trend’s really strong. We haven’t really seen a break or that predicted moving average move, uh, below the actual moving average.” Uh, and really opening up some really nice opportunities, uh, from a trading perspective there.
So, we’ll go ahead and leave it there for today. Once again, this has been the Hot Stocks Outlook for July 11th, 2025. Thank you all for watching. Best of luck out there, and bye for now.


