


Register for a Free Live Training
The Hot Stocks Outlook uses VantagePoint’s market forecasts that are up to 87.4% accurate, demonstrating how traders can improve their timing and direction. In this week’s video, VantagePoint Software reviews forecasts for Pulte Homes ($PHM)., Tesla Motors ($TSLA), Ford ($F), Lockheed Martin ($LMT) and Apple ($AAPL)
Hello again, traders. Welcome back to the Hot Stocks Outlook for July 22nd, 2022. Hope you all are having a excellent week out there in the financial markets. As always, plenty to cover here in this week’s Hot Stocks Outlook. If you’d like to learn more about these tools and how they can help you throughout the week, make sure you go to vantagepointsoftware.com. You can sign up for a live training, get more specifics to how this technology can help you out.
We’re going to start out here with shares of Pulte Homes, though, and we’ll move on. We’ve got Tesla and Ford, a couple of automotive stocks. We’ll look at Lockheed Martin, a defense company here. Lastly, we’ll end on Apple. Really encourage you to watch the previous Hot Stocks Outlooks because it’s really highlighted how we’ve been able to identify some of these bigger turns in the market and focus that attention with the help of these predictive indicators.
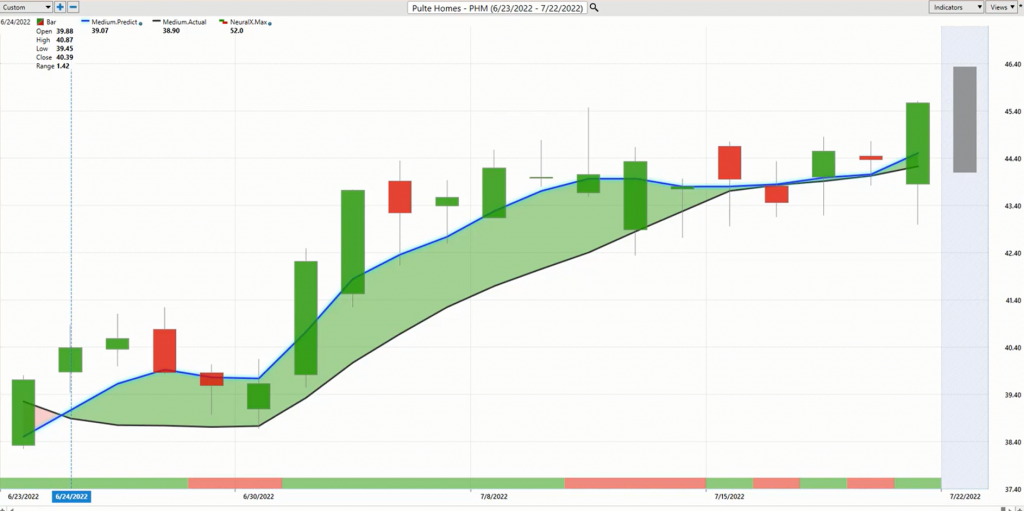
Starting out here with Pulte, what we have here is daily price action, so each one of these candles is representing a full and complete trading day. Right up against all that price data, you’ll notice that there is a black line and also a blue line there. The black line that you’re seeing there, that is actually a simple moving average. It’s a very common technical indicator. What it’ll do in this case is just look back over the previous 10 close prices. It’ll add those all together, divide by 10. What that does is it smooths out the price action and let’s you know where market prices have been over a given period of time, but obviously all that data just comes from the past and is really just going to reconfigure what’s already occurred. The savvy trader needs to be ahead of that next move coming in the marketplace.
So what we’re able to do is actually compare that black, what we’ll call this lagging moving average or a simple moving average, to this proprietary predicted moving average. For that number to get plotted and calculated on the chart for traders every evening, this is where the technology of artificial neural networks is coming into play. It’s performing specifically what’s called intermarket analysis. What that means is rather than just looking back, like traditional technical analysis does at the past prices of Pulte Homes and where the market may have closed, what this software is able to do is understand other markets that are known to drive and influence Pulte.
Now, that’s going to be things like the broader markets, like the S&P 500. That’ll be things like even the commodity markets like oil. But what about things like lumber for home builders? What about things like other ETF groups and other home builders or other home builder stocks? So it’s able to take all of this into account, including interest rates, the value of the Dollar Index, and what it’s doing is actually generating future price predictions of where things are expected to move. So what the software’s able to do is actually take those price predictions and it’s using that predictive data, that technologically driven forecast, and using that data to generate these predictive indicators.
Whenever we see this blue line crossing above the black line, it’s suggesting that average prices are going to start moving up. It’s looking at those inner market relationships, and it’s skewing this crossover to the bullish side so that we can get those signals earlier and be ahead of these moves like we saw with Apple over the past several weeks. But whenever we have that blue line crossing above the black line, you pretty much know that, look, you should expect the market to move higher, but there’s some other tools here that can round out the forecast. So we see, since that blue line crossed above, you’ve got about a 15% rally, but let’s explain some of these other indicators and understand how traders can leverage those tools as well.
If we look at the very bottom of the chart, you’ll see that you have this bar that goes from green to red and back to green. This also is updated every single trading day before the next trading day occurs. But it’s using that technology to solve a different problem for the trader. Our predicted moving average is getting those average prices to help traders recognize those trend shifts in the market. The Neural Index is really geared to be a 48-hour indicator, short-term strength or weakness. You can think of it, over the next 48 hours, next couple of candles there. So that can help traders understand how to get better prices, when to anticipate that strength or weakness in the market.
When you take a close look at this, you’ll notice that when you get this Neural Index going bearish, you often get lower lows over the subsequent price action. You often see the market trade below that prediction of the moving average, but the overall trend is still to the upside. You see it again here. The Neural Index goes bearish and prices run sideways here. The point is that blue line stays above the black line and suggesting the overall trend is up. We saw a lot of strength come into the market, and we see that we never get that crossover to the downside and shares move up, once again, a little bit higher.
This is where it really all comes together. On top of that trend forecast, on top of that Neural Index 48-hour prediction, you’re also given a predicted high and a predicted low. So this is taking that neural network technology and using it to solve different problems for the trader. What is the overall trend? What is the short-term strength or weakness? What is the next day’s short-term high or low levels so traders can really know where to focus their attention as far as levels in the marketplace? So we can bring up all these levels against the actual market data and see how accurate the prediction was before it occurred.
Here’s our prediction for today. But we can see going all the way back from the beginning of the month here in July, multiple levels here that says, look, if you want to be a buyer in this market, we might not get down to that level every single day, but it offers a excellent guide to help traders consistently, not just for a day or two, but one, two, three, four, five, six, seven, eight, nine, ten, ten entries on the way up of a 15% rally in the home builder stocks, and it’s not just Pulte. You understand what’s going on in the other home builders, and, more generally, what’s going on broadly throughout the marketplace.
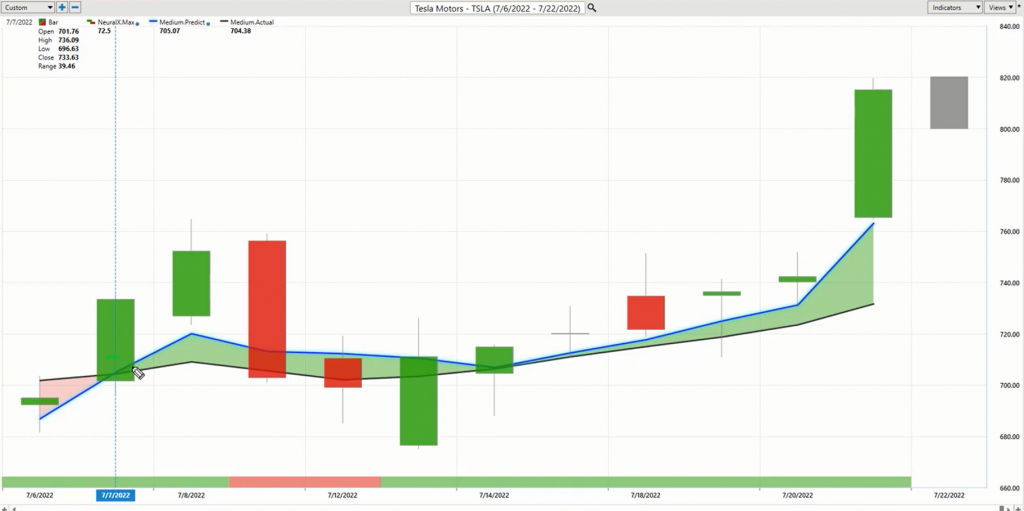
Let’s take a look here at Tesla. Here again, you see a very similar forecast but more recent. You see this blue line crossing above the black line and a lot of volatility as shares run sideways. But when you take a step back here and say, well, there’s where the trends shift. Here’s where the Neural Index is forecasting that short-term weakness. Then you can come in with a tool like the predicted highs and lows, and understand where you want to be looking in the market. We looked at this a couple weeks ago with Apple, and we see this all the time, where you see all the price action takes place and it moves things higher.
Sure enough, the next day, you’re moving to that previous predicted low, and look how good the software is it getting back on track, so understanding that there was a close here, use those neural networks and that technology to get everything back on track so the trader can then make those adjustments and make better trading decisions, whether it’s taking profit at the high end, buying at the low end, and sticking around for all this strength that has come into the marketplace and create a nice little pop on things. There we see Tesla and the rally continuing still. Again, it gets back to a lot of this strength that we’ve seen throughout the marketplace several weeks ago in Apple, seeing that on the NASDAQ, on the indices and saying there’s some real strength here, and we want to say, where should we focus on that strength?
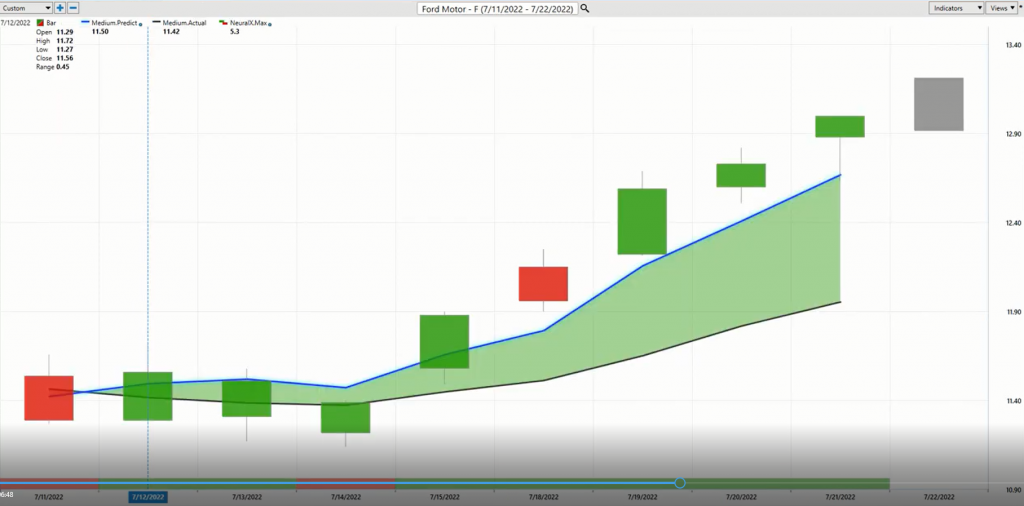
Now, Tesla and Ford are more recent opportunities. You see these crossovers have just recently come through really within the past couple of weeks adding to that narrative of strength that we’ve seen in the NASDAQ and the broader markets. But here very simply, you have Ford crossing blue line over black line. You really have one day where that Neural Index goes bearish, but essentially a bullish forecast all the way through here, and we see shares really accelerating and gapping up over the past couple days. We had all these markets seem to find some really nice bases and find some support. Now is where things are really expanding as you see Tesla and Ford sort of catch up with a lot of the tech space that’s been doing well here. So about a 13% rally to the upside, some really nice entries along the way here. If you have these tools, you could be buying down at 1120, 1130 or so, and this market now accelerating higher.
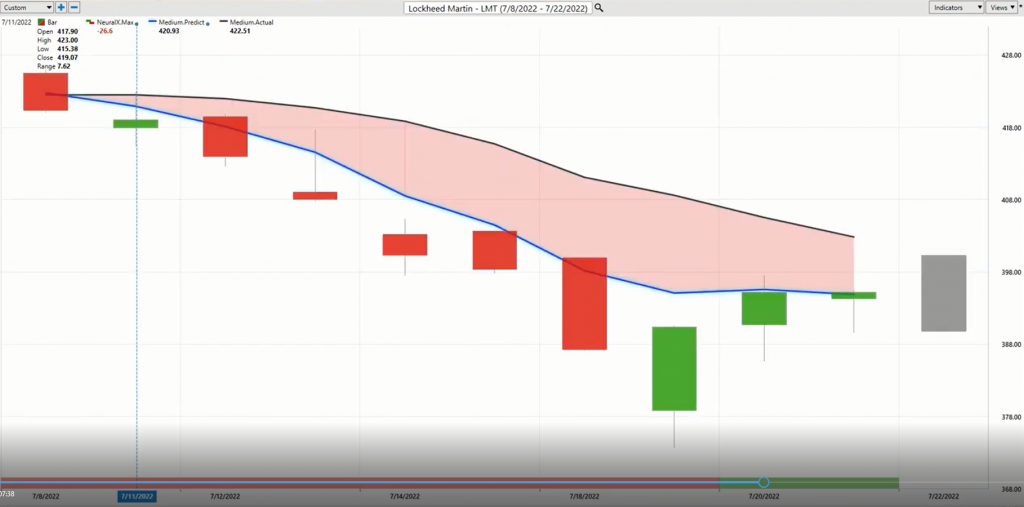
I wanted to take a look at some interesting things in the market here. The defense sector not doing well. When we see that there’s a lot of nice areas to be a buyer here in July, well, Lockheed Martin, Northrop Grumman, these things are really not the places where you want to be. We see just the exact opposite of the bullish forecast with this crossover to the downside midpoint in July here, and very clearly not a place that you want to be. Now, that general strength has led to some short-term strength. You see that Neural Index getting bullish, and we may see, again, this range get filled and prices stay supported. But is this an area where you really want to be setting the portfolio up to try to make money on the bullish side? Well, not only that, but it might make a really nice hedge on some of those bullish positions, maybe in Ford or Tesla or Pulte or potentially Apple.
I know we look at this every single week, but we can only look at one day a week to take a look at these forecasts. So we just keep bringing in the same forecast to highlight the big narrative of the market here.
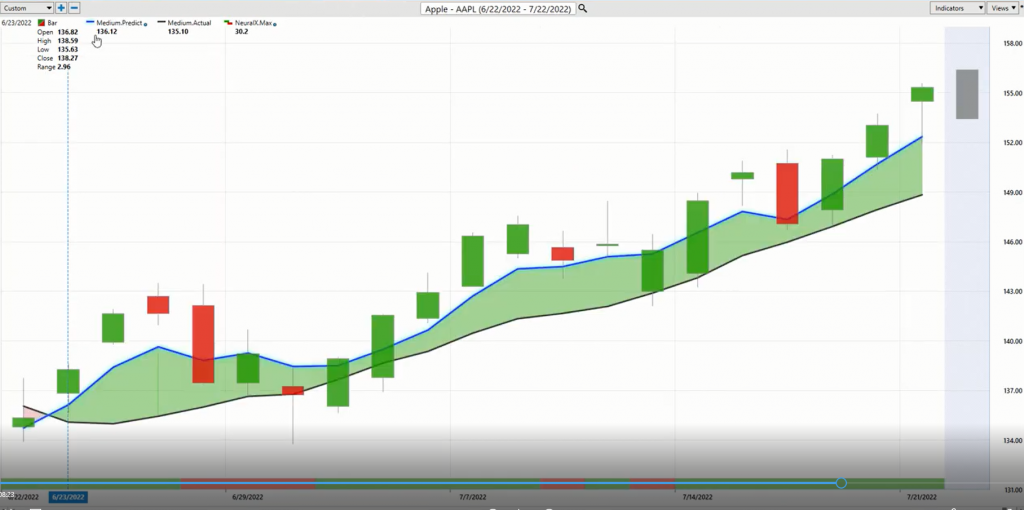
So what we were able to detect really all the way back in the midpoint of June here is that Apple’s starting to move higher. We’re seeing a lot of these markets shift and move higher, and Apple has just kept marching higher day after day after day. So we see a very similar picture as far as these home builders and some of these stocks turning up about 15 or so percent. But you see, this is over 20 days and really longer than that as we saw those really early forecasts come in and indicate that this is probably the bottom, not a bad place to look for prices down here at 134 or so. Now we’re seeing things certainly break out and a nice opportunity for traders to trail or stop, take some profits, and manage these things as they continue.
But in the same way that you want to identify this shift several, several weeks ago, you want to understand how to manage that more effectively. So we can take this closer look at things like the VantagePoint predicted highs and lows over the past couple weeks. Again, you see these levels coming in here to help you make those better trading decisions and exploit that bullish side of the marketplace here and, constantly as well, have you buying on this weakness right on the lower end of things so as the market expands and the range goes higher, you’re set up for that portfolio to really benefit.
Again, just sort of rounding out where we’ve come from over the past several weeks, but a really good example of just how these tools can help the traders identify these very important shifts in the marketplace very early, but, more importantly, manage those opportunities once you’re in them. Because once you’re in an opportunity, well, you want to know, hey, should I be holding this to make sure I capture that bigger move, or are things starting to shift again, and you need to go ahead and adjust the portfolio? Once again, this has been the Hot Stocks Outlook for July 22nd, 2022. Thank you all for watching, best of luck, and bye for now.


