


Register for a Free Live Training
Hot Stocks Outlook uses VantagePoint’s market forecasts that are up to 87.4% accurate, demonstrating how traders can improve their timing and direction. In this week’s video, VantagePoint Software reviews forecasts for AMD ($AMD), Solid Power ($SLDP), Lantronix ($LTRX), Alphabet ($GOOGL), Dollar Tree (DLTR), Caterpillar (CAT)
Hello again, traders, and welcome back to the Hot Stocks Outlook for July 25th, 2025. Hope you all have had an excellent week out there in the financial markets.
And as always, we’re here to cover the most recent Vantage Point AI predictive forecast. So, if you haven’t already, be sure to go ahead and click on the link down in the description below, and you can get signed up for a live demonstration and learn all the specifics about how these predictive indicators and trading tools are helping traders make much better decisions out in the marketplace.
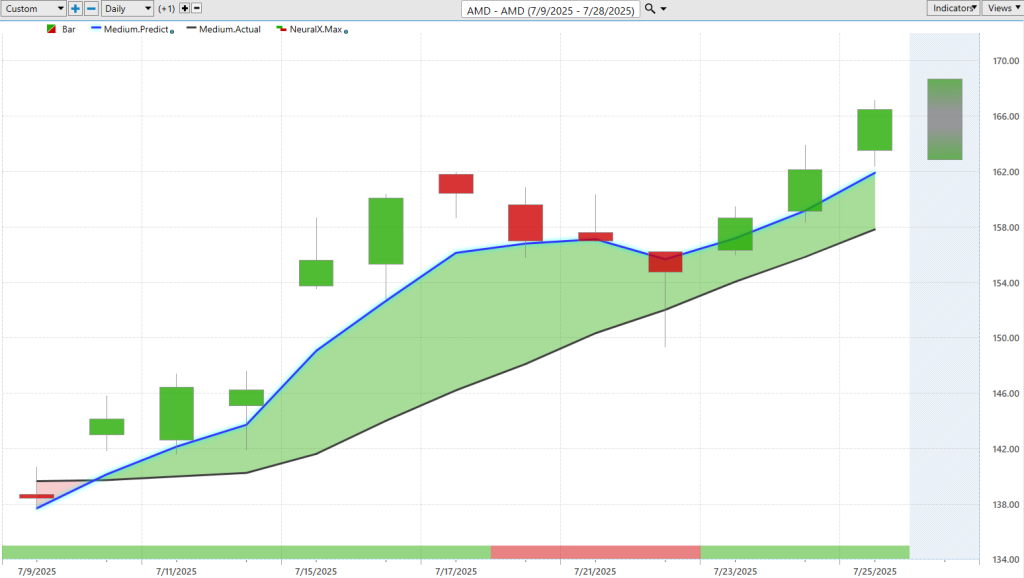
Now, we’ll go ahead and start out with shares of AMD. It’s a really good example of how this suite of predictive indicators works together. What we’re seeing is daily price action — each one of these bars and candles represents a full and complete trading day in shares of AMD.
Right up against that price data, the first thing we’re going to cover is this black line and blue line value. The black line you’re seeing is a simple moving average — in this case, a 10-period simple moving average. This is a very common technical analysis indicator, and what it does is it looks back at the previous 10 close prices, adds those together, and divides by that number.
This smooths out the existing price action. But one of the weaknesses with tools like this is that all the data generating those moving averages comes from the past. So it’s really just restructuring what’s already occurred in the marketplace. Traders needing to be ahead of the next movement higher or lower — well, Vantage Point traders are able to compare what we might call that lagging simple moving average to the proprietary predicted moving average.
This predicted value — which we can think of as a forward-looking price — is calculated and plotted on the chart each evening using artificial neural networks. These networks perform what’s called intermarket analysis. Rather than just looking at previous prices, the technology looks at other markets known to drive and influence future prices.
This includes things like ETF groups, other individual stocks, competing stocks, markets with inverse or positive correlations, leading and lagging relationships. It goes global — analyzing the dollar index, global interest rates, and even commodities — depending on what your target market is.
With the help of that data, Vantage Point extracts valuable price clues to forecast what’s coming next. With this predicted moving average, traders get early warning signs when average prices start to move higher. That’s a signal to take a trend position, a swing trade, or simply understand that bullish signals are coming through.
In this case, we saw about a 14% rally in just the past 10 trading days in AMD. But what’s really exciting is how all these tools work together.
You’ll notice in shares of AMD, there’s a bar here that changes from green to red and back to green. This is the neural index — another AI-powered indicator using intermarket data — designed to gauge short-term strength or weakness over a 48-hour period. When it’s bullish, you get upward moves, even gaps on the chart. When it turns bearish, you’ll see some lower lows before it flips bullish again and the uptrend resumes.
You’ll also notice the blue line never dropped below the black line — in fact, there’s strong separation between the predicted and actual moving averages, indicating a strong trend. That helps traders know when to buy dips or expect short-term weakness.
Finally, you’re provided with a predicted high and low each day — intraday levels calculated in advance. On Friday, for example, you’ll see Friday’s candle complete and can evaluate how accurate the predictions were.
You can look back at the predictions and see how early entries around $143 in AMD produced strong results — especially during volatile periods. The predicted lows were consistently hit, and the trend resumed upward. Even on days when it looked like things might be turning, those lows forecasted by the model acted as key entry levels before price continued to rise.
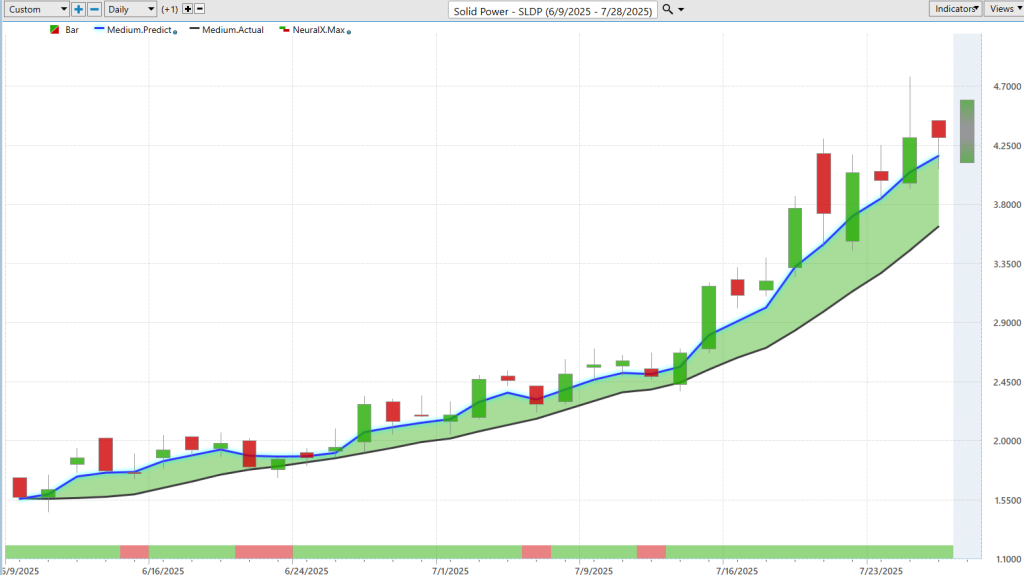
Here’s Solid Power. There’s been a lot of noise around battery and energy names being vital to the economy. This is a lower-priced stock, but we started to see bullish crossovers back in mid-June — with the blue line crossing above the black line and the neural index staying bullish.
Even on down days with small gaps, the neural index stayed green. This consistency contributes to the 80%-plus accuracy rate of the tool in predicting 48-hour directional movement.
So, when you align trend direction with momentum strategies, the result is some powerful moves. For Solid Power, you can see how the predicted highs and lows act as a trading roadmap — levels adjusted each day based on fresh intermarket data.
As Solid Power’s blue line crossed the black line, traders saw early signals and multiple price targets hit. That led to a very impressive 155% rally over just 31 trading days.
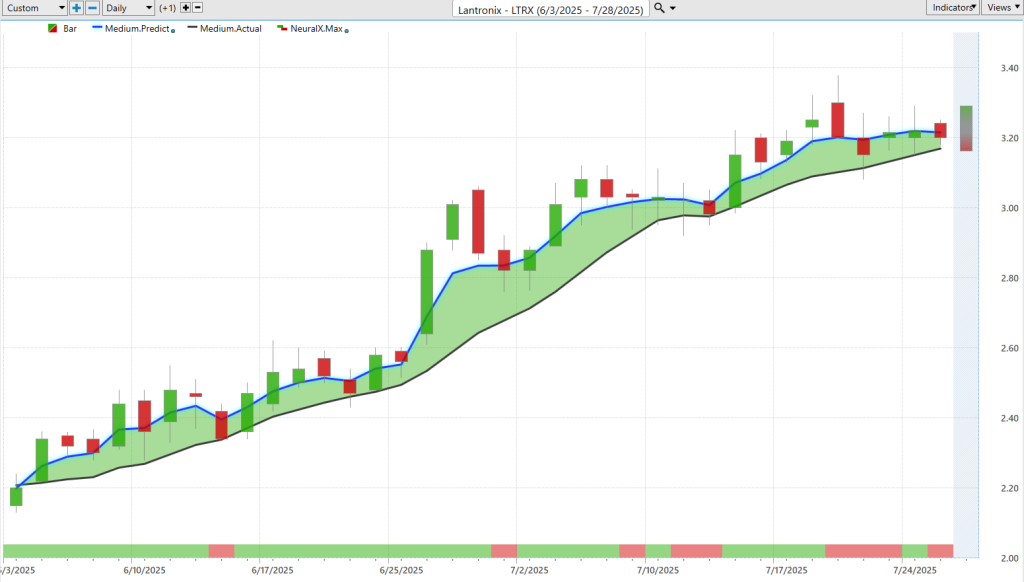
A few weeks ago, we looked at Lantronix — another inexpensive stock showing strong trends. Again, Vantage Point provided clues through predicted daily ranges. Even though day-to-day price moves may look small, they were significant in percentage terms.
Recent activity in Lantronix showed rebounds off predicted lows and rallies up to predicted highs. Just this week, a 5% move occurred in a few days. Over the past 33 trading days, Lantronix rallied about 39–40%, offering traders multiple chances to take profits or ride the trend.
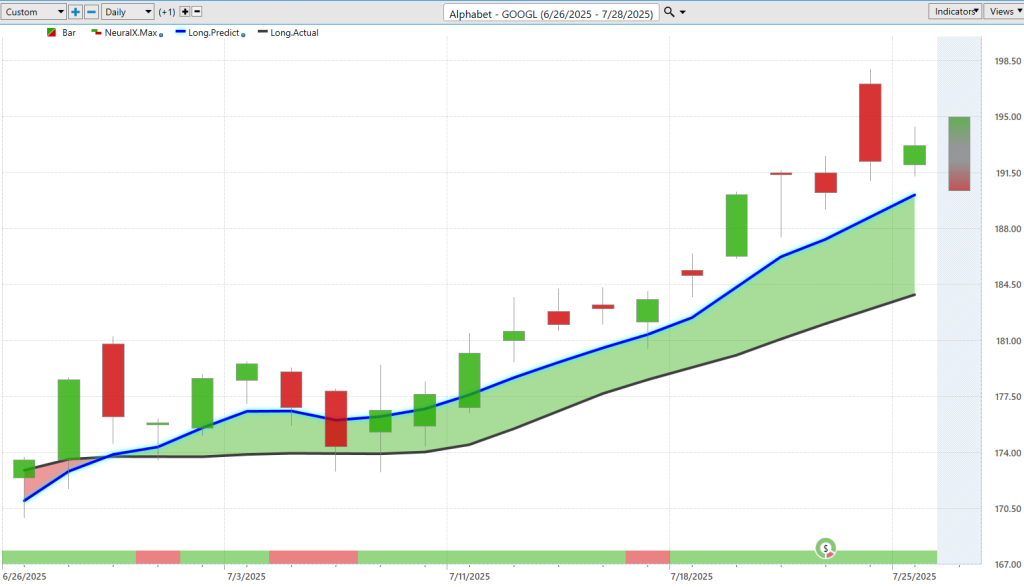
Now let’s look at Alphabet (shares of Google). We had an earnings report during the uptrend, which can create noise the software doesn’t account for — that’s where human judgment comes in. Still, even with that, the trend stayed bullish.
Despite brief bearish turns in the neural index, the blue line stayed above the black line. Price repeatedly approached the predicted lows before bouncing back upward. Leading into earnings, the price climbed from around $174 to $197 — a solid move in a short time.
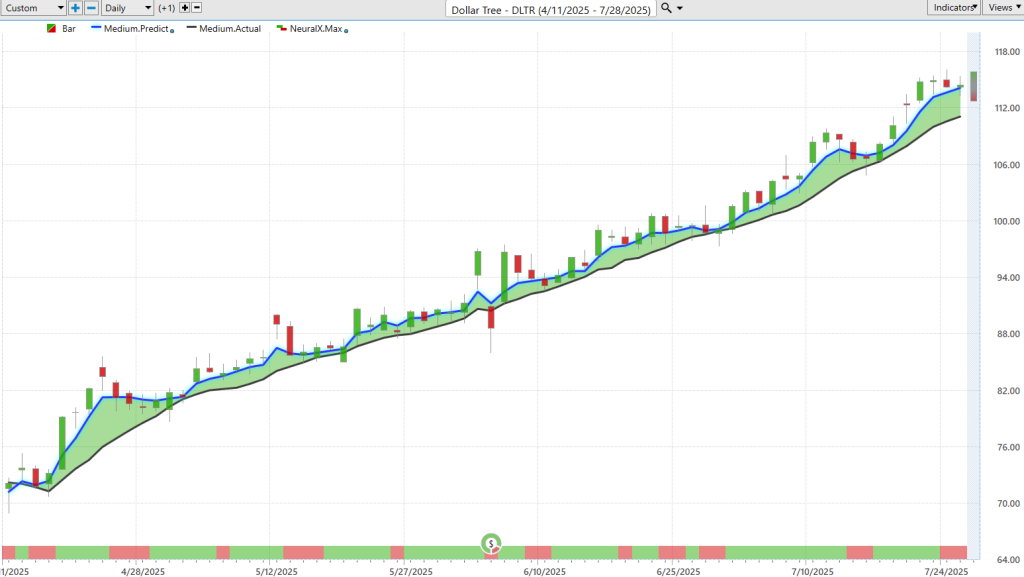
Next, we have Dollar Tree — a market in a persistent uptrend. Earnings hit right in the middle of the chart, creating some volatility, but the trend stayed bullish.
The predicted lows offered excellent opportunities to enter on dips. Since April, Dollar Tree has rallied 57% in just 69 trading days — with especially strong movement over the past week.
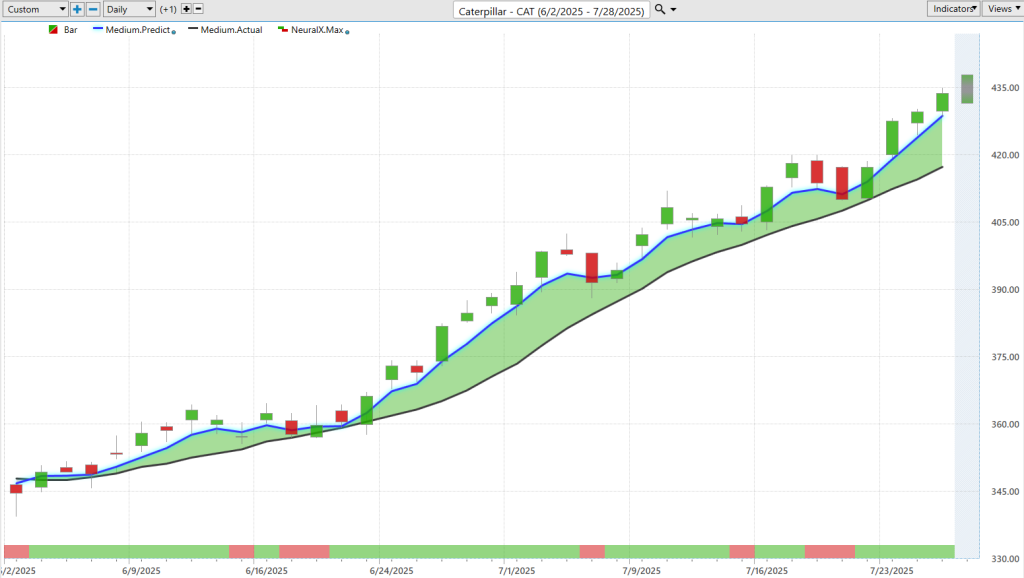
Finally, Caterpillar — again, we see the classic Vantage Point setup: blue line above black line, and intermittent shifts in the neural index. Even during sideways movement, the predicted lows gave good guidance for where the market might bounce.
Caterpillar has seen a 22% rally over the past 35 trading days. It’s part of a broader strength trend among construction and building materials companies.
These are stocks that may not be flashing on everyone’s radar, but with the help of predictive AI, they’re delivering actionable trading opportunities.
So, we’ll go ahead and leave it there for today. Once again, this has been the Hot Stocks Outlook for July 25th, 2025. Thank you all for watching. Best of luck out there, and bye for now.


