




Register for a Free Live Training
The Hot Stocks Outlook uses VantagePoint’s market forecasts that are up to 87.4% accurate, demonstrating how traders can improve their timing and direction. In this week’s video, VantagePoint Software reviews forecasts for Intercontinental Exchange ($ICE), Ross Stores ($ROST), ADT ($ADT), Tesla ($TSLA), JD.com ($JD)
Hello again, traders, and welcome back to the Hot Stocks Outlook for July 31st, 2026. I hope you all have had an excellent week out there in the financial markets, and, as always, we are here to take a look at the most recent VantagePoint AI predictive forecast.
So, if you haven’t already, uh, be sure to go ahead and click the link down in the description below, and you can get signed up for a live demonstration, uh, and learn all the specifics about how these predictive indicators and artificial intelligence technologies are helping traders make much better trading decisions out in the marketplace. Uh, and so we can start out here with a, uh, a very important area of the market in ICE, Intercontinental Exchange.
Intercontinental Exchange ($ICE)
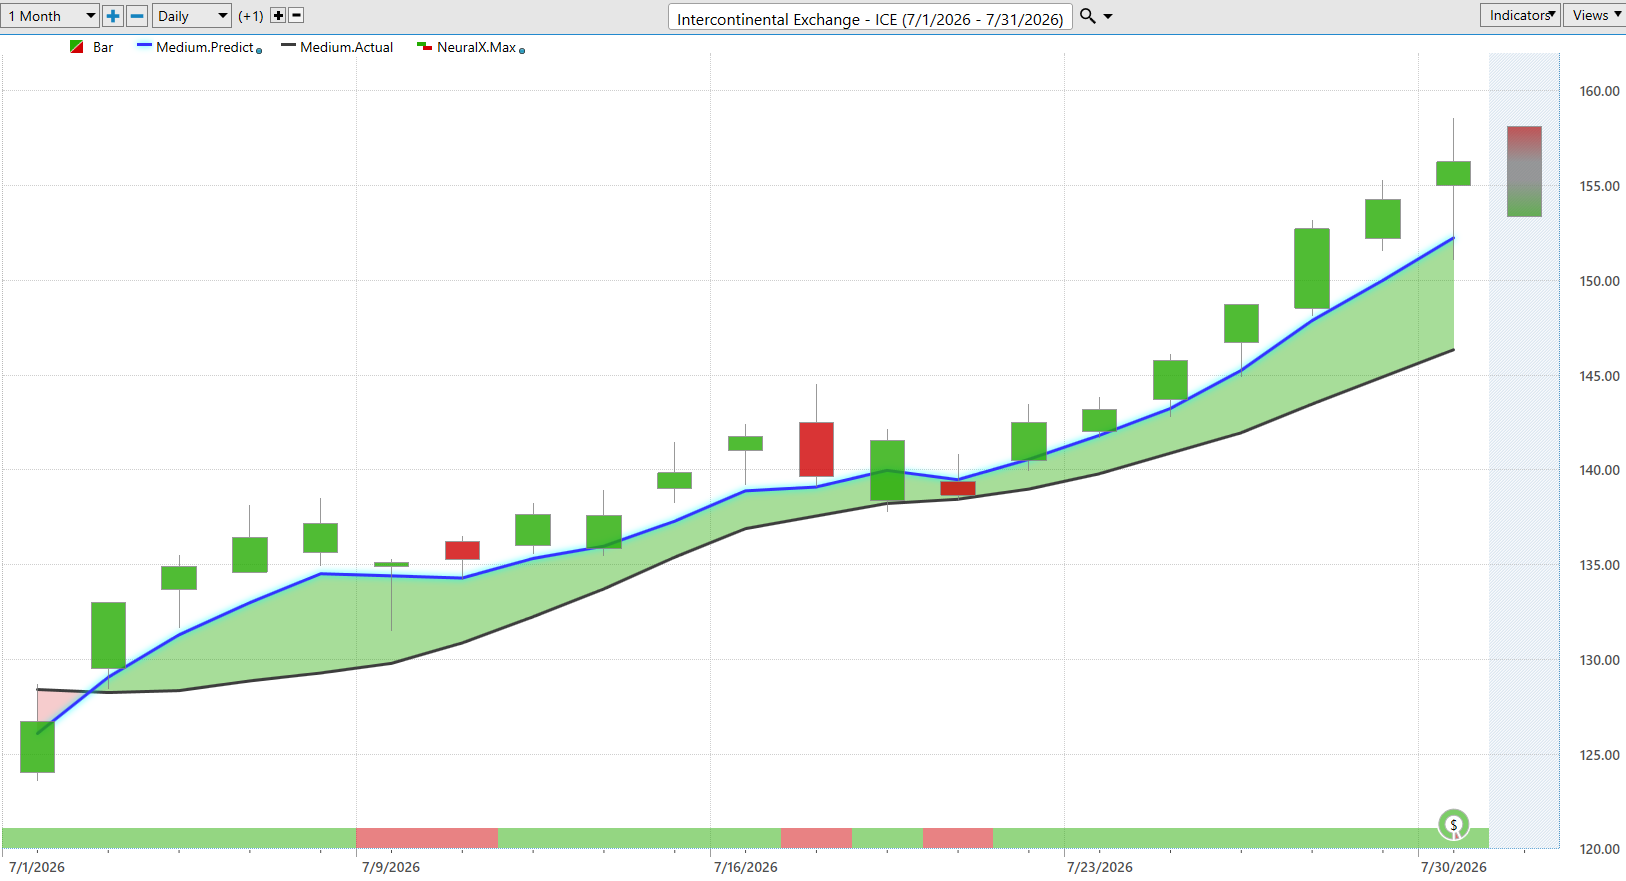
A lot of trading, uh, going on at the ICE. Uh, and again, a really great example of how all of these predictive tools work. And so what we can examine here is that all of this, all of these bars, these candles that you see on the chart here, well, those will represent an individual trading day, right? So, a full and complete trading day. All of VantagePoint’s predictive indicators wait for the global markets to close and then predict out for the next trading day.
Uh, and so against all that price data, you’re first going to notice that there is a black line, but also a blue line value. Uh, and so the black line that you’re seeing there on the chart is really a simple moving average, what we refer to as the actual simple moving average. Uh, and in this case, it would simply be a 10-period, which would mean it looks at the previous 10 close prices, adds all those level, uh, trading days together, and then divides by 10, essentially that 10-day number, uh, to create that moving average. And this is how traditional technical analysis works. And really the weakness is that all of the data is coming from the past.
So, it really just reconfigures what has already occurred and doesn’t have any forward-looking predictive capability. And so, this really works for VantagePoint traders as a baseline, right? Letting us know where market prices have already been. Uh, but VantagePoint traders every evening are going to be provided this blue line value, uh, which essentially is a price. And for this number, for that to get calculated and plotted on the chart every evening, well, this is where that technology of artificial neural networks comes into play.
Now, what VantagePoint performs is what’s called intermarket analysis, meaning that it’s using the data from other markets that are known to drive and influence those future prices. So, when we’re looking at the Intercontinental Exchange, well, this can be things like other individual stocks. Very important on really all equities are going to use a good number of other individual stocks, potentially in the same sector, potentially some relationships, whether they be leading, lagging, positive, or inverse correlations, that might not seem obvious, uh, to an individual trader.
Uh, so it’ll also look at things like ETF groups, right, without the, probably throughout the financial space, uh, but this is where VantagePoint not only looks at these areas within the equity markets, but even looks at things like the value of global currencies, interest rates, uh, and even potentially global commodities where applicable. So, certainly when we look at a forecast for a gold mining stock, it’s going to look at a lot of those, uh, precious metals, some of the base metals, some ETFs and individual stocks, and forecast that out.
But every single market has its own individual, uh, selection of markets that are used to generate these highly accurate predictions. And so it’s taking that huge amount of data and using that, uh, running that through those artificial neural networks and then forward-looking and making those predictions. So, whenever that blue line value, essentially our predicted moving average here, crosses above or below the actual moving average, it’s indicating that these prices are likely to start moving higher.
Uh, and you see since we got this crossover about 20 days ago, really at the beginning of July, Intercontinental Exchange stock’s up about 20 and a half percent, a little over 20%, uh, just over the course of the month here. So the financial space as a whole has actually been performing quite well.
Uh, if we go ahead and look at the very bottom of the chart, though, this is where things get shorter term. Uh, here you see this bar that goes from green to red, back to green. Well, this is what’s called the VantagePoint Predicted Neural Index, and it’s tuned to solve a different problem. It’s really one of the great benefits of artificial intelligence, is we can really ask it a question, figure out, you know, uh, uh, how can we take this data and further refine this problem we’re trying to solve?
Uh, and so the problem here is really short-term strength or weakness over the next 48 hours, or what you can think of as two trading days or candles moving forward, uh, across the price action. And this has a very high level of accuracy associated with it, 86%, 87%, across a very wide swath of markets, through earnings reports, Fed announcements, all this geopolitical risk going on. Uh, it gets that problem right with a very high level of accuracy.
So traders can use that to potentially adjust their position, do some short-term trading, and really anticipate what’s likely to occur in the market here. Uh, so you see as that Neural Index goes bearish, uh, we actually do get a little bit of selling that next trading day. But as the Neural Index goes bullish again, you see that’s where the momentum picks up in the market. You get bearish, you get a couple days of weakness, back to bullish, that momentum, uh, picking up in shares. So this is where traders can leverage this information to their advantage.
And so lastly, we’re even provided a predicted high and a predicted low. So again, to that point of asking the artificial intelligence these questions of what is likely to be the very short-term, intraday predicted high and low level for the next trading day. Uh, and this is where things get very interesting, is we can look back and see how accurate are all of these predictions against the market data.
Uh, so we make these videos every Friday before the market trades. And so we’ll actually get a real physical candle here that, you know, once the trading day is over, but that predicted high and low level will stay stationary. And we’ll see how accurate all of these levels are. And we can see as this trend gets started, you really have this roadmap that’s telling you where you might want to accumulate a position in any asset.
And one of the great advantages of this is that it’s adaptive, meaning every single day we get new data from those intermarket relationships, new predicted high and low, Neural Index, uh, and predicted moving average, uh, uh, uh, predictions, essentially. So here we’ll go over to Ross Stores, and this really works the exact same way, uh, regardless of the markets that you’re trading.
Ross Stores ($ROST)
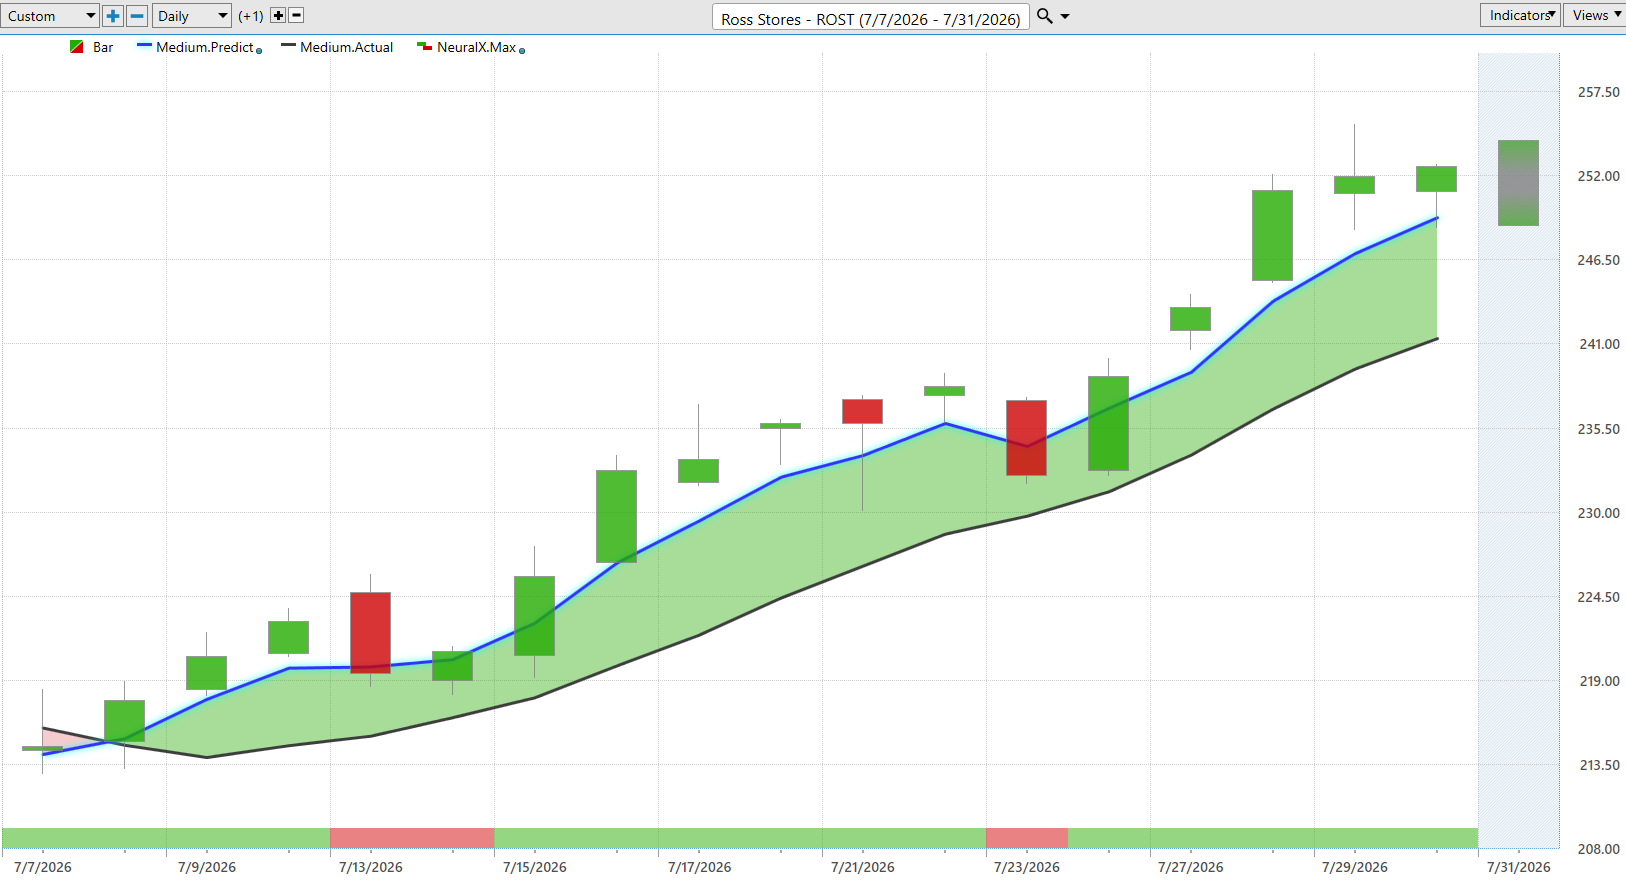
So here we have, in the retail space, blue line above the black line, and again notice this Neural Index getting bearish. You see a couple days of sluggishness where you’re really not moving forward over the next 48 hours. Uh, but overall, the trend very bullish.
Now here the Neural Index goes bearish. We get a quick, uh, upswing in the marketplace. So it, you know, essentially that trading day, it’s wrong, but it’s getting it right, again, a huge number of these trading days, upwards of close to 85%, 90%, uh, gets that problem right of, are we likely to see bullish price actions over the next couple of trading days?
Uh, and so again with Ross Stores here, we can take a look at that, uh, predicted high and low map. Uh, and you see here that this early predicted low getting hit, even as we get this price action here where all the price action is very bullish here, but we get that reversion moving back towards some of these levels. Uh, and you see everything just adjusting, giving you a nice roadmap of where might you want to accept some prices, uh, to participate in the uptrend.
You see shares up almost 15% here, uh, just in about 14 or 15 trading days from that predicted low that got hit.
ADT ($ADT)
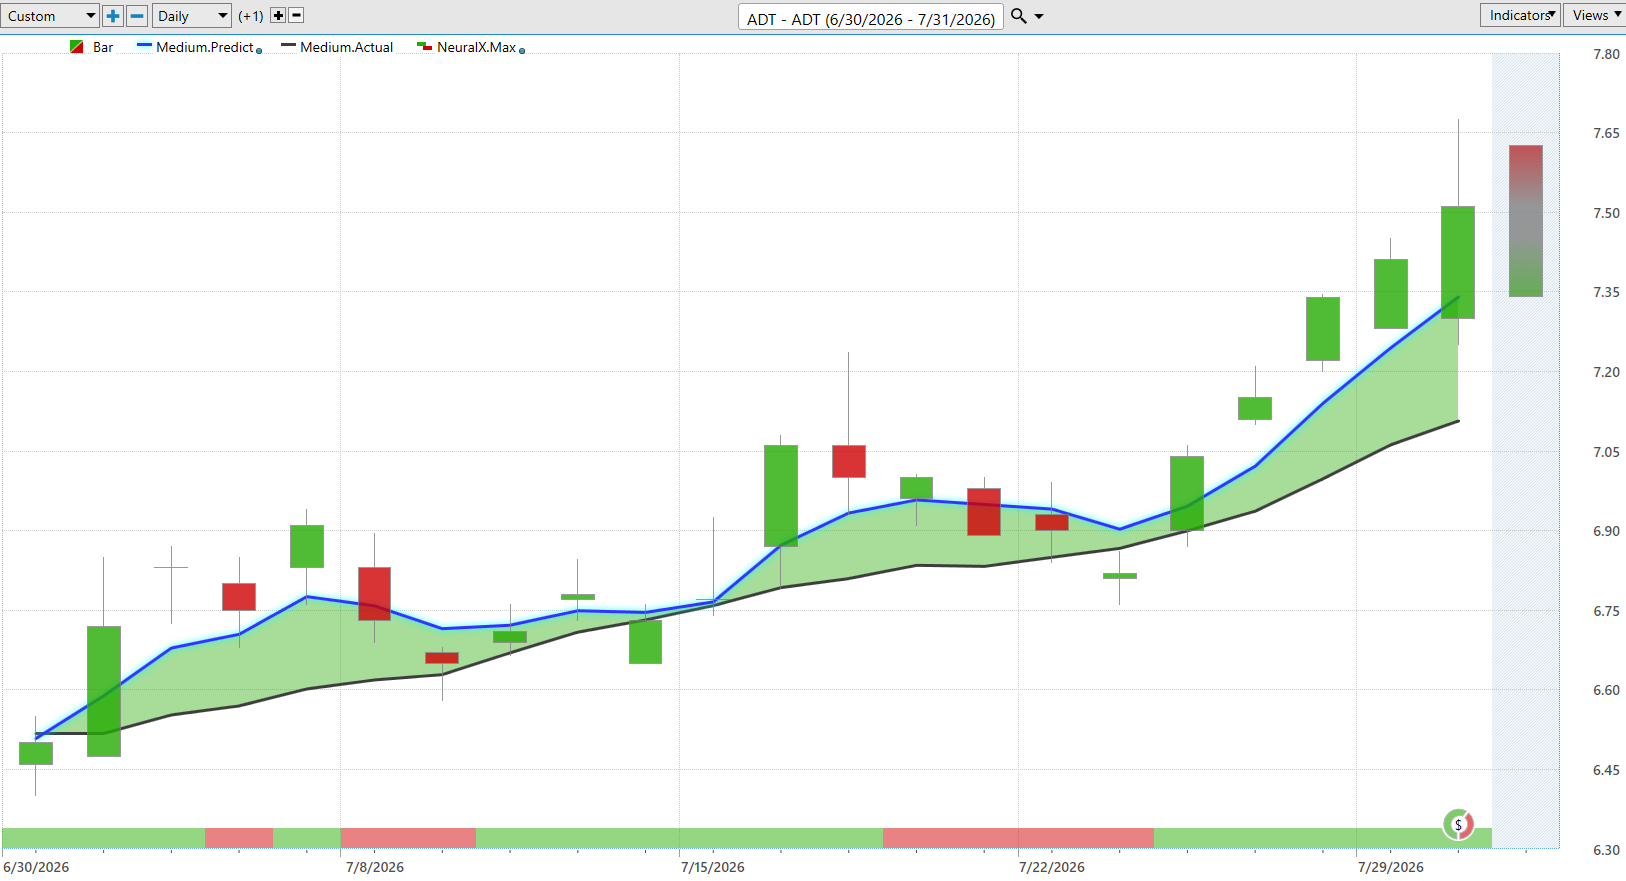
Now here’s ADT, uh, a little bit more of a gappy stock, but I wanted to bring this through again to highlight how this can help you, uh, really regardless of the markets that you’re focused in on and want to target here. So, uh, we see we get this strong indication of an uptrend, that blue line crossing well above the black line. And so you get these periods where the Neural Index goes bearish, and you see this somewhat choppy price action where you start to trend lower.
But notice how that blue line just remains above the black line. So even as the market spends a couple of weeks really not doing much of anything, you’re still getting that separation between these values, a lot of strength from the Neural Index. And you see that when you get that combination of factors, that’s really where we see momentum, uh, pick up in the marketplace.
Uh, so again, these predicted highs and lows giving you that roadmap that says, okay, well, look to accumulate a position. Uh, you see we constantly see things like this where you get all the bullish price action for one day. You generally want to keep an eye on those previous predicted lows, uh, over that 48-hour period, and you see the market fills in that price action, uh, and then continues on here.
Again, you see a gap down to the previous low, but the overall trend very clearly indicating that you’d only want to go long, take profits on longs in a market like this. And even with some of this noise around earnings, you see it gaps down right to the predicted low and then has a very strong bullish day as buyers come into the market, uh, even just yesterday here around earnings.
Market went up about 5%, uh, before settling back towards the VantagePoint predicted high of the day. Uh, overall here, uh, pretty nice move. Shares up again about 15% over about 19 trading days, uh, since that predictive forecast came through on the bullish side.
Tesla ($TSLA)
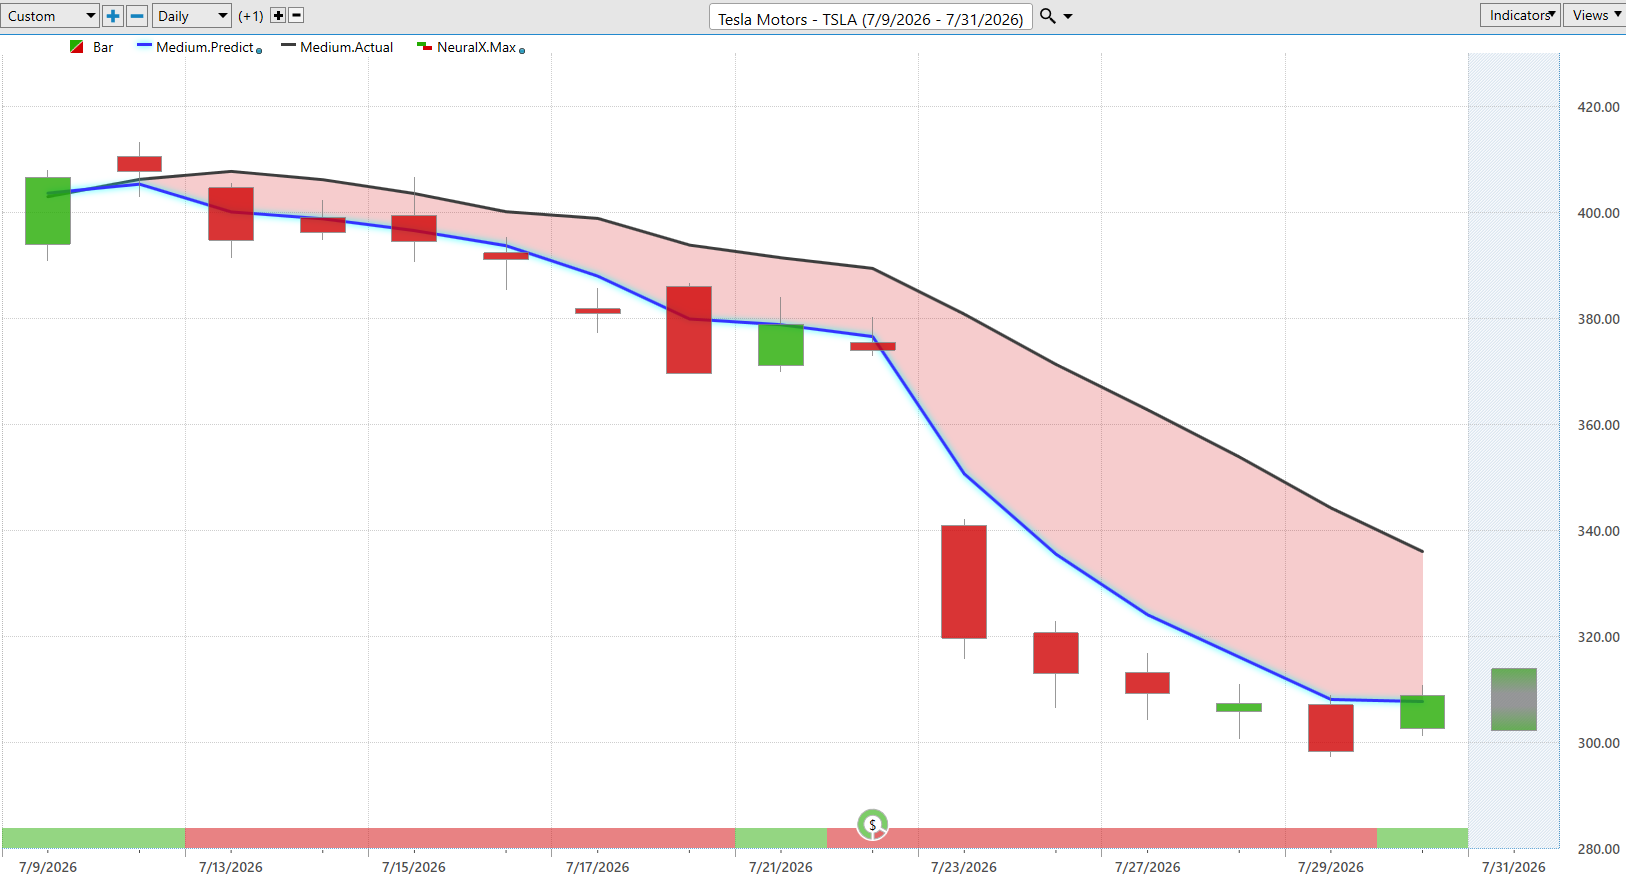
Uh, now here’s Tesla. Obviously a very popular, highly traded stock. Now notice this, how the market’s starting to climb up and creep up a little bit. But notice that predicted, uh, moving average actually crossing below the actual moving average.
So, uh, Neural Index gets bearish, and you see this is where we start to see that momentum really kick in. Uh, we have this earnings date coming here. So sometimes you just get a little sideways price action going into earnings. But very clearly here, market is in a downtrend going into earnings.
So again, all you’d want to do is take, uh, short positions, take profits on those shorts. Uh, and we do see the market declining, uh, pretty aggressively here, down about 24%, almost 25%, in just 14 trading days. That’s just about three weeks on the calendar, uh, uh, moving down very aggressively here in the, uh, month of July.
JD.com ($JD)
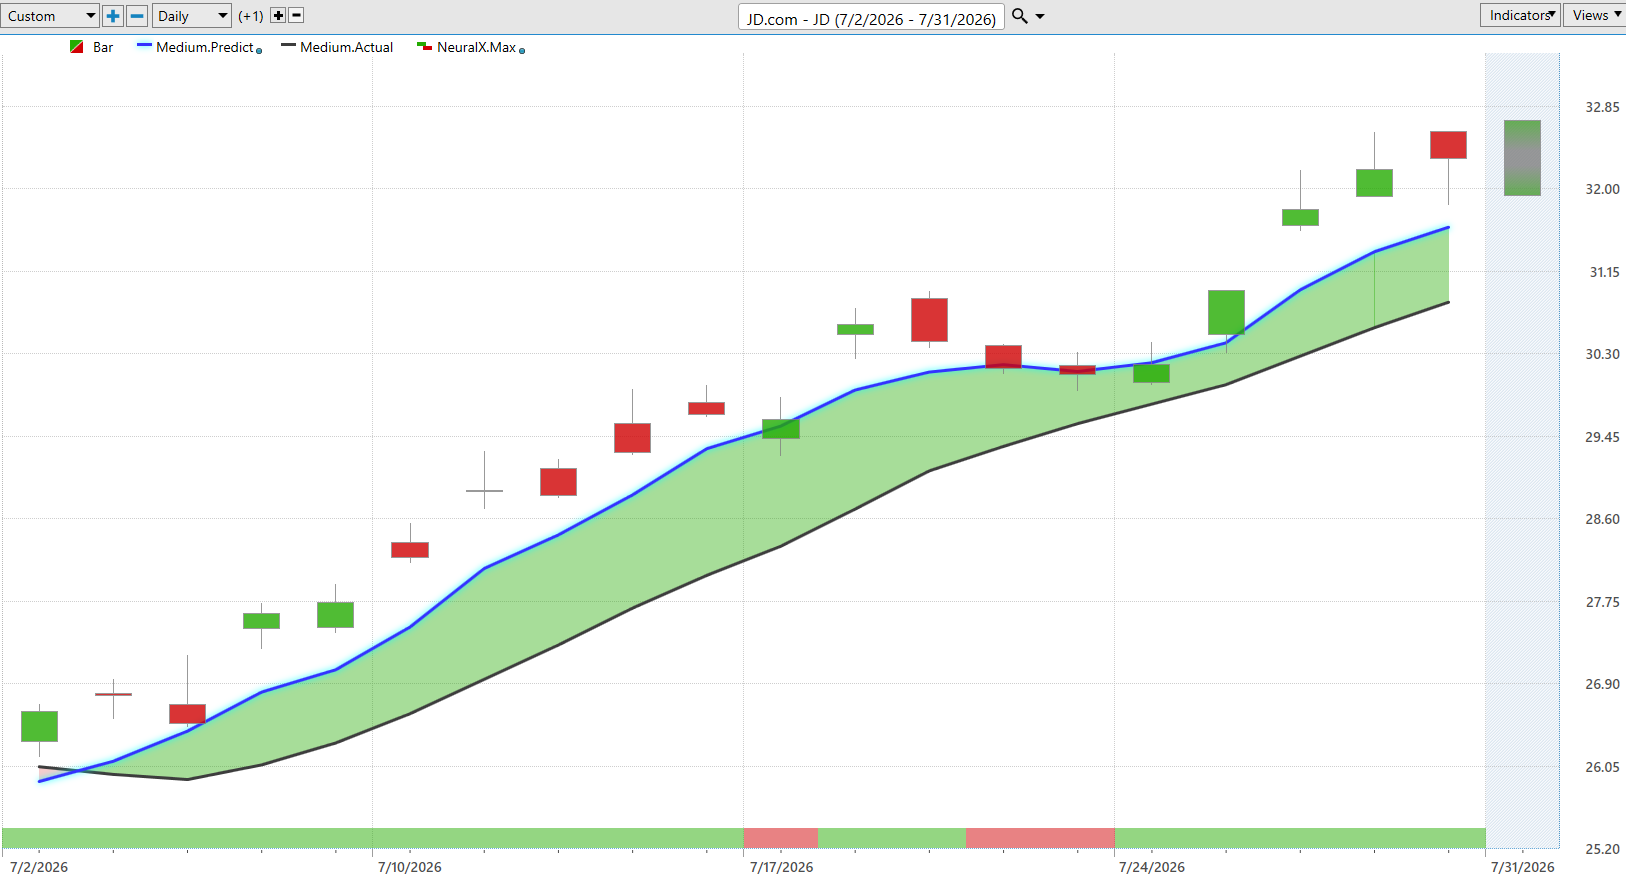
Uh, lastly here, here’s actually a Chinese stock, and these stocks have actually been performing quite well along with a lot of those financial stocks. Uh, here you see JD, blue line above the black line. Neural Index very bullish here. Again, you see this Neural Index getting bearish, and that’s where you run into this sideways, choppy period of the trend.
I mean, if you really take a step back here, you see a lot of strength moving higher. Once that Neural Index starts to go bearish, we start to, uh, run sideways, but then again, Neural Index bullish, and that’s where you see that momentum. And, and so this is where traders can develop a trading strategy around these tools, help it really guide your action on whether you’re adding to a position, potentially getting aggressive for a shorter-term day trade, or expecting, you know, short-term weakness and weaker prices where you might want to look to, uh, scoop up shares down at the predicted low, be a little bit more conservative here.
Uh, so again, you see these predicted high and low levels, uh, hitting this level early on, uh, another gap down here moving right to the predicted low, and even yesterday moving down to a predicted low, uh, and trading within the range there, uh, overall about a 22% rally here in the past 18 trading days.
So, uh, very exciting stuff. We’re seeing a whole lot of volatility, very aggressive moves, uh, in the market. Some of these, uh, shares going up, you know, very aggressively over a few days, then crashing down about half, uh, uh, the progress they made over a few days. So, uh, you want to make sure you’re really prepared for that on an intraday basis.
Uh, but clearly, VantagePoint is doing a great job of identifying, look, what is the overall trend, right? If you want to identify those trending moves, stick with the trade. Uh, that’s where you can sometimes sit through that volatility, and VantagePoint does a good job of keeping things on the right side of the market.
So, uh, we’ll go ahead and leave things there for today. Once again, this has been the Hot Stocks Outlook for July 31st, 2026. Thank you all for watching. Best of luck out there, and bye for now.