


Register for a Free Live Training
Hot Stocks Outlook uses VantagePoint’s market forecasts that are up to 87.4% accurate, demonstrating how traders can improve their timing and direction. In this week’s video, VantagePoint Software reviews forecasts for SPDR SPY($SPY), Meta Platforms ($META), E.l.f. Beauty ($ELF), Transocean ($RIG), United States Oil ($USO), HESS (HES)
VantagePoint A.I. Hot Stocks Outlook for June 13, 2025
Hello again traders and welcome back to the Hot Stocks Outlook for June 13, 2025.
I hope you all have had an excellent week out there in the financial markets, and as always, we’re here to take a look at the most recent VantagePoint A.I. predictive forecast. So if you haven’t already, make sure you go ahead and click on that link down in the description below and get signed up for a live demonstration so you can learn all the specifics about how these predictive indicators and technologies are helping traders make much better trading decisions when out in the marketplace.
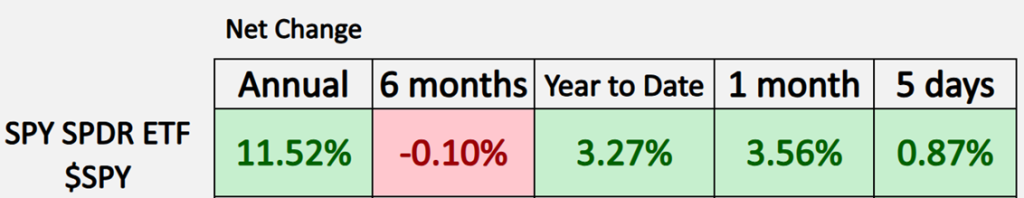
Now, as we typically like to start out, we can take a look at the S&P 500 via the SPY ETF.
And so, what we can see here is year to date, now we are actually up 3%—so not bad. We’ve seen a lot of stocks, especially on the tech side, perform extremely well. But of course, we’ve had a very difficult six months, and a lot of those opportunities really opened up in April, and now we’re seeing even more things open up. So let me go ahead and share some of this with you.
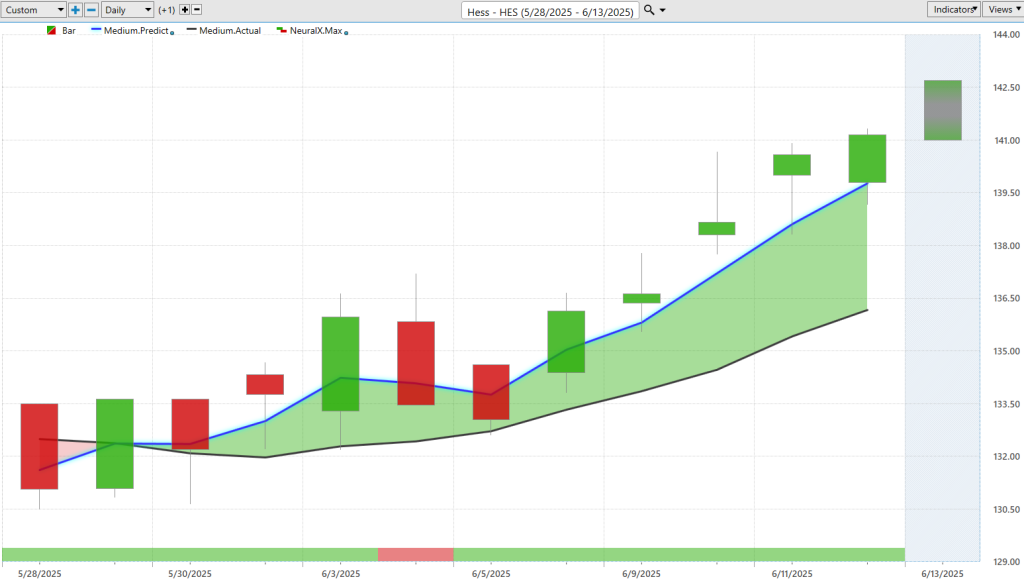
As we really see energy stocks and energy Hess (HES) prices on the rise, this is a really great example of how intermarket analysis works and how other markets are going to be very important in offering price clues as to where things are likely headed next.
And so, as we look at shares of Hess Corporation, we can see that we have daily bars and candles, right? So each one of these candles every week represents a full and complete trading day. And it’s right up against those daily candles that we’ll have a black line and a blue line value.
Now the black line that you’re seeing there is a simple moving average, or what we refer to as the actual simple moving average. And in this case, and every week, it’s a 10-period. So it just looks back at the previous 10 closed prices—it’ll add all those closed prices together and then divide by that number.
One of the weaknesses with traditional technical analysis like this is that all the data comes from the past. So it really just tells us where the market has been, but not where things are headed next. And so VantagePoint traders use that as a baseline, again to indicate, hey, where are prices according to this very simple metric. But VantagePoint traders, of course, are able to compare that to the VantagePoint proprietary predicted moving average.
And for this value, essentially a price gets calculated and plotted on the chart every evening. Well, this is where that technology of artificial neural networks comes into play, and they’re performing what we would call intermarket analysis.
Now, this is very important because this is what gives VantagePoint traders a huge edge in the markets. And we can see this playing out across the global marketplace literally as we speak here.
And so, what this means is that rather than just looking at past prices and reconfiguring what’s already occurred, VantagePoint’s technology is able to look at other markets that are known to drive and influence future price. And this offers some extremely valuable price clues as to where things are headed next.
And so, this can literally be dozens of markets. It can be other energy stocks. It can be energy ETFs. It can also be the major commodities like oil, gold, and silver markets—especially if you’re looking at basic material and mining stocks. Wherever it’s applicable, it’s going to understand that hey, these are the important correlations to pay attention to.
And this goes all the way down the lines into things like the value of global currencies and even interest rates. So it really takes this global approach in analyzing, hey, how are things likely to proceed moving forward, and incorporates those price clues into these predictive indicators.
So whenever VantagePoint traders see that predicted moving average cross above the actual moving average, well, it’s suggesting, “Look, prices are going to start moving higher.” The traders can then look to take a bullish position in this case. And so we see that since those crossovers have come through, market’s up about 6.5%.
But what’s very important to understand here is that VantagePoint has features within it that allow traders to scan a very large number of markets. And so what we’ve seen is a lot of these predicted moving averages across the energy space start to get more bullish and indicate that we’re likely to see some higher prices.
Now, in addition to that predicted moving average, if you look at the very bottom of the chart, you’ll see this bar that goes from green to red, back to green. Well, this is utilizing that technology, looking at those intermarket relationships. But this is tuned to solve a different problem, and the problem here just being short-term strength or weakness over the next 48 hours. So not the overall trend, but very short-term—should we see that momentum and consistent strength or potentially a pullback and short-term consolidation in the market?
And now lastly, we look every week at our VantagePoint predicted highs and lows, and this is where things get really exciting. As again, that same technology is tuned to solve a different problem—this one being, “What is the daily range for the next trading day?”
And so, as we connect all of these pieces together, we get an overall forecast that helps traders very quickly identify new opportunities and really be ready for those opportunities before the next trading day.
And so, when we look at how accurate have all of those predicted high and low values been against the actual market data—so what’s going to happen is the market will trade and we’ll see, you know, what that candle looks like relative to those predictions. But you see that for several weeks we’ve been getting these valuable price clues that say, “Hey, look down towards this predicted low.” Another predicted low here, predicted low here—expect some short-term strength or some weakness after this trading day. And we see we have a little bit of a down day, scooting down to another predicted low.
But as this momentum picks up and the neural index gets bullish, look at these levels offered—allowing traders some excellent entries to participate in what really is a very bullish environment across the energy space.
So, look here at shares of Hess.
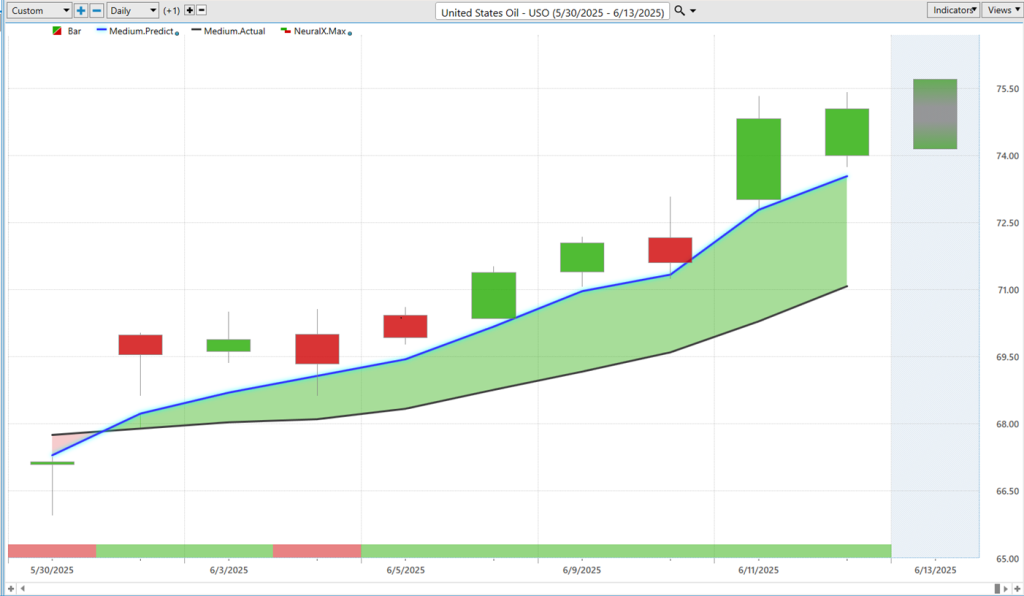
We can also look at U.S. Oil, which is going to model oil United States Oil (USO) prices themselves, right—crude oil prices here. And so you see here with U.S. Oil, well, what have we seen? Very similar picture: that blue line crossing above the black line, neural index very bullish really all this week.
I mean, if we look at this before, you know, we have some catalyst driving the market currently, but look at the separation here between that predicted moving average and the actual moving average and the consistent strength from the VantagePoint neural index saying, “Look, expect prices to move higher and continue higher.”
Again, we can look back at those predicted highs and lows, and we see this is actually last Tuesday here—the market dipping down midweek, and we got another situation earlier this week where the market moves down to the predicted low, and then we’ve really seen shares advance here across the energy space.
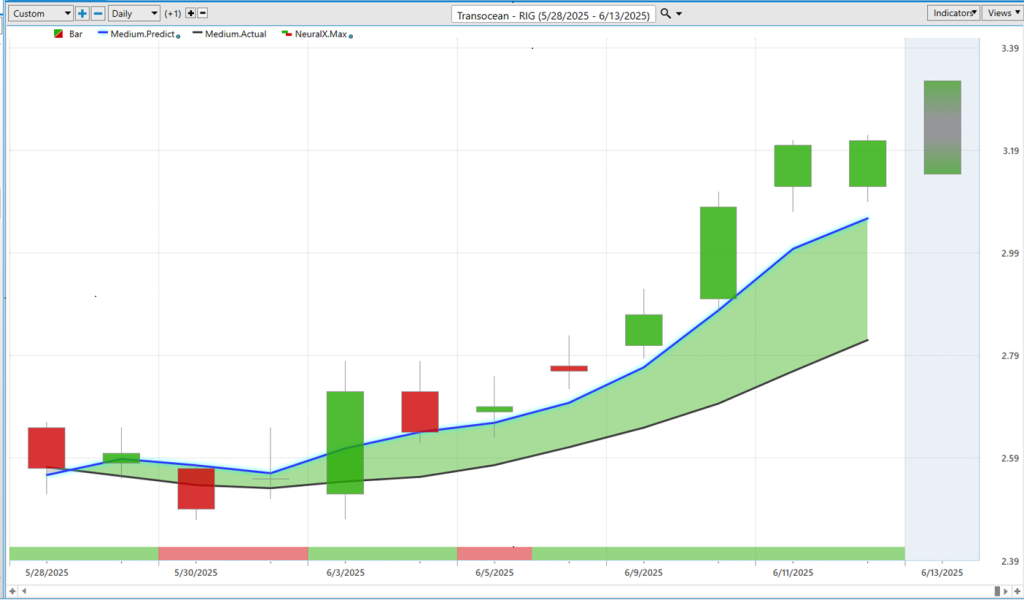
Now, if you like trading lower price stocks, here’s TransOcean, and I wanted to bring through Transocean (RIG), these subsequent examples really to highlight those predicted high and low levels. Because depending on your trading style—whether you’re short-term, long-term, whether you’re just managing a trade or adding to it—this is where these tools can be extremely effective.
And so, you see here with TransOcean, similarly, blue line crossing above the black line. Saw this really across the energy space. And you’ll notice here again that neural index goes bearish, and you get a couple days of consolidation. You actually gap down a little bit here, see some lower lows. But again, the overall trend is bullish—very clearly that blue line is above the black line.
And of course, we can look at how accurate those VantagePoint predicted highs and lows are. You see right before this trend gets started, “Hey, look down towards that predicted low on this gap-down day, look down towards that predicted low.” And even yesterday here, moving down towards the predicted low—and of course seeing the energy markets do extremely well here.
So really nice opportunities and entries in many of these energy markets and a very clear sort of new opportunity opening up here—a lot of these smaller stocks, especially with the catalyst. Here you see already a 25% move just in the last 11 trading days.
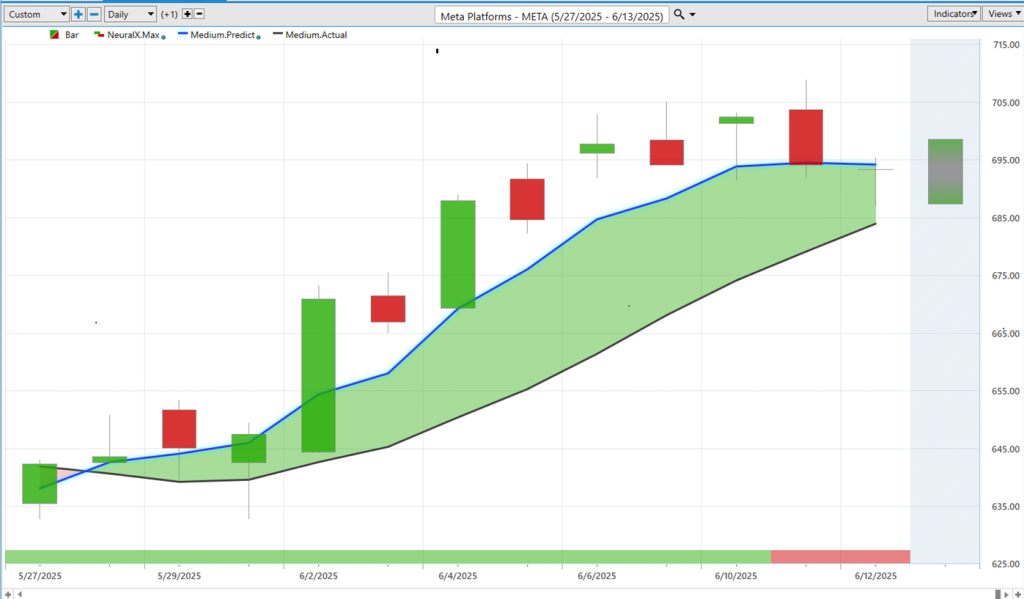
And so, let’s sort of pivot over to the traditional market, right? A lot of these tech stocks and names people are a lot more familiar with. Here was Meta—so Meta Platforms (META). This is what we took a look at over the past couple of weeks here.
And so again, you see this blue line crossing above the black line, indicating some fresh strength coming into the market. The neural index more recently, right, getting bearish. But look at all this separation between that predicted and actual moving average.
And when we look at the predicted highs and lows, you get a very clear roadmap of how you might want to manage a position here. It’s a really nice entry here early on. And look more recently at these predicted highs and lows and how things adapt.
When we’re in a strong uptrend, you see those predicted highs and lows aggressively moving higher. And when we’re running sideways, well, you see that from the predicted highs and lows, right? Moving up to these predicted highs, down to these predicted lows—but allowing traders to make those adjustments that potentially keep them in a position and really limit the amount of risk.
So again, Meta shares continuing to go higher here—about a 7%, almost 8% move in just the past 12 trading days.
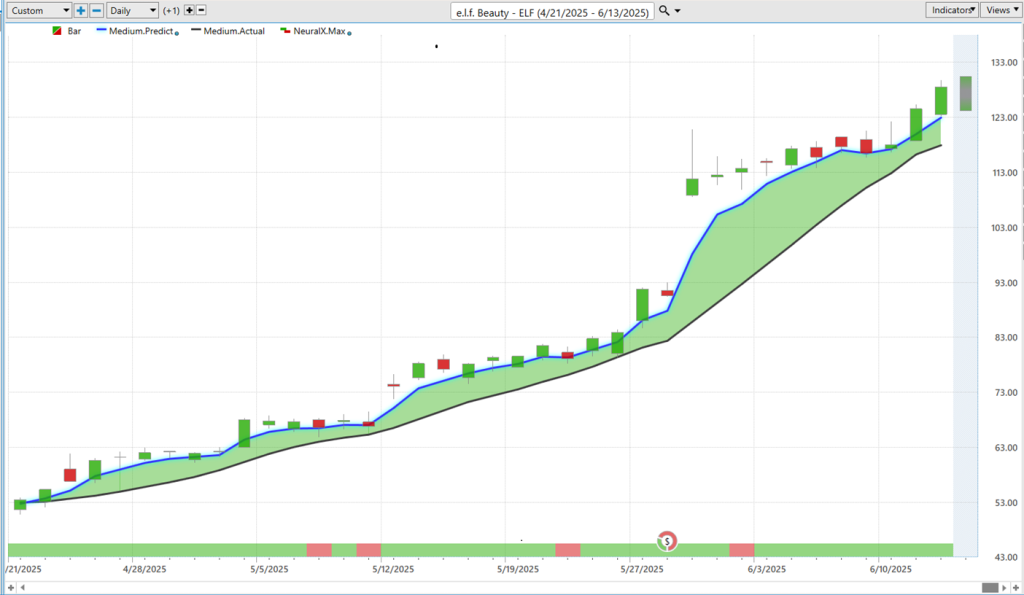
And another example here—e.l.f. Beauty (ELF). And so I brought this through a couple of weeks ago. But what I wanted to highlight is, sure, you know, when we get earnings and a catalyst to drive the market higher, that can work really to your advantage. But even after all that volatility comes through, and you have to say, “Okay, well, if we want to keep participating here, what’s going on? Should we take profits and get out of the way? Should we keep exploiting that opportunity?”
And we can look at the accuracy of those VantagePoint predicted highs and lows. And so what’s exciting about this is even with all this volatility and a huge price move, the software does an excellent job of adapting and saying, “Okay, where are things at? Where are those intermarkets? How are they affecting the future price of the stock? And how can we offer up some of these short-term levels that are going to give traders an edge in those timeframes that they’re trading?”
So even here since earnings, you had three entries down at those predicted lows, and the market almost immediately advancing from there. So even just the past week here, going back to last Friday—about a 10% more advance in the market just over four trading days. So really exciting stuff, and it really helps traders again identify those bigger themes in the market as VantagePoint scanning features really direct your attention to a particular area in the market.
And those intermarket—or the predictive indicators—generate very strong forecasts. And you see those indicators skewing more and more to the bullish or bearish side when these events start to pick up steam and volatility.
So we’ll go ahead and leave it there for today. Once again, this has been our Hot Stocks Outlook for June 13, 2025.
Hope you have a great rest of your trading week. Thanks again, and bye for now


