


Register for a Free Live Training
Hot Stocks Outlook uses VantagePoint’s market forecasts that are up to 87.4% accurate, demonstrating how traders can improve their timing and direction. In this week’s video, VantagePoint Software reviews forecasts for Cameco ($CCJ), 3M ($MMM), Oracle ($ORCL), Roblox ($RBLX), Western Digital (WDC)
Hot Stocks Outlook for June 20, 2025
Hello again, traders, and welcome back to the Hot Stocks Outlook for June 20th, 2025. I hope you all have had an excellent week out there in the financial markets. And as always, we’re here to take a look at the most recent VantagePoint A.I. predictive forecast.
So if you haven’t already, be sure to go ahead and click on the link down in the description below and get signed up for a live demonstration and learn all the specifics about how these predictive indicators and technologies are helping traders make much better trading decisions out in the marketplace.
Now, we’ll go ahead and jump right into the charts this week, and we can start out here with shares of Cameco ($CCJ). We’ve seen a lot of interest around, really, energies generally—but also nuclear power. A few weeks ago, we looked at Oklo stock. In this case, for shares of CCJ and CAMECO, this works the same for any forecast, right?
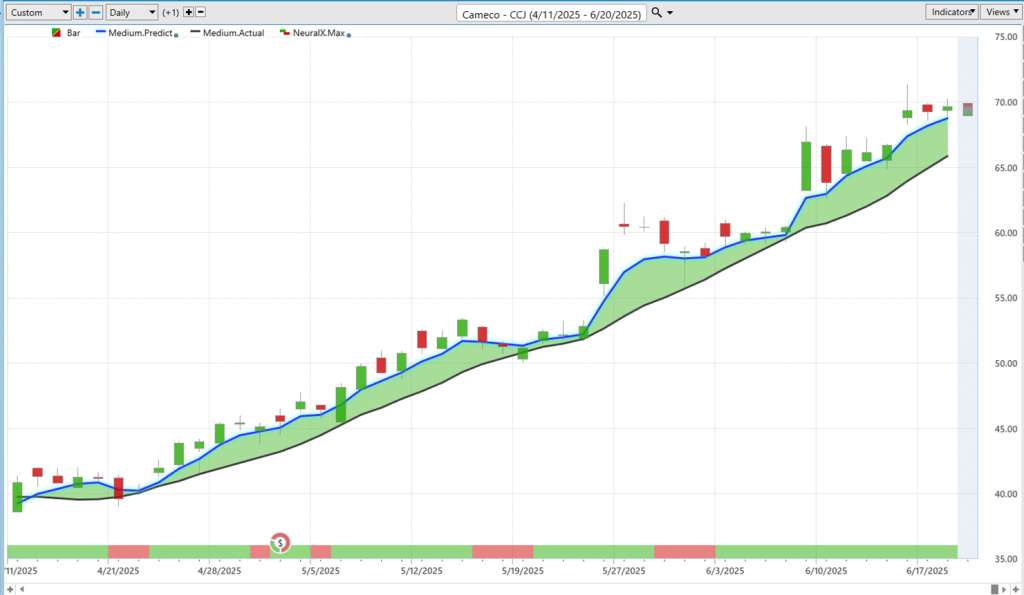
What we’re looking at here is daily bars and candles. So each one of these candles that you see on the chart is going to represent a full and complete trading day. And it’s right up against that price data that the first thing we’ll take a look at here from VantagePoint is this black line and blue line value.
So the black line that you’re seeing there—that is actually a simple moving average, or what we refer to as the actual simple moving average. And much like traditional technical analysis, this tool has no predictive capability. We really use this as our baseline to let us know where market prices have been. But all this does is take the previous 10 closed prices, adds them all together, and then divides by that number.
And the weakness with traditional technical analysis like this is that all the data comes from the past, so it has no predictive capability. It’s really just reconfiguring what’s already occurred and then plotting that on the chart.
Well, what VantagePoint traders are able to do is compare that value of where those market prices have been to this value—the proprietary predicted moving average. And for this value, or we can think of that as a price that gets calculated and plotted on the chart every evening—well, this is where the technology of artificial neural networks comes into play. And they’re being used to perform what we call intermarket analysis.
So what that means is that rather than just looking at the past price of a single market like technical analysis generally does, the software is able to understand how other markets are driving and influencing the future price of the target market—so in this case, Cameco.
And so this can be things like other individual stocks, this can be ETF groups, this can also be global commodities—whether it be gold, silver, oil, and broadly, energy prices—and even look at things like global currencies and interest rates. So it really takes this global approach, looking at dozens of other markets and essentially using that as a data set to generate predictions for the target market in question.
And so, whenever we see that blue line cross above the black line, it’s those neural networks—in this case—skewing to the bullish side and suggesting that that moving average is going to start moving higher. And this provides traders an early warning of when there’s going to be trend changes in the market.
We see here when shares of Cameco, as that blue line moves above the black line and remains above the black line, it’s suggesting that these average prices are going to start moving higher—and in this case, continuing higher. Over the past 46 trading days, you see about a 67% move in just the past couple of months. Here, 500 shares has you up about $14,000 on a move like that.
But that’s not the entirety of the predictive forecast. If we look at the very bottom of the chart, we see this bar that goes from green to red and back to green. Traders who might be trading different time frames or different styles and approaches may need to utilize different indicators.
In this case, this indicator is also utilizing that approach of intermarket analysis—looking at those dozens of markets that are interrelated and driving future prices. But this tool is tuned to solve a different problem. And so the problem that it’s solving is short-term strength or weakness over the next 48 hours.
We can really combine these two indicators to understand the overall trend direction and also when there’s likely to be short-term weakness over, again, just a short 48-hour period.
You’ll notice here that when we get that neural index going bearish, you tend to get the market not doing much the next trading day. Here, we just really quickly rise up—as you see, the neural index gets bullish very quickly again. But it does a good job of warning of these short-term retracements. But again, as long as that blue line remains above the black line, the overall trend is expected to move higher.
And so this indicator has a very high level of accuracy—upwards of 80+% across really all markets. So whether you’re looking at KCO here or an individual stock you might have more interest in, it’s going to have a very high level of accuracy of predicting whether those prices will be higher or lower over that next 48-hour period.
Lastly, as we do each week, we actually take a look at these intraday levels. So in the same way that we have these neural networks figuring out the overall trend—the short-term strength or weakness—you’re also provided a predicted high and a predicted low, essentially a predicted range for the next trading day.
What will occur is the actual market data will populate once we get the close of today’s trading, and we can actually see how accurate all of these predictions are against the market data. When we look back at all of these VantagePoint predictions, we see that traders can identify that, “Okay, well, if I want to get long the market, I can utilize these levels to potentially set limit orders and get involved in a trading opportunity.”
You see how over the course of this market of, you know, a couple of months here—it’s not going to hit those predicted lows every day. But what it does a great job of is taking in the new data for the next trading day, understanding those intermarket relationships, and then projecting forward where things are likely to move. So it does a great job adjusting to market conditions.
You see here getting some volatility around this pop in the market—but very quickly, those predicted lows—almost perfect here—moving down to the predicted low and moving higher. This just being really at Friday of last week here. And so this is really the tool set that allows traders to execute their trading strategies and identify some really nice trading opportunities here.
So again, a really nice move—about a 70% rally here in just over 45 trading days. Now, markets aren’t always moving higher. And this is what’s very important to understand: whenever we see that blue line or predicted moving average get below the actual moving average, well, that’s where we’re likely to move into a downtrend.
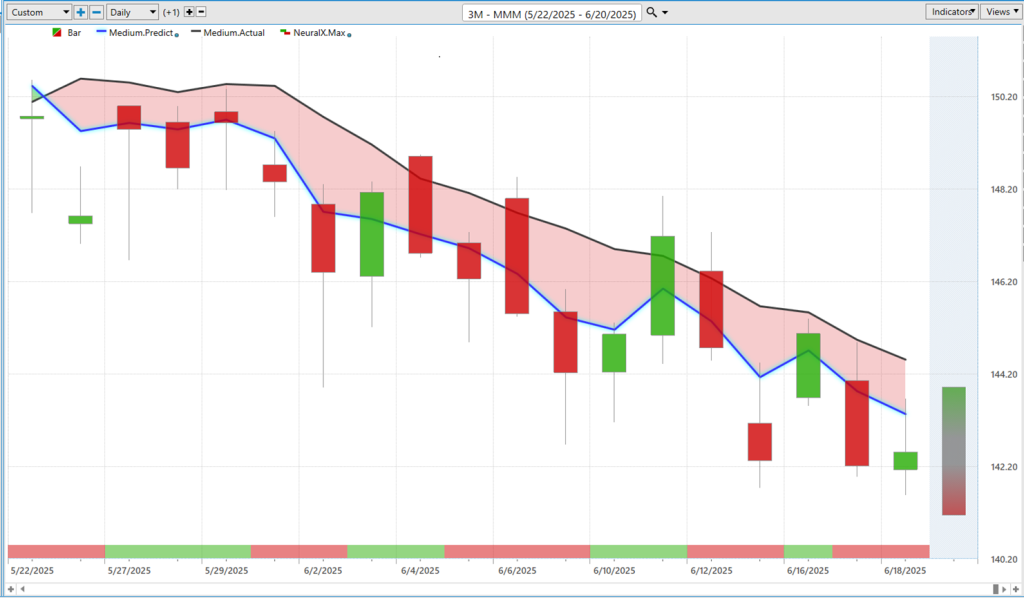
You see we have a very sort of jumpy market here in shares of 3M. The neural index, you see, going bullish here, back to bullish, back to bullish—but the overall trend here, very bearish. And when you have that really intraday tool of the predicted highs and lows, this is what makes traders aware of when to take profit, when that trend is shifted—maybe a really great time to get out of the market if you’re on the bullish side here.
But conversely, also where you might want to hedge or go short the market—if that’s your style and approach to trading. You see a few entries on the bearish side here and the downtrend remaining in what has been a fairly strong market.
So when you want to identify, “Well, where are those markets where there’s a lot of strength? What sectors are showing a lot of strength?” Well, you know—energies, nuclear power, and also the tech space has been pretty strong here.
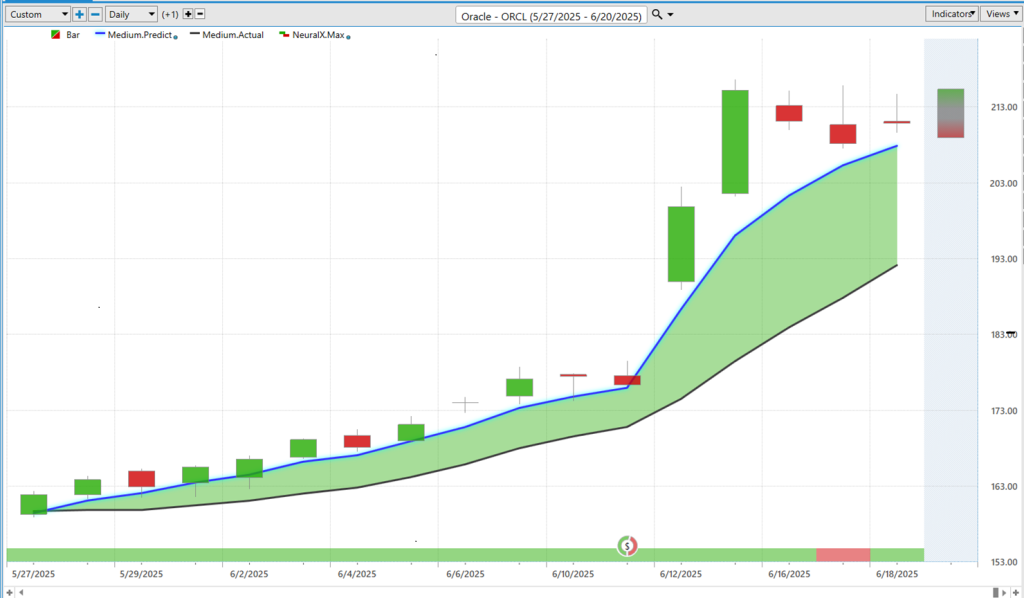
So as we pivot over to shares of Oracle, another good example of how all this works together. And so, Oracle had a really nice move after earnings here—really catapulted the stock. But look at the forecast leading into earnings.
You notice this neural index—this 48-hour indicator—bullish really for the last, let’s take a look at how many days this move has lasted here… but we’ve gotten, you know, 17 trading days, right? And 16 of those 17 trading days have forecasted this market to continue higher and be in an uptrend. And we see the market just grinds higher, grinds higher, grinds higher until recently—we see this neural index goes bearish, and we got kind of a nothing day that followed the next trading day.
And again, we can look at those predicted highs and lows. And so when traders identify that, “Hey, this is a market of interest, maybe I want to go ahead and take a position here on Oracle,” you see how effective these predicted lows are. So even if you’re a day trader and just want to be involved for really the trading day—or maybe a few hours in the market open in the early morning—you can get that good entry, see how the market progresses forward, and potentially add to that position as the market progresses forward.
Again, we see this example where you get that catalyst of earnings—a lot of volatility—but notice how the predicted highs and lows adjust every single day and say, “Okay, well, if you want to get involved now, look down towards these predicted lows. We’ll probably see intraday selling up at these predicted highs.”
It’s really this collection of tools—this suite of indicators—that round out the forecast and allow traders to have an edge with their trading strategies in the marketplace.
So again, really nice move here—about a 30% rally here in just the past 16 trading days.
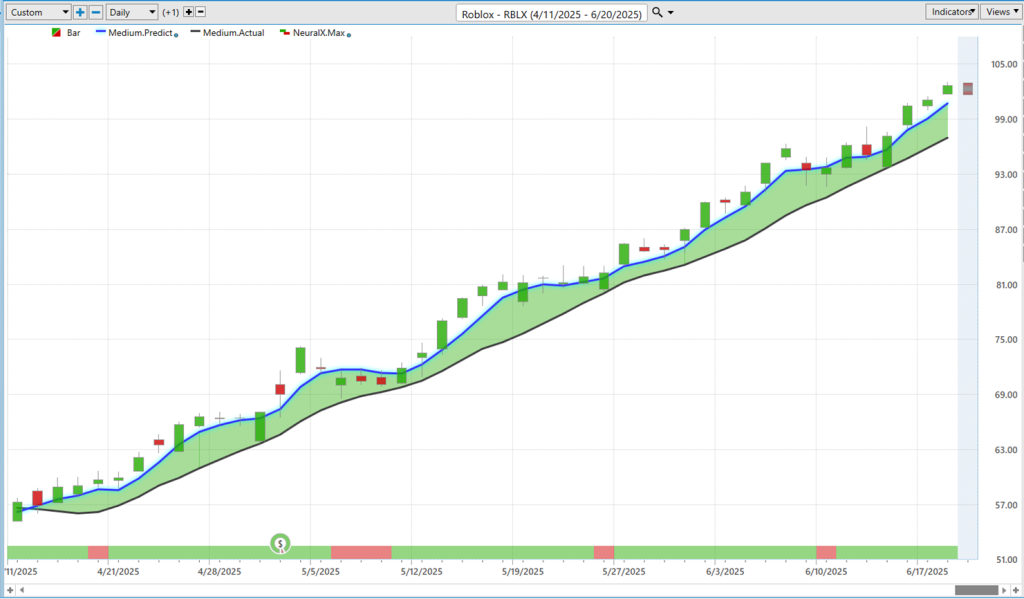
Next, we have Roblox, another market that’s been in a really strong uptrend. Again, we see this blue line crossing above the black line. You get a couple of periods where the neural index goes bearish, followed by some subsequent sort of sideways price action—but very clearly, the predicted moving average is saying this market is in an uptrend. You’d want to be buying, taking profits on those long positions.
Again, we can say, “Well, how have these predicted high and low levels performed while you’re identifying that uptrend?” We see we get this nice move here. Market gaps down, immediately starts trading higher again—moving down to a predicted low here, another gap down, another gap down. So pretty quickly, the market—very quickly—moving higher once those predicted low levels are hit, and the uptrend resumes here.
So again, we see last Friday moving down to this predicted low, and really benefiting this week as we see some continued strength in shares of Roblox. So really nice opportunity there—another tech stock that’s performed really well. About a 77% rally here at about 46 trading days.

Lastly, we’ll end here on Western Digital. So in the storage and computing space here, in Western Digital, we see a very similar forecast. Blue line very clearly above the black line. Again, you’ll get these little blips where the neural index is bearish—but notice how we don’t even get close to that blue line crossing below the black line.
So very clearly, what you’d want to be doing is buy the market, take profits on longs, potentially add to existing positions, and trail your stops. You see here plenty of levels here early on as that trend gets started.
But again, as things adjust—so you get earnings, a big move in the stock—but these predicted low levels acting as a really nice guide for traders to make those trading decisions and potentially get involved in the market. You see just about every day sliding to those predicted lows and the market closing in between the range before that trend continues and momentum picks back up to the upside.
Really nice move here in Western Digital. Also shares of Seagate—we see a lot of similar conditions across similar stocks. And this is where tools like the IntelliScan are extremely helpful.
So when we’re trying to identify—like last week—some of that strength coming into energies, well, there are features and tools here that really identify fresh crossovers right as they’re occurring. And we can really formulate this to find any type of trade that we’re looking for based on those predictive suite of indicators that match our time frame and trading style.
We’ll go ahead and leave it there for today. Once again, this has been our Hot Stocks Outlook for June 20th, 2025. Thank you all for watching—best of luck out there, and bye for now.


