Register for a Free Live Training
Hot Stocks Outlook uses VantagePoint’s market forecasts that are up to 87.4% accurate, demonstrating how traders can improve their timing and direction. In this week’s video, VantagePoint Software reviews forecasts for Crispr Therapeutics ($CRSP), RocketLab ($RKLB), McDonald’s ($MCD), ZScaler ($ZS), Goldman Sachs(GS)
VantagePoint A.I. Hot Stocks Outlook for June 27, 2025
Hello again, traders, and welcome back to the Hot Stocks Outlook for June 27th, 2025. I hope you all have had a nice week out there in the financial markets, and as always, we’re here to take a look at the most recent VantagePoint A.I. predictive forecast. So if you haven’t already, go ahead and click on the link down in the description below and get signed up for a live demonstration—and you can learn all the specifics about how these predictive indicators and technologies are helping traders make much better trading decisions out in the marketplace.
Uh, and so we’ll go ahead and start out this week with shares of CRISPR Therapeutics. Uh, and a lot of CRISPR Therapeutics (CRSP) tech stocks and stocks throughout the NASDAQ are performing extremely well here. This really highlights how all of these tools work together—uh, really regardless if you’re swing trading, position, or even doing some day trading.
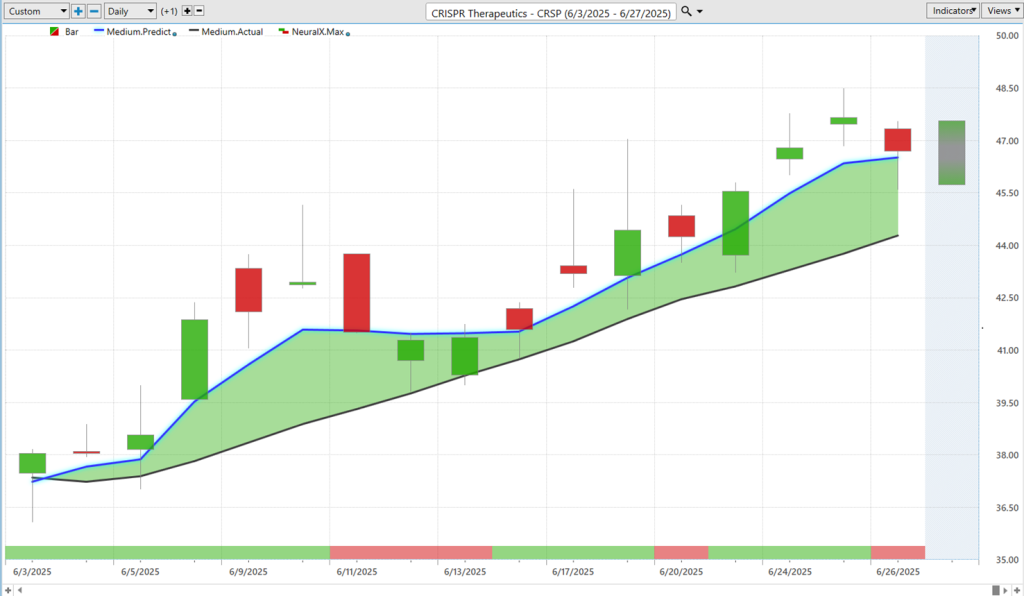
And so, uh, what we have here with CRISPR is daily bars and candles. So each one of the candles that you see there will represent a full and complete trading day. And it’s right up against that price data. The first thing that’ll jump out at you is that there is a black line and also a blue line value.
And so, the black line value that you’re seeing there is a simple moving average—or what we would call the actual simple moving average. And this is a very common technical analysis indicator, and what it does here is just look back at the previous 10 close prices. So it’ll add those previous close prices together and then divide by that number. And so that acts as a baseline to let VantagePoint traders know where the market has been.
But obviously, traders need to be ahead of that next move in the market. And so what VantagePoint traders are able to do is compare that simple moving average, or lagging moving average, to the VantagePoint proprietary predicted moving average. And for this price to get calculated and plotted on the chart every evening—well, this is where that technology of artificial neural networks comes into play. And they’re performing what we would call intermarket analysis.
And so what that means is that rather than just looking at past prices like traditional technical analysis, there’s going to be dozens of markets that are known to drive and influence the future price of this asset. And so what the technology is doing is understanding those individual stock relationships. They can be relationships within ETF groups that round up a large portion of the marketplace. Uh, but it can also be major micro markets like the value of the dollar index or interest rates, or even down to specific commodities like gold or silver or wheat, where it’s applicable for that particular market.
And so it uses about, you know, two or three dozen markets to then generate highly accurate predictions of where these prices are headed next—and incorporates that into these predictive indicators. So whenever we see this blue line or predicted moving average cross above the actual moving average, well, it’s suggesting that these prices are going to start going higher, and traders can look to take a position.
So in this case, we see our predicted moving average getting above the actual moving average and signaling this market is moving into an uptrend. Now, that’s very helpful for traders to identify these important trend shifts in the market, but there’s other types of trading and other types of problems that traders may need to solve.
So, uh, if you look at the very bottom of the chart, you’ll see this bar that goes from green to red and back to green. Well, this technology here is also utilizing those predictive neural networks, but they’re tuned to solve a different problem here. And this is solving the problem of really short-term strength or weakness in the market. And so it’s looking ahead every single—uh, uh—forecast here, 48 hours in advance, and again predicting whether there’s that short-term strength or weakness in the marketplace.
And so you’ll notice that once that overall trend direction is identified—and we see we got about a 23, almost 24% rally here in the past 16 trading days—there may be these periods where the neural index flips down to a red configuration and warns of, again, that temporary short-term weakness. But as long as that predicted moving average maintains above the actual moving average, well, the overall trend is still bullish. Uh, and traders might want to look to maintain that long position or keep exploiting further long positions.
Additionally, we’re also getting a predicted high and a predicted low. So we can sort of imagine here the problems that are getting solved between the overall trend direction with that predicted moving average, the short-term strength or weakness from the neural index, and then we also have a predicted high and predicted low value. So now we’re down to really intraday values that traders can use to set limit orders for day trades or potentially add to an existing swing or position trade.
Uh, and so again, once we see all those, uh, you know, indicators get to the bullish side, you may want to use some of these tools to manage the opportunity. Uh, but as we look at how accurate all these VantagePoint predicted highs and lows are, this is really what’s giving traders a huge advantage in the market.
So even here before we got this move lower, you have this VantagePoint predicted high and low actually slanting lower and saying, “Hey, look for the range to start moving down towards these predicted levels.” And then, of course, you can use these values to trade the market as that momentum kicks back into the marketplace.
Uh, and so, really nice opportunity here in CRISPR. And again, we’ve seen a lot of tech stocks doing pretty well here. So again, about a 23% rally over the past 16 trading days.
Uh, and so there’s features within VantagePoint as well that help us identify new opportunities—so actually help us identify where these crossovers are occurring on really day one, where we see that blue line cross above the black line.
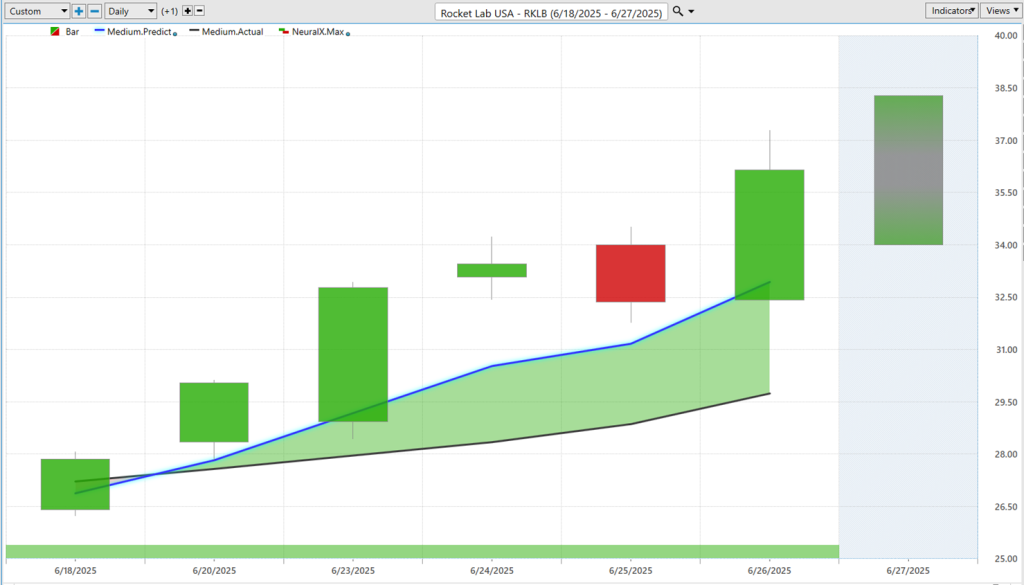
So recently this week, shares of Rocket Lab USA (RKLB), Rocket Lab—we started to see this predicted moving average move above the actual moving average. You’ll notice here the persistence of strength from the neural index pretty much every day, saying, “Look, expect this market to go higher.”
And as a trader, you can then use these VantagePoint predicted highs and lows to determine, “Okay, well, where might I want to go ahead and set limit orders and get involved in the market?” Uh, and you can see this works pretty similarly, where you move down towards these predicted lows and really see the market advance from there—uh, really within, you know, the next trading day, right? So it uses the day to move down towards those predicted levels but almost immediately starts to move higher, and the trend continuing to the upside here.
So we’ll see how this market performs over the next few weeks. Uh, we’ve seen about a 26% rally here just in the past five trading days. And so whether you’re looking for bullish opportunities or potentially just markets to avoid, right, so you don’t want your attention going to areas where the market is in a downtrend or likely to suffer decline—
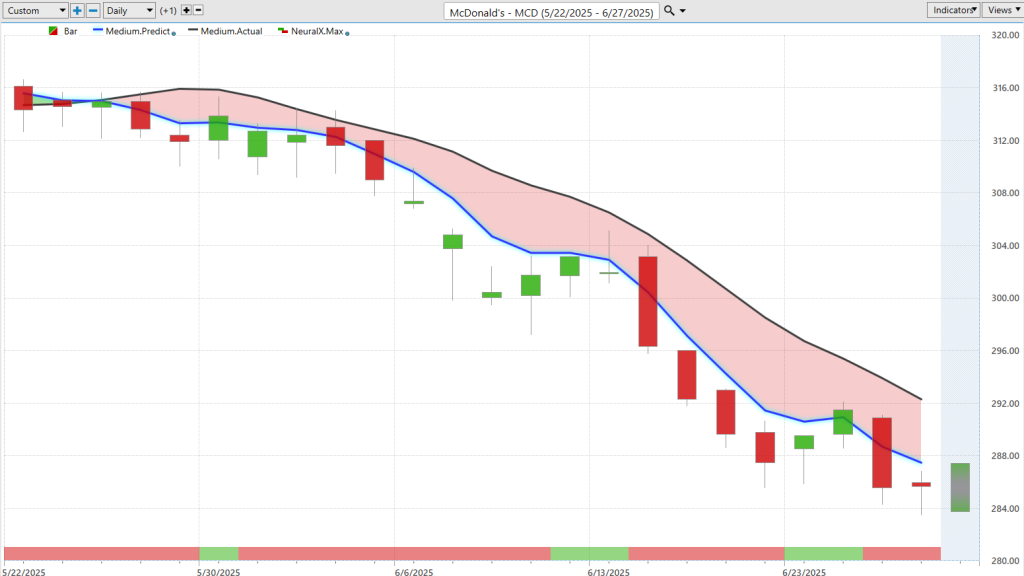
Here you see shares of McDonald’s (MCD), obviously a very popular stock, but we see that predicted moving average crossing below the actual moving average all the way back here in May. Uh, and that has persisted now for several weeks here. Uh, we see the neural index getting bullish. You get a couple of sideways sort of consolidation—uh, uh—periods in the market, but overall, a lot of distance between that predicted moving average and the actual moving average.
And so, as we take a look at the overall move here, we can see shares are now down roughly about 9%, almost 10% here in just the past 22 trading days. And of course, we can again look at how accurate those predicted highs and lows are—so very clearly saying, “Look, you do not want to be long this market when it’s going into a fresh downtrend,” and trading up towards these predicted highs. And you see how the market just persistently moves up to those levels and then continues that expected trend direction.
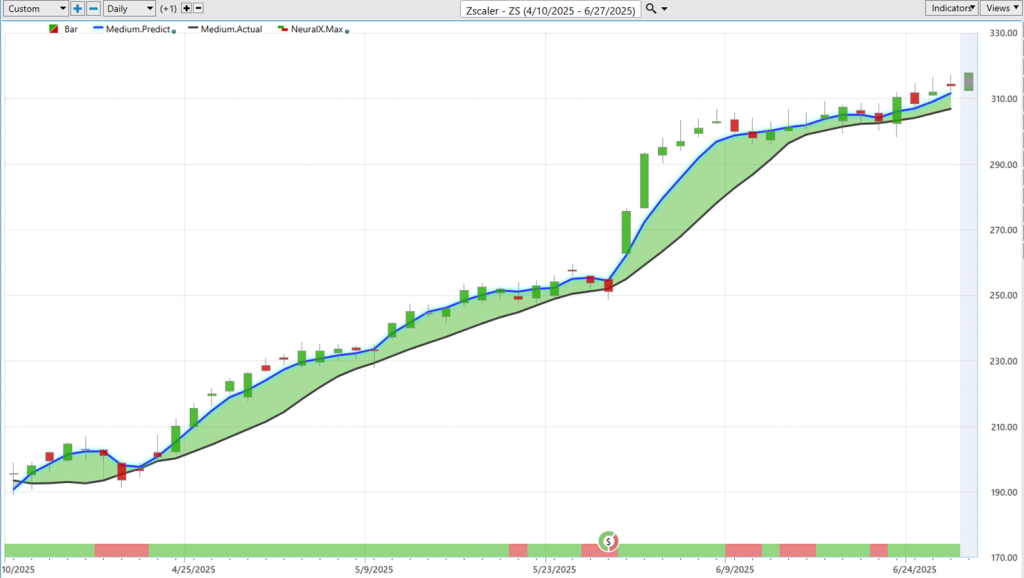
So we’ll move on to the next opportunity: Zscaler (ZS), another tech stock. Very similarly, some of these markets can really continue to move. This is why you want to pay close attention to that blue line maintaining that separation between the—uh, uh—predicted moving average and the actual moving average.
And so we see here, as we get that crossover to the upside, we can take a look at all of these predictions against the actual market data. Uh, and so you see here, we get a little bit of a day move lower, then immediately continuing on that uptrend. You see how many days this market moves down towards the predicted low and then continues on its uptrend. So this is where day traders can utilize these levels, really be ahead of the market, and really get exceptional price entries into the marketplace.
Um, you see here, this is actually interesting, where you get a day where you gap up completely out of the range. But what does it need to do? It comes right back down to that previous predicted low and then continues on around earnings there. And even after that volatility around earnings, the software just does a good job of adjusting. So every single day, you have these levels telling you, “Hey, where’s the range expected to be?” We’ll actually get the real market data, we’ll fill in that range, and we’ll see how accurate that is.
But you see previously—I mean, really dozens of entries on this uptrend—as the market is forecasted to maintain this bullish trend here. So really nice opportunity in shares of Zscaler. This is really going back to, um, you know, really that rally higher we saw in April that’s really persisted across the broader stock market, and the Q’s and the SPY, and the broader markets doing extremely well—about a 60% rally here in just 52 trading days.
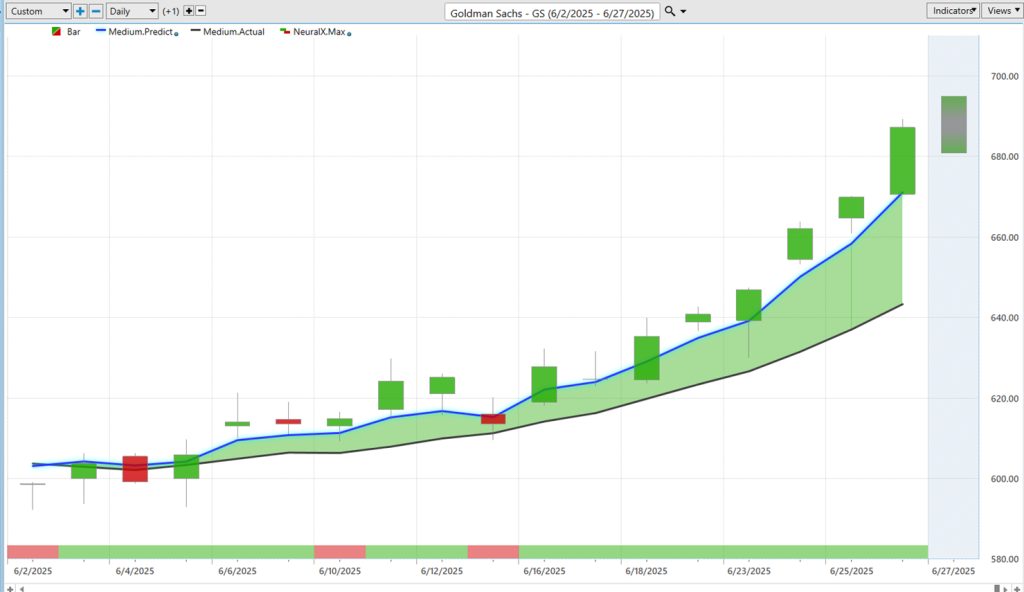
Lastly here, Goldman Sachs (GS), more traditional stock. Goldman Sachs. So, you know, whether you want to trade those more volatile tech stocks, or you want to stick to some of these sort of blue-chip names here in the financial space, here we see blue line crossing above the black line. Uh, you get a couple days here where that neural index is bearish, but notice how quickly you’re getting that bullish momentum coming back into the market.
And then more recently this week, really getting an expansion of the range and a really strong move higher. Of course, we’ll look at those predicted highs and lows, and you see how accurate this is. So what you have to remember here is, you know, all of these days are similar to this day before we actually get the market data filling in. So as you move into this uptrend and say, “Okay, well, where are these levels where I should be scouting out positions?” Well, down at these VantagePointed lows.
And you see, what do we have here? About one, two, three, four, five—about six entries or so. Uh, this coming through actually Monday of this week, right? Moving down to 640, now the market pushing up against $700 per share.
Uh, overall, we can see this move has been about a 13, almost 14% rally here in the past 17 trading days. So really exciting opportunities, but of course, you want those tools that help you adjust and adapt to the overall market environment—really identify these strong uptrends and avoid some of these markets like McDonald’s that are in a downtrend. You can just sort of ignore that, get out of the way, and focus on some of these markets that are in these strong predictive uptrends.
So we’ll go ahead and leave it there for today. Once again, this has been the Hot Stocks Outlook for June 27th, 2025. Thank you all for watching, best of luck, and bye for now.