


Register for a Free Live Training
Hot Stocks Outlook uses VantagePoint’s market forecasts that are up to 87.4% accurate, demonstrating how traders can improve their timing and direction. In this week’s video, VantagePoint Software reviews forecasts for SPDR SPY($SPY), Meta Platforms ($META), Roblox ($RBLX), Fortuna Silver Mines ($FSM), Boston Scientific ($BSX), Chewy (CHWY)
VantagePoint A.I. Hot Stocks Outlook for June 6, 2025
Hello again, traders, and welcome back to the Hot Stocks Outlook for June 6, 2025. I hope you all have had a nice week out there in the financial markets, and as always, we’re here to take a look at the most recent VantagePoint A.I. predicted forecast. So if you haven’t already, go ahead and click on the link down in the description below, and you can get signed up for a live demonstration and learn all the specifics about how these predictive indicators and technologies are helping traders make better trading decisions out in the marketplace.
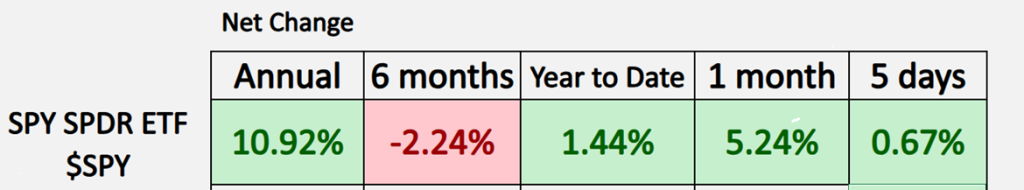
Now, each week we typically start out by taking a look at the SPY, just to get a sense of the broader markets and where we’ve been over these given chunks of time here. And we can see, year-to-date, we’ve actually had a nice week—popped up over 1% now—and so we’ve seen a lot of markets do extremely well over the past really couple of months here, right? It’s a lot of noise around tariffs, but we’ve seen a really strong push to the bullish side. And so this is where VantagePoint traders can utilize these tools to really make the best of these trading situations.
There’s a really nice situation here in Meta, Meta Platforms (META), and we can look at the most recent forecast here and really highlight how all of these tools work together to provide traders with that roadmap on how they might want to trade and participate in the market.
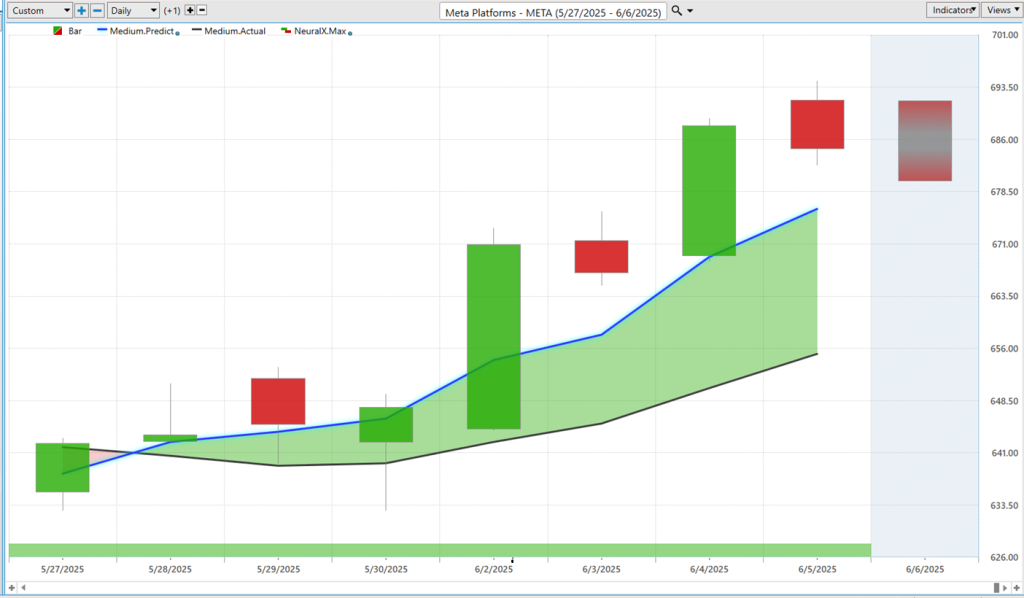
What we’re seeing here with shares of Meta’s daily price action—right, so each one of these candles that you see, well, that’s going to represent a full and complete trading day. And the first thing that’s going to jump out at you is that there is a black line and also a blue line right up against those daily candles. What that black line value is, is actually a simple moving average. And this is what we actually use as our baseline here. In this case, it’s a 10-period simple moving average, so it looks at the previous 10 closes, adds all those values together, and then divides by 10.
One of the weaknesses with traditional technical analysis like this is that all that data comes from the past—so it really just reconfigures what’s already occurred in the market and has no predictive capability. And so what VantagePoint traders are able to do is compare that value of where market prices have been, sort of smoothing out that price action, to this proprietary predicted moving average. For this number—which we can think of as a future price—that’s going to get calculated and plotted on the chart, well, for that number to get generated, that’s where the technology of artificial neural networks comes into play. They’re performing what we would call intermarket analysis.
This is very important because markets are not just trading in isolation like they’re in their own little vacuums. Markets are affected and driven by other markets. When we take all of that market data from literally dozens of other markets that are known to drive, in this case, the market in question, we can use that data to actually generate highly accurate predictions on where price is headed next. This can be things like other individual stocks, which could share some leading or lagging relationships or positive or inverse correlations. It can get into ETF groups—like, you know, the technology ETFs. It also is able to look at things like currencies and even global interest rates—and even things like gold and silver and commodities where applicable to that, again, market in question where we’re trying to make those predictions.
Once it’s able to analyze all that data, it utilizes and incorporates that into our proprietary predicted moving average. So whenever traders see that blue line—in this case—cross above the black line, well, it’s suggesting that average prices are going to start moving higher. Traders may want to look to take a long position. We can see here, pretty much from close to close, we’re up about 6% in the last seven trading days. Sort of a clue here that says, “Okay, well, how are the broader markets doing? How are some of these big stocks performing?” Well, you see here Meta very clearly saying, “Hey, we’re in an uptrend. Let’s go ahead and look towards the bullish side in this case.”
Now, that’s not the only indicator driven by these artificial neural networks. We also have the VantagePoint predicted Neural Index, which you see at the bottom of the chart here. This green bar here can go from green—it can flip to red—but it’s updated every single day. What it’s doing is it’s predicting short-term strength or weakness over the next 48 hours. So this is really tuned to solve a different problem, that being short-term strength or weakness in the market. We see here that really, for the past seven or eight days, it’s just been saying, “Look, expect the market to keep moving higher over those subsequent 48-hour periods.”
Lastly, we’re even provided a predicted high and a predicted low. So now we’re down to solving intraday problems of where we expect the daily range to trade. What we can do is actually look back—we do this each week—looking back on how accurate all of those predictions were relative to the actual trading day. You see here we have a shadow candle here—well, that’s going to get filled in with the actual market data. We’ll see how the market performs here. We can see very clearly in a strong uptrend. But let’s go ahead and take a look back at those predicted highs and lows, and we see how this works. Once you’ve identified that the trend is bullish, well, then you might want to look down towards these VantagePoint predicted lows to accumulate a position or maybe have a limit order waiting to get involved in the market. You see how well that works—it takes a couple of days, but these levels weren’t hit until, sure enough, we get that dip lower and then the market really explodes to the upside. So really nice opportunity, and shares of Meta really just getting started here—about a 6% rally over the past week.
But let’s take that information and say, “Okay, well, how can we interpret some of these other markets and other forecasts generated via the technology?”
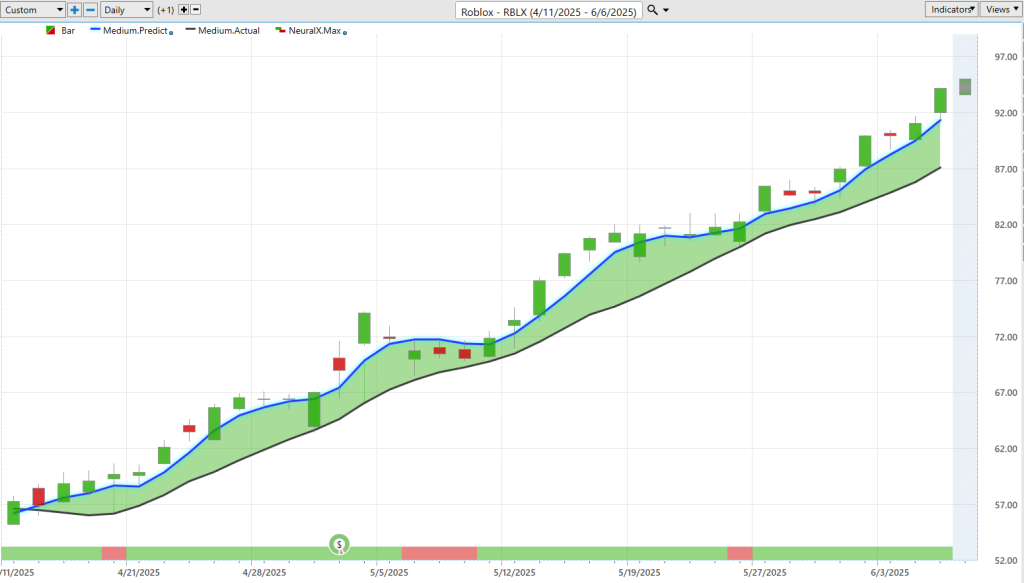
Roblox (RBLX)—here’s shares of Roblox, and we can see that going all the way back to when markets started to move higher after we got the tariff announcements, we started to see markets really perform well. Well, here in Roblox, we see we got that blue line crossing above the black line all the way back here in the middle of April. You’ll notice that every once in a while, you get this Neural Index going down to a red—but remember, that’s just a very short-term forecast looking ahead at subsequent 48-hour periods. You’ll notice that the market often sort of mellows out for a little bit before it continues on its trend. But as long as that blue line remains above the black line, traders would want to stay bullish here.
Again, we can look back at those previous predicted highs and lows and say, “Okay, well, over the past now almost two months, where has VantagePoint been indicating to get involved in the market?” You see, on a trading day like this, if you had an order, you’d actually get filled at the open there—market starts immediately trading higher. We have another pullback here, here, here. So you’re not going to hit those levels every single day, but they certainly offer a good sort of weekly location of where you might want to look for price levels if you want to add to a position or initially get involved in an opportunity. Here we see about five or six opportunities as this market trends higher. And of course, we can say, “Okay, well, is that blue line still above the black line?” Right—so this has been an area where you’ve had that persistent strength. We haven’t gotten that crossover to the downside indicating weakness. And this has led to about a 65% rally in just 37 trading days.
This is where it’s really important to use these indicators and tools to guide you. Again, if that blue line crosses below the black line, well, then you may want to take some profits and get out of the way.
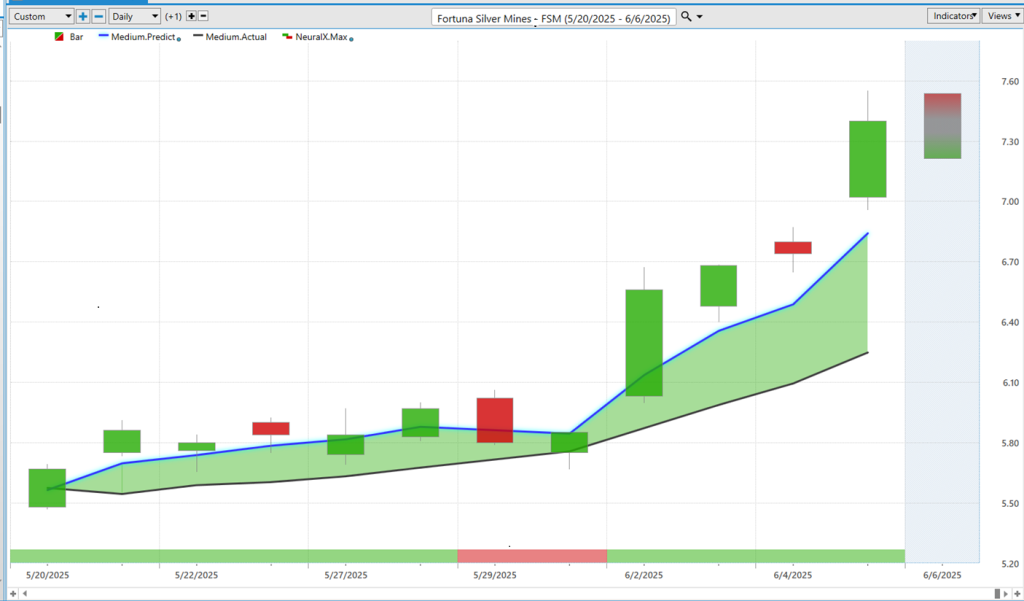
Here’s Fortuna Silver Mines (FSM)—over to the commodity space. Some of these stocks are going to be driven by the values of silver, copper, gold, some precious metals, a lot of mining and basic material stocks. Well, here we see, similarly, blue line crossing above the black line indicating that, “Okay, we expect those average prices to move higher.” We get that little blip with the Neural Index where you get a little bit of a gap down and subdued price action, but again, the overall trend is still bullish. We see, as we get this explosion in silver over the past week, well, that drives a lot of these basic material stocks—seeing about a 29% rally now in just the past 11 trading days. So really exciting stuff there.
Over the last couple of weeks, what we’ve highlighted is that there have been some markets that have turned lower. And so you’ve seen sort of the equity indices sort of run sideways for the past few weeks. That’s why it’s important to recognize, “Hey, where is that strength in the market? Where are the trends still to the upside?” Focus your capital and trading attention in those spots.
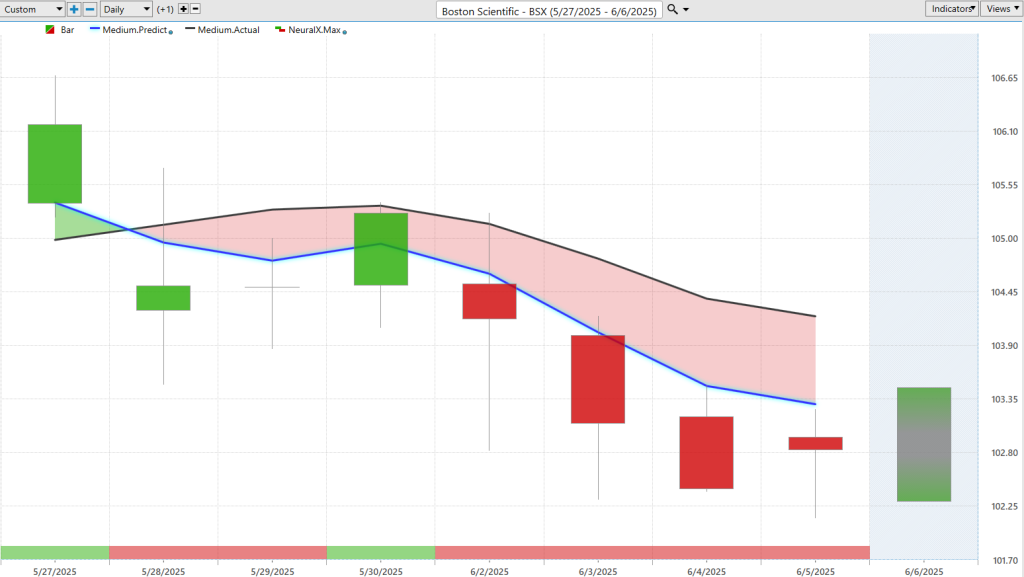
Here we see with Boston Scientific (BSX), a couple of weeks ago getting that blue line crossing below the black line. We saw a similar thing in a lot of financial stocks—makes that a lot less appealing area of the market to focus in on. But very clearly here, you see that blue line below the black line, Neural Index bearish here, and we get that continued move lower.
Of course, we can look at those predicted highs and lows. When you have that recent crossover to the downside, when we get up to these predicted levels, you understand, “Hey, that’s actually a good area to short and look to take profit on those short positions.” We’ve seen, again, shares pull back a little bit—so very important to really identify, “Hey, where is that weakness?” Let’s just go ahead and avoid some of those markets—potentially hedge if you do want to get on the short side of something. But clearly indicating, “Look, this is not the place to be this week.” Clearly in a downtrend—maybe look toward things like Meta and some of these other tech stocks.
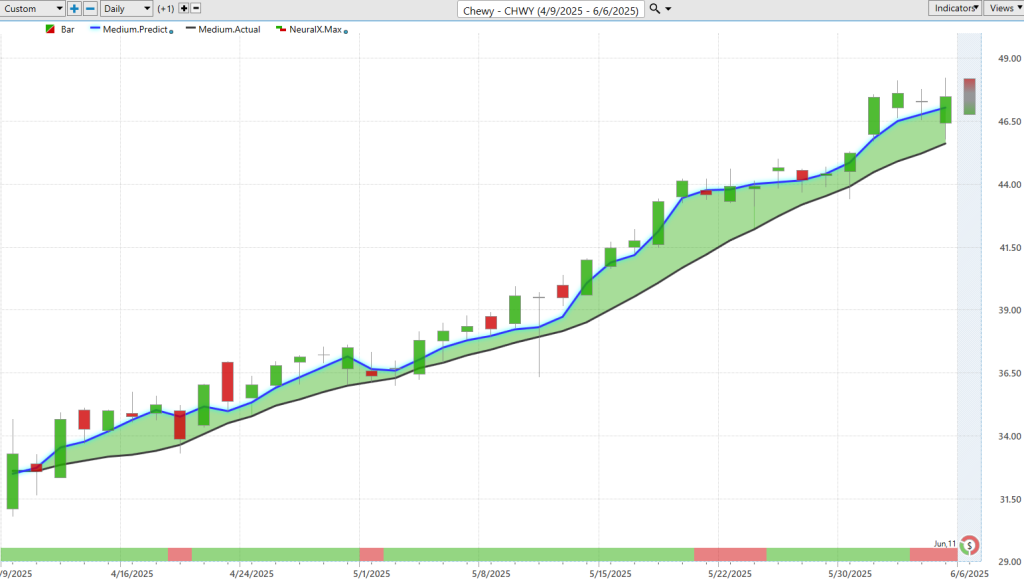
Lastly, here’s Chewy (CHWY), which we looked at a couple of weeks ago. We can go ahead and update that forecast as far as those short-term predictive indicators are concerned. We see this is very much like Roblox—seeing that strength coming in April, and you really want to identify, “Hey, where is that strength persisting?” Well, maybe that might be a good area to focus in some attention.
We see overall the move here now pushing up against 44% over the last 39 trading days. But what I wanted to highlight here is just the predicted highs and lows. Over the past couple of weeks, where we highlight, “Hey, this market’s in an uptrend,” how have those very short-term predicted levels performed?
You see how this works—here we get the market moving sideways, some levels here identifying, “Look down towards these VantagePoint predicted lows,” so that as this week we come in and get this nice boost in prices again, you can benefit off of that. Additionally, shorter-term traders here, just over the past week—well, just over the past really couple days here—looking down towards these predicted lows and expecting the market to move higher. We actually moved up toward this predicted high just yesterday—about a 2 or 3% move there just over the daily price action.
So, we’ll go ahead and leave it there for today. Once again, this has been our Hot Stocks Outlook for June 6, 2025. Thank you all for watching. Best of luck, and bye for now.


