


Hot Stocks Outlook for the Week of
March 27, 2020
The Hot Stocks Outlook uses VantagePoint’s market forecasts that are up to 87.4% accurate, demonstrating how traders can improve their timing and direction. In this week’s video, VantagePoint Software reviews forecasts for General Dynamics (GD), Childrens Place (PLCE), Axxon Enterprises (AAXN), iAnthus Capital Holdings (ITHUF), and Amazon (AMZN)
Register for a Free Live Training
This Week’s Hot Stocks Outlook
Hello again traders and welcome back to the Hot Stocks Outlook for March 27, 2020. Hope you all are having a excellent week out in the financial markets and as always, plenty to cover in this week’s outlook. So I know the past several weeks we’ve really taken a look at really very similar markets week after week because we identified shoes and oil companies where there’s excessive weakness. Obviously the S&P 500 taking everything much, much lower. But now we’re going to go out and bring in a nice mix of things, right? So we’ve got General Dynamics here, the Children’s Place Retail, Axon Enterprises, iAnthus Capital Holdings for Financials and lastly Amazon, which certainly everyone’s familiar with.
General Dynamics (GD)
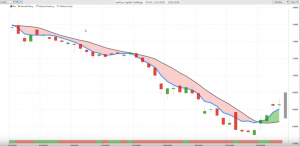
But starting here with General Dynamics and this very emblematic of the broader move that we saw in the S&P 500 as far as February 20th, things really starting to slide and move lower. And you see not only seeing this crossover on General Dynamics, but the Intelli-Scan feature that we have really helps us identify when large swathes of the market are starting to make a turn. And so it became very clear that going into February 20th, the market was turning lower and you wanted to go ahead and stake out some short positions there. So we see this blue line crossing below this black value that you see against the chart. And so what I want to do is explain each one of these indicators and how you can use them, again, to manage the marketplace here.
So right up against that daily price action, so each one of these candles represents a full and complete trading day, you’ll see that there is a black line and also a blue line. Now the black line that you see there, that is a regular simple moving average, what we refer to as the actual simple moving average. And all that’s able to do is take the past closed prices, adds them all together, divide by 10 or so and that’s going to plot that line moving forward. Obviously the weakness with a tool like that is it’s only able to look at past prices and it’s only able to look at the target marketing question, in this case, where has General Dynamics closed?
Now what we want to do though is actually compare that black value on the chart to this blue line that you see and for that value every night to be calculated, Vantage Point is doing something very different than traditional technical analysis and traditional moving averages and that to forecast for the future price of General Dynamics, Vantage Point is utilizing artificial intelligence, specifically neural networks, to understand how other related stocks, other related ETFs, global currencies, global futures and commodities, interest rates, how all of those different markets can influence drive and effect the target market in question, in this case General Dynamics, and is actually using those neural networks to generate predictive future prices, so future price that hasn’t yet occurred, and build that into the value of these indicators. Turning what was a lagging indicator that could only look at the past and where the previous market is closed and a forward looking tool that’s actually generating predictions, and so whenever that blue line crosses, in this case below the black line, it’s suggesting average prices are expected to start moving lower than where they’ve been and you’d therefore want to take a short position.
Now, in addition to that predicted moving average that gives you the overall trend direction, you’ve also had this indicator at the bottom of the screen here. You can see it goes from a red to a green back to a red. And this is also utilizing that neural network technology, but only looking ahead 48 hours at a time. So you think of something that’s tuned to really only be looking 48 hours ahead. It’s not looking a week ahead, two weeks, just very short term strength or weakness in the market. And lastly, you’re actually provided with a predicted high and a predicted low. So in the evening about 6:00 PM Eastern time, before the next trading day, you’re provided with a prediction for the high and the low giving good intraday levels to go ahead and take a position from.
So we can see here in this case for General Dynamics overall the move here, really nice move to the downside. As you see shares move off about 35% in just about 23 trading days, or $65 per share. Obviously about 500 shares there. You’re making about $32,000 on that move. But what we really have the benefit of is adapting this to different trading styles. So let’s say you want to be a shorter term trader. Well you’re going to have to be a lot more particular as far as intraday price levels you’re willing to accept and how big of a stop loss you want to run to take on that position.
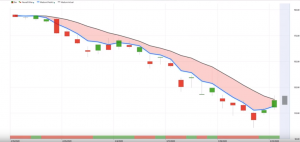
And you see this is where things like the Vantage Point predicted high is extremely effective. Not only to know where to add to your shorts as a trend trader, where to get involved in the market as a day trader, but also maybe where to take some profits along the way as a shorter term trader. Using that lower bounds is a good price to go ahead and take some profit. So a really nice opportunity here, but we’ve seen a lot of opportunities very similar to this and I more so want to highlight how things might be shifting here.
Children’s Place (PLCE)
So again, really nice opportunity about 30% or so, but let’s move on here toA Children’s Place and very similar situation. Crossover to the downside around the 20th of February tail end, just everything starts moving lower. Tons of weakness from the neural index.
You just have a couple of days where you pop up, but getting some more sustained strength here, more recently we’ll take a look at that. But again, having that tool that says, “Okay, well let’s come in with the help of those predicted highs and lows and say, okay, well we know there’s weakness in the market over this time period.” Where do we want to be going ahead and actually getting involved to deal with that trading opportunity? If we do want to go ahead and exploit any opportunities down to the short side here. So you see more recently, if you go ahead and short that level there, getting a lot of strength from the neural index and saying expect some higher prices here. Maybe reduce your position size if you’re shorting over the long haul or get out of the way. Maybe look for areas to hedge the portfolio to the upside.
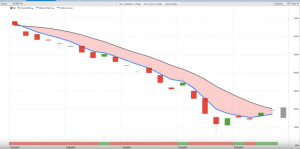
And that’s where we’re going to go ahead here shortly and take a look at some of those opportunities. But again, just tons of these forecasts and it’s all the same way. Blue line crosses below the black line around the 20th if not earlier, energies and shoe companies and things like that. We saw a lot of the weakness, but recognizing that this is an area of weakness, if you want to make money, get on the short side, shorting from predicted highs, a lot of separation between those values over the course of the move.
Axxon Enterprises (AXXN)
Here’s Axon enterprises. So this is actually the company that makes tasers and things like that, but you see, nothing really weathering the storm on February 20th. The crossovers came to the downside. You want to go ahead short, take profits on your shorts, but more recently we’ve seen this crossover to the upside so we can again see, okay, well if you’re actually trading this, if over this period of time you’re saying, okay, I want to be short and shorting the market, well, where are you going ahead and doing that?
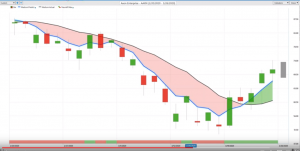
You’re doing it from these levels, getting a really nice entries in this short opportunity. The market moves from pretty much 85 a share down to around 55 or so a share, but more recently, what have we seen? Well, we’ve seen that reversal move to the upside. So again, as we run this scan, you don’t just see one market at a time. You’re not just trading Netflix shares or Apple shares. You’re able to scan and look at the broader marketplace and see, “Okay, these things may still be in downtrends but there’s actually some areas to go ahead and take some long positions here.” And that’s what we’ve been seeing just very, very recently here as you see these fresh crossovers. But certainly you want to be careful is where you’re trying to play that strength.
iAnthus Holdings (ITHUF)
Here Iantus Capital holdings very similar here as far as crossover to the downside, tons of weakness.
We know how that goes. If you’re trying to get short, the a very, very cheap stock, but more recently here we see, okay, well cross over to the upside, very similar to Axon there, but this is where we’ve seen more of this strength come into the market. So you see shares pop in about 42% again, very, very cheap stock here.
Amazon (AMZN)
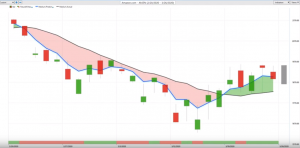
But to really round this out, let’s look at shares of Amazon. And so same thing, everything getting routed here in the 20th and shares moving lower, but now a week old here. You’ve got those crossovers moving to the upside here. If we go ahead and bring in Vantage Point’s predicted highs and lows, you see really nice opportunity down here around 1840 or so. Let’s see what that predicted low level is, predicted low here at 1822 to go ahead and get long Amazon and you see those bullish trades already paying off if you’re taking profit around 1915 or 1950 or so on the next days predicted high levels that are coming through.
So again, you want to have a tool that again is predictive. That it’s not looking at just what’s happened in the past and sort of plotting a line like that forward. And then all you’re really doing is taking another line that’s looking in the past and plotting it against it. What we have here with Vantage Point again is a tool that’s able to actually generate future prices with the help of that technology, those artificial neural networks, and use those predictions to build into the calculation of not only that predicted moving average but your forward looking neural index for this 48 hour forecast and also deriving those intraday predicted high and low levels. So once again, we’ll see you know how this market plays out, but we certainly saw a ton of that weakness come in. The shoe companies, the energy companies getting probably the worst of it.
But just seeing the whole market get routed here, very clean to see these forecasts coming through signaling there’s a big move to the downside, get short and if you want to go ahead and get long, where should you be looking to do that and where is the scan really alerting you that, yeah, there’s some opportunities to go ahead and maybe create a hedge portfolio at this point and make money should the market go up or down here. So have a great rest of your week everyone. Once again, this has been our Hot Stocks outlook for March 27th, 2020. Thank you all for watching. Best of luck and bye for now.


