


Hot Stocks Outlook for the Week of
March 5th, 2021
The Hot Stocks Outlook uses VantagePoint’s market forecasts that are up to 87.4% accurate, demonstrating how traders can improve their timing and direction. In this week’s video, VantagePoint Software reviews forecasts for GeneralElectric(GE), Ruth’sHospitalityGroup(RUTH), TakeTwo Interactive(TTWO), SPLUNK (PBF) and CernerCorp(CERN)
Register for a Free Live Training
GeneralElectric(GE)
So a really good example here within General Electric, though, of how all of these indicators work really regardless of the market that you might be trading. So what we have here is daily price action. So each one of those candles is a full and complete trading day. And you’ll see that there is actually a black line and a blue line right against that price data. And so what that black line is, is actually a simple moving average. So it’s a very common technical indicator. And what it does is it actually acts as a good measure of where market prices have already been.
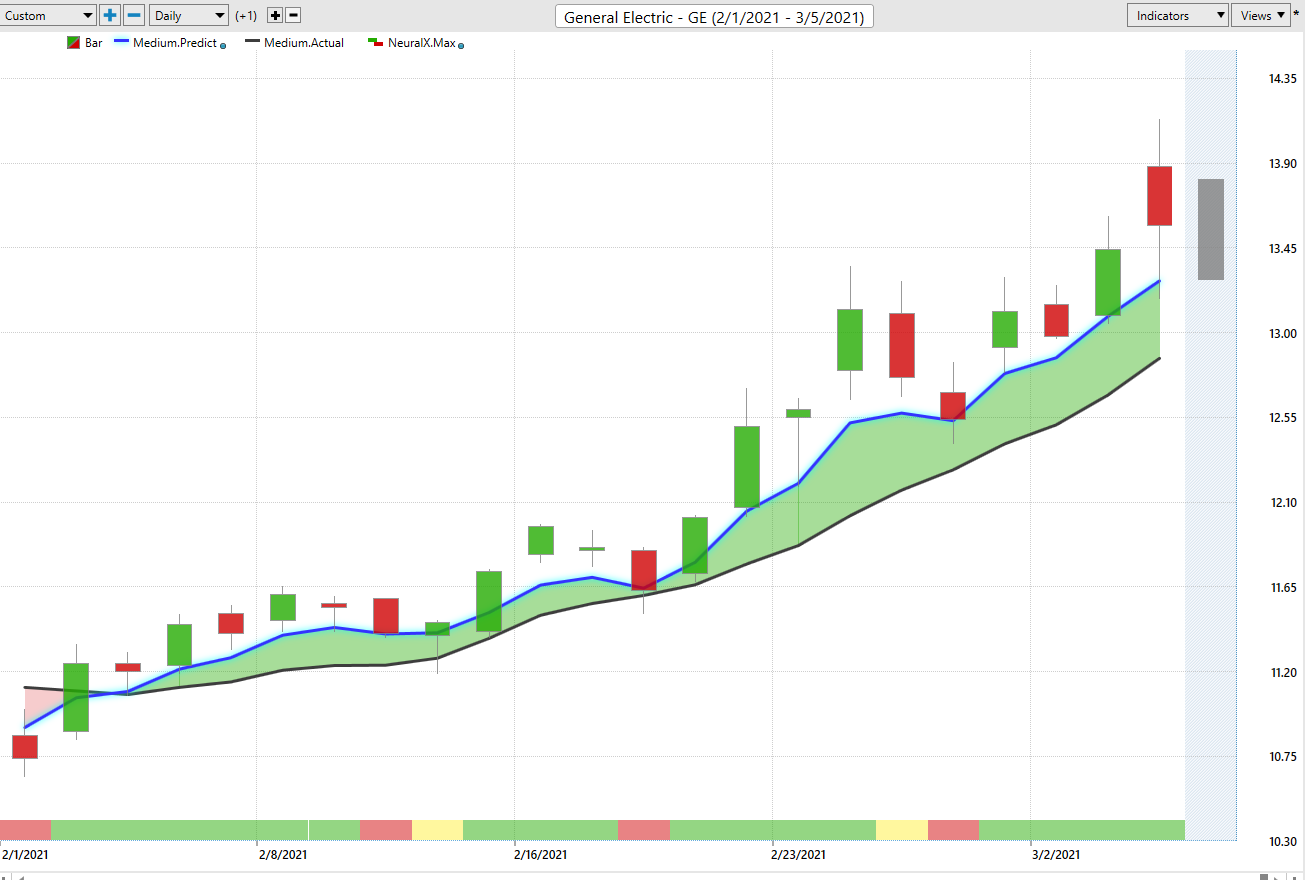
So a simple moving average just takes the last 10 close prices, adds them all together. It really smooths out that data so we can really see where things are at. But obviously traders need to understand, well where are prices likely to go moving forward? And so what we’re able to compare that lagging value too, is this forward-looking predictive moving average, and to generate and calculate that number each and every day VantagePoint is utilizing its artificial intelligence neural networks to actually do what’s called intermarket analysis.
So what that means is rather than just looking at the past price of General Electric, like a regular technical analysis tool, or a simple moving average would do, what the technology is doing is actually looking at intermarket relationships that are known to drive and influence this target market that you’re trading. So that can be things like individual stocks and other markets within the stock market, as far as individual companies, but that can be broader things like ETF groups that are going to have an effect on the overall marketplace.
That’s going to be things like the S&P 500 or the NASDAQ, the major indices. That’s going to be things like global currencies or global interest rates. And so what happens is it’s able to understand these relationships and how they affect future price. And it uses those calculations to actually generate true price predictions. So things that haven’t yet occurred yet as far as where is the future price of General Electric going? And it takes that data and actually uses it to construct this predicted moving average, this forward-looking predictive tool. So whenever that blue line in this case crosses above the black line, it’s suggesting average prices are going to start moving higher. Now in the same way that those neural networks are forecasting future price, they’re also used to calculate the value of this neural index at the bottom of the chart. And you see that this actually gets updated every single trading day, and it’s either going to be green or red, but what it’s forecasting is very short term strength or weakness.
So it’s programmed to look ahead really just 48 hours, or you can think of it as two trading days, so very, very short term strength or weakness in the marketplace. And then at the very right hand side of the chart, you’re going to see that there’s a shadow candle there. And what that is, is these neural networks actually picking out a predicted high and a predicted low for the next trading day. So intraday price levels where you can set limit orders, set profit targets based on your trading approach. So as long as that blue line, again remains above the black line, suggesting average prices are going to start and continue moving higher. And therefore what you’d want to do is look towards VantagePoint’s predicted levels to make trading decisions. So we can actually see how accurate each one of those predicted highs and lows are against the actual market data that wants to trade it.
So you see that what’s going to happen is a candle is going to fill in here based on what actually occurs and we’ll see how accurate today’s predicted high and low was. But what you can see is you get this very good measure of, all right, the overall trend is up. You’d only want to be a buyer in this market, but of course look towards or at these predicted lows as a very exceptional level to go ahead and take a position. So you see here as the market trades forward over the course of, what’s really been about a few weeks of trading here, you’ve gotten multiple entries really at the lower part of the range, and still been able to participate in that uptrend as the overall trend continues. So we’ve gotten a really nice move here in General Electric. And this has been a great opportunity to go ahead and get long or buy call options and participate to the upside.
As you see shares up about 19%, just in the past 19 trading days. So about a 500 shares there has you up over a thousand dollars and that being a very, very small position, if you started your buying down at $11, $12 per share. Now moving forward, we have Ruth Hospitality Group in a very similar situation. And what’s been interesting is the great disparity of individual stocks. Some are doing very well. Some are actually doing very poorly and we’ve seen the indexes turn lower, and there’s actually some tools within the VantagePoint software that you’re going to identify when things like the indexes turn lower.
Ruth’sHospitalityGroup(RUTH)
And when individual stocks turn lower, you can scan for where this blue line is crossing the black line, whether the upside of the downside, as far as that first crossover being created and let you know that there’s a trend reversal in the market, but here in Ruth hospitality, you see that we’ve gotten this crossover between the blue and black line, really towards the beginning of February there, you’ll see that you’ll get these periods where the neural index will go bearish.
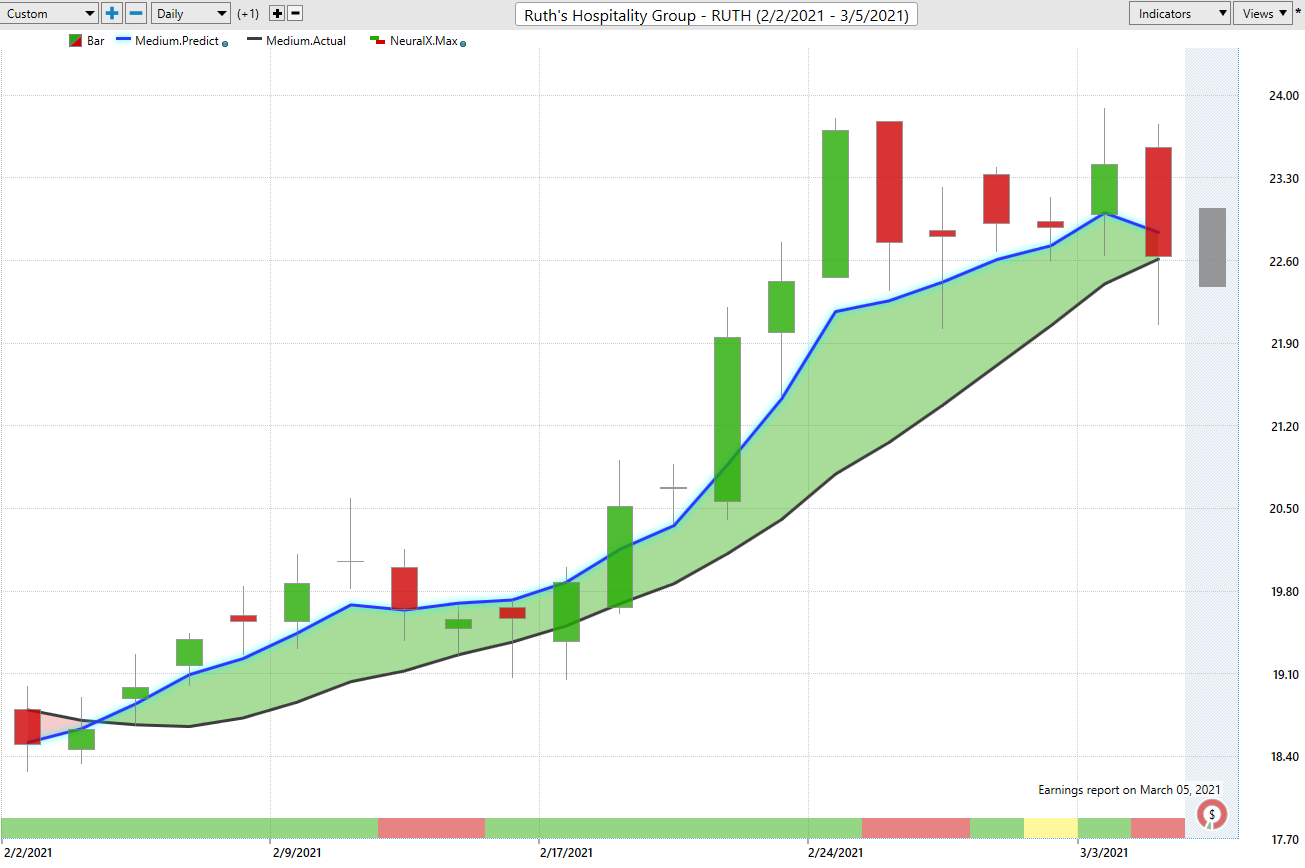
So again, it’s forecasting just short-term weakness. You can think of it as just expect some lower lows or another way to think of it is you’re likely to see the market trade below this predicted moving average. So if that’s a good measure of average prices, we can trade above or below that value, but likely to see some lower lows when that neural index is forecasting some weakness over that next 48 hour window. But overall, of course, if that blue line remains above the black line, you want to continue that buying campaign here. So you see here that come a little bit outside of the range here on this day, but very quickly, the software does really good job of adapting and saying, “Okay, well, where are things at? Let’s recalibrate and really get tuned into where these predicted highs and lows are likely headed.”
And you see once again, getting a really nice rally to the upside. Shares moving up more than a few dollars per share here, but of course, being able to recognize that early and then having a tool that not only lets you know where things like these predicted highs and lows are going in today, but how likely that trend is to continue. So you can understand and say, “Okay, well, if I want to participate here, you’re in an overall uptrend.” Use these shorter term tools to get that good entry and make some money on the bullish side here. Shares up about 24% in the past 19 trading days, again about $2,200, just on 500 share position there.
TakeTwo Interactive(TTWO)
Now, technology stocks in the NASDAQ, we’ve seen a lot more weakness there. And so here in Take-Two Interactive, you see pretty much just the opposite, really midpoint in February, getting this crossover to the downside, just a ton of weakness here. And you can see the accuracy of the forecast here as far as when the trend is down, when the neural index is bearish, to the very weak period, and then you would want to make sure you’re only taking short positions, potentially covering those positions, but pretty much only short cover shorts. You see here that the neural index goes bullish and you get a little bit of a bounce here, but you’re never getting that actual crossover between the blue and the black line.
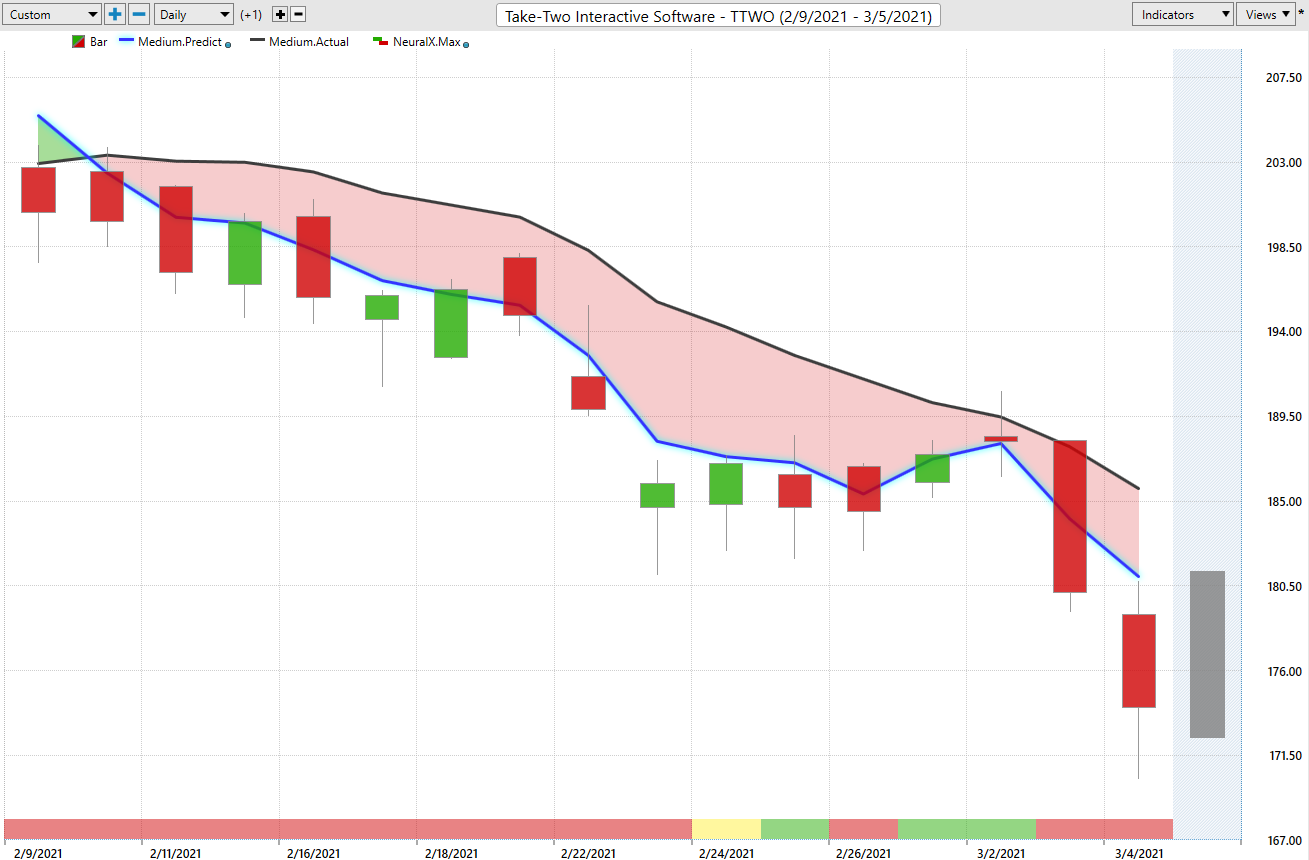
The overall trend is still remains to the downside. And you’d still want to exploit the bearish side of the market. We can view those predicted highs and lows, and again, see a really nice entry, especially on days like this, where you gap up. But if you have an order there, you’re getting filled at the open and then that weakness very quickly coming into the marketplace and seeing shares a decline once again.
So really helps you go get a good average price, but then make adjustments with that and understand, okay, well where’s the market likely heading, and make sure you don’t have stops sitting up in an area like this if you’re intending on remaining short and you see here that a really nice move to the downside here, definitely some places in the market where you do not want to be long. And you’ve seen again, the equity indexes, the Russell 2000, make some pretty dramatic pullbacks here over the past couple of weeks. And some of these stocks have really suffered. So you see shares off over 11% in the past 15 trading days, a little bit more expensive of a stock here, but easily a hundred shares there. Going to have you up over a couple of thousand dollars to the downside in that opportunity.
SPLUNK (PBF)
Here’s Splunk very popular stock here. Very similar situation though, you get this crossover to the downside, you get just a little bump as the neural index gets bullish and you see shares go sideways for a little bit, but see that separation between the blue and the black line actually separating more and more. And the overall trend very clearly here being a very bearish period from that neural index perspective, as well as the trend, and things really accelerate to the downside there. So again, we can look at those predicted highs and lows, and again, you see that even on a day like this where not a whole lot’s happening, you got that predicted high and low range moving up and letting you know, look expect some higher prices here. But as long as that blue line is remaining below the black line, only want to short, take profits on shorts and exploit in this case, the bearish side of market.
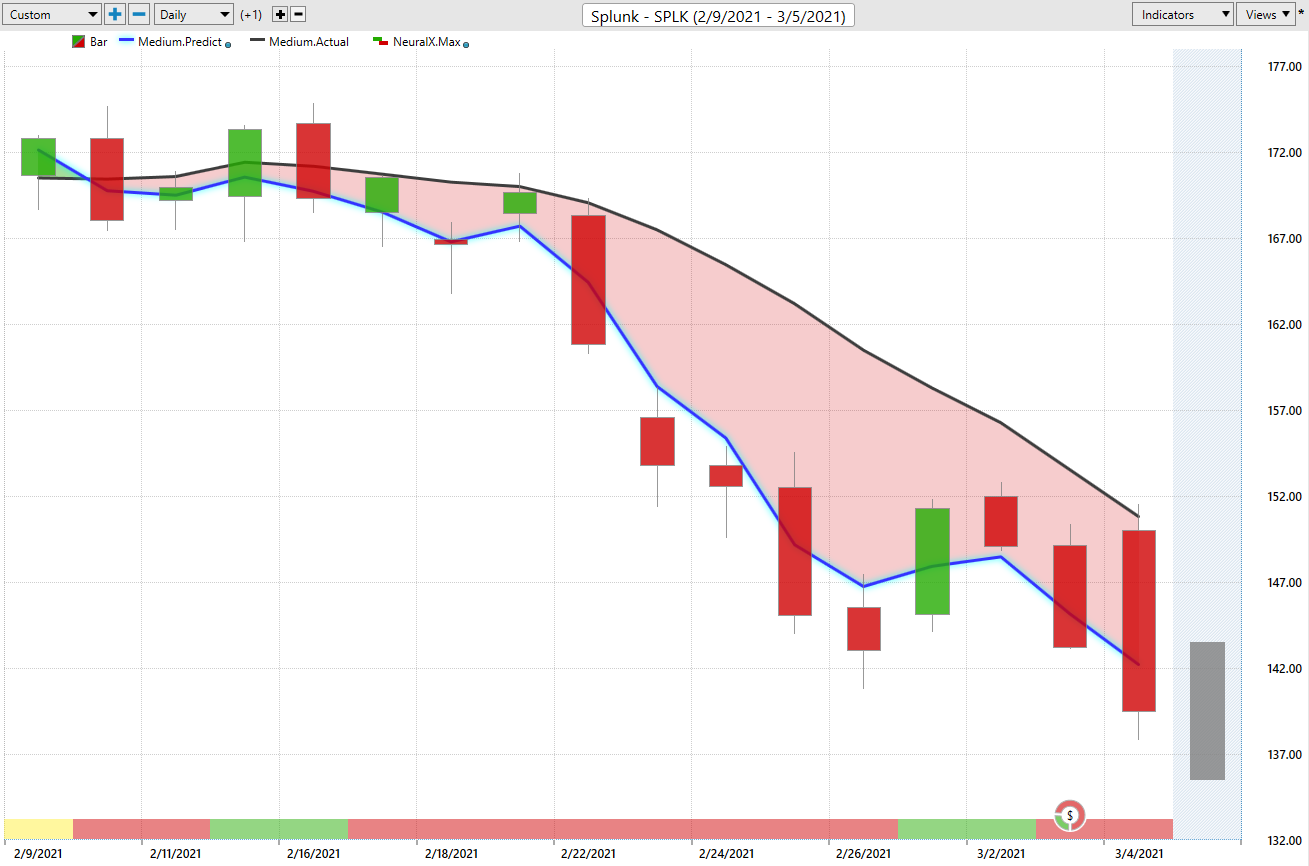
You potentially, when you see these crossovers come through potentially buying some put options, but here we have a share price down over 16%, just in the past 14 trading days, again, a little bit more expensive of stock here, but even a hundred shares there, a very nice position of a couple thousand dollars moving in the right direction.
CernerCorp(CERN)
Lastly, here, here’s Cerner Corporation. And again, one of these markets where you’re seeing some definite weakness from the VantagePoint forecast, and this is not something that has just started. That equity is pretty much topped out. And as far as the indexes have run sideways and down for a while here, and some of these stocks have really suffered much more so than even the index is pulling back a little bit, but we’ve definitely had some weakness out there. And you see here, there’s crossover to the downside really towards the end of January signaling, you only want to short and take profits on shorts. Now you see sometimes markets just take a little bit a while to get going, but you see here that the neural index is warning you, expect those bounces higher, expect things to run sideways, but again, that blue line creating that separation and letting you look, the overall trend is down. No reason to be long here. And definitely go ahead and use those predicted highs to take short positions.
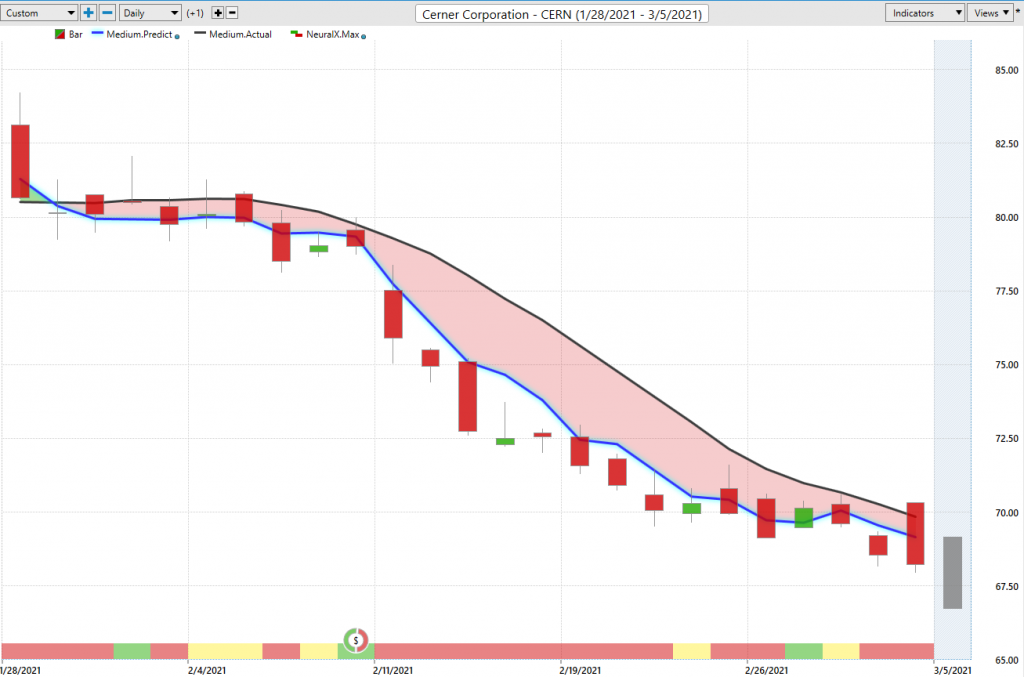
You can always cover down at the predicted low, but certainly looking if you’re looking to be a trend trader over a longer term period, get those good entries. And as long as that trend is projected to continue, you can maintain that short position. So once again, we can see over the entirety of the move here, we’ve gotten a nice decline lower, shares down here over 15%, just in the past 21 trading days. Again 500 shares there has you about $6,300 to the bearish side. So there’s been ample opportunity here, but it’s been very clear from the VantagePoint forecast that there’s some cracks in some of these stocks here. In the major indices, we’ve seen those actually turn lower as far as the predicted moving averages. And then you want to focus in on where are those stocks where there’s excessive weakness, those are probably really going to move lower, especially if we get weakness broadly throughout equity prices.
So once again, this has been our Hot Stocks Outlook for March 5th, 2021. Thank you all for watching, best of luck and bye for now.


