Register for a Free Live Training
Hot Stocks Outlook uses VantagePoint’s market forecasts that are up to 87.4% accurate, demonstrating how traders can improve their timing and direction. In this week’s video, VantagePoint Software reviews forecasts for SPDR SPY($SPY), Blue Bird ($BLBD), Ciena ($CIEN), AMD ($AMD), Microsoft ($MSFT), Robin Hood($HOOD).
VantagePoint A.I. Hot Stocks Outlook for May 16, 2025
Hello again, traders, and welcome back to the Hot Stocks Outlook for May 16th, 2025. I hope you all have had an excellent week out there in the financial markets. As always, we’re here to cover the most recent VantagePoint A.I. predicted forecast.
So, if you haven’t already, make sure you go ahead and click on the link down in the description below, and you can get signed up for a live demonstration so that you can learn all the specifics about how these predictive technologies are helping traders make much better trading decisions when out in the marketplace.
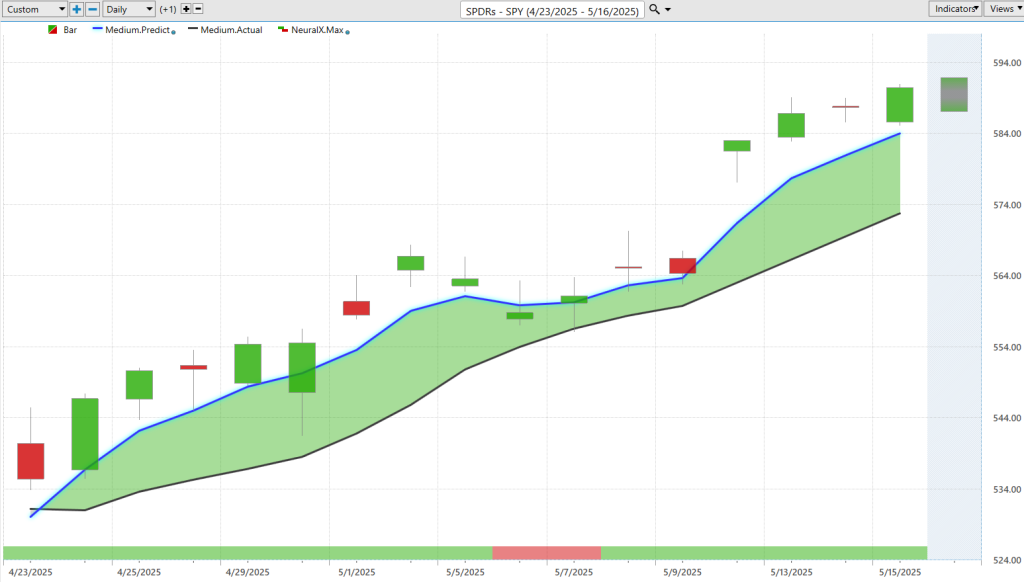
Now, as we typically start out, we like to take a look at the S&P 500 via the SPY ETF. So we’ll go ahead and look at the chart and really examine how these predictive forecasts work. When we come back to our graph, we can get some of these given periods of time—get a sense of where the markets are at here.
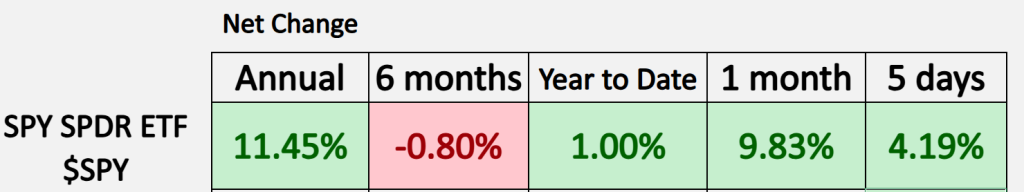
Year to date, we have now clicked up 1%. So we had a really nice rally. The market gapped up with some announcements about tariffs over the weekend, and that has led to a 10% move just in the past 30 days. So really exciting opportunities, and the market’s of course done well this week.
Let’s go ahead and highlight—well, where have the VantagePoint forecasts been highlighting some strength? We can actually just look straight towards the SPY ETF. When we understand how to interpret this forecast, we can carry that on to all of these subsequent opportunities within individual stocks.
What we see here with SPY is daily price action, right? So each candle that you see there is going to represent a full and complete trading day. Right up against that price data, you should first notice that there is a black line value and a blue line value.
Now, the black line that you’re seeing there—well, that is a simple moving average, a very common technical analysis indicator. In this case, it’s a 10-period simple moving average. So it would take the previous 10 close prices, add them all together, and then divide by that number. That acts as a great baseline. But that baseline lets us know where market prices have been—not where they’re going next.
That’s where VantagePoint traders are able to utilize these proprietary predicted moving averages. So, this blue line—whenever we see that move above the black line or the actual moving average—it’s signaling that average prices are expected to start moving higher.
What’s important to understand is that before this number, which you can think of as a calculation of future prices, gets plotted and calculated and placed on the chart every evening—this is where that technology of artificial neural networks comes into play. They’re performing what we would call intermarket analysis.
What that means is something like the SPY shares some valuable price relationships and important price relationships with other ETF groups. We can look at the QQQ, we can look at IWM, or the DIA. It also looks at things like global currencies—things like the value of the U.S. Dollar Index, global interest rates, and it can even identify some important market relationships between individual stocks.
It looks at literally dozens of other markets that share these valuable price clues—some of them leading relationships, some lagging, some inverse, some positive correlations. This is where neural networks are really able to suss out all of that information and identify what’s important to determining where prices are likely headed next.
Again, whenever we see that blue line cross above the black line, it’s suggesting that these average prices are going to start skewing to the bullish side and start moving higher. You see that since that forecast has come through, we’ve got about an 8% advance over the past 15 trading days.
If you’ve watched these previous Hot Stocks Outlooks over the past few weeks, we’ve been highlighting bullish opportunities where that predicted moving average has a lot of distance from the actual moving average. That would signify stocks that show a lot of momentum to the upside and are participating in this uptrend.
But that’s not really the entirety of the forecast, and this is where things get really exciting. If you look at the bottom of the chart, you see this bar that goes from green to red, back to green—this is updated every single trading day. It’s utilizing that same approach of looking at those intermarket relationships and using that information to generate predictions about future prices. But this is tuned to solve a different problem—and that problem is just short-term strength or weakness over a two-day period, or a 48-hour window.
When we look at these forecasts, we can see that, look—if that neural index goes bearish, you see that the price action is somewhat subdued over the next couple of trading days. By the time we get this forecast, it’s signaling that we should expect momentum to heat up. You see we go through Friday and really just propel through that strength as we get that tariff announcement.
Really nice opportunities where anything in the portfolio using this approach, for the most part, is going to benefit as we get this explosion higher in price. Let’s go ahead and take this example and look at some other markets.
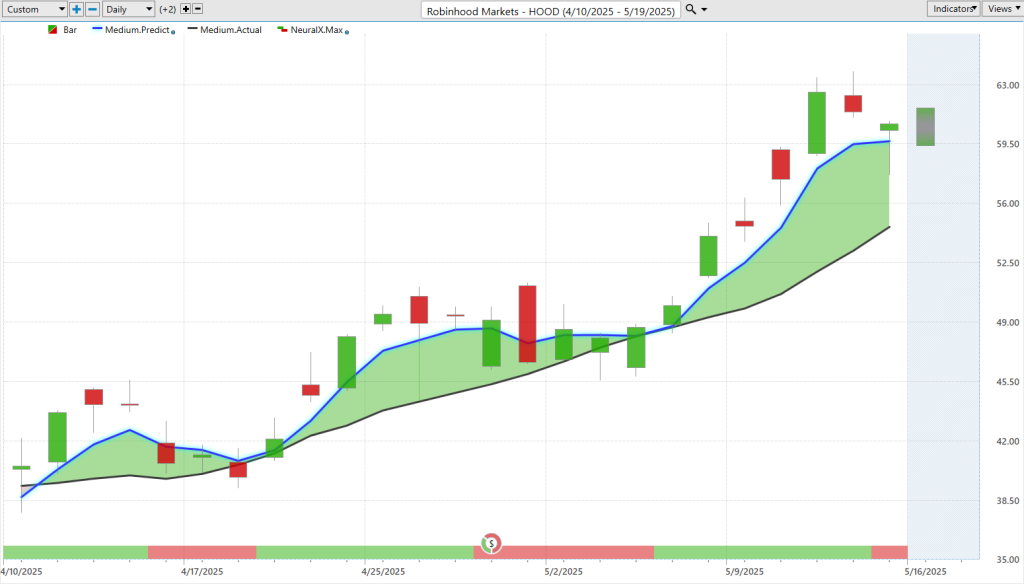
Now here’s Robinhood. I wanted to bring this through because it’s a great example of how all of these predictive tools work together. You actually see that we got this blue line crossing above the black line a little earlier—really towards the midpoint in April here. But notice how the neural index goes bearish and you get these subsequent weakened days of price action.
Again, it happens here through earnings—we just get sideways price action. But the blue line never crosses below the black line. As you see that neural index get bullish again, that’s where momentum picks up and provides some really nice trading opportunities.
So here in Robinhood, we’ve seen shares move up now about 49% in the past 24 trading days, and you’ve never seen that blue line cross below the black line. As far as all these opportunities—you see SPY here in the middle of the week or the middle of last month—we get this opportunity where you never get that blue line crossing below the black line. This might be an area where you want to hold on to that position and benefit more recently as we get a lot of that broad-based strength throughout the market.
Now, I’ve brought through a couple of opportunities that just stood out earlier—as far as when we started to see those crossovers. When the tariffs got repealed, we got a big upswing in the markets, and we’ve seen persistence there as far as the bullish trend.
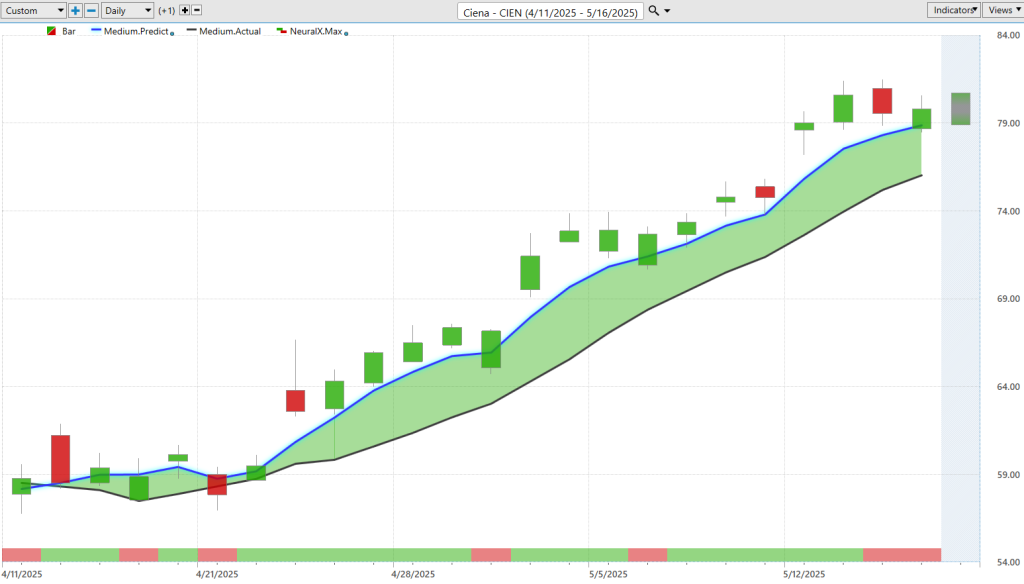
Here’s a tech stock, Ciena. Really nice opportunity here with the blue line crossing above the black line. A little sideways price action early, but then again, when you’re identifying where there is strength in the market, let’s identify these markets where that predicted moving average has a lot of distance from the actual moving average.
What’s really impressive about this is we’re actually provided a predicted high and a predicted low for every single trading day. Once you get that overall trend direction, then you’re getting updated short-term strength or weakness from the VantagePoint predicted neural index, but also the VantagePoint predicted highs and lows.
Now you’ve got intraday levels that are provided before each and every trading day. You see how this works—once you’ve identified the overall trend in a market where you may want to focus your attention, then you can utilize these levels to add into your positioning—potentially building a larger position, potentially taking some day trades where you buy the market towards these predicted lows and target these subsequent predicted highs.
This allows traders to get ahead in the position, take a little profit, but also potentially hold on to a longer-term opportunity here. Again, we’ve seen really nice moves here—a 35% rally over the past 22 trading days. Again, just honing in on these areas where that prediction and the short-term neural index and the predicted highs and lows are confirming that the trend is still bullish.
Hot Stocks Outlook uses VantagePoint’s market forecasts that are up to 87.4% accurate, demonstrating how traders can improve their timing and direction. In this week’s video, VantagePoint Software reviews forecasts for SPDR SPY($SPY),
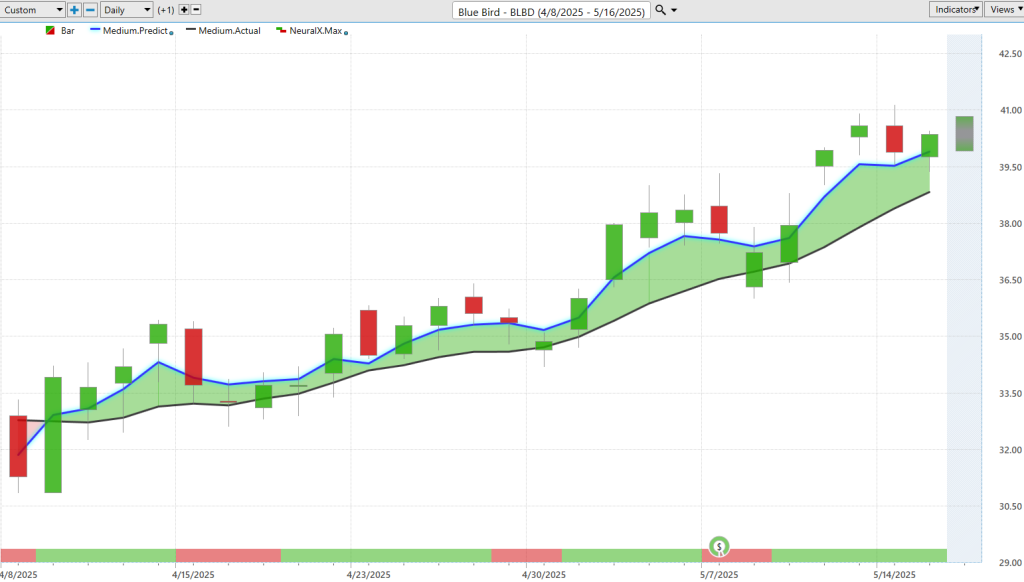
Bluebird is another opportunity here, where we’ve gone over this literally since this crossover. As soon as that strength came in, this stood out as one of those opportunities where we have that trend to the upside. You’ll see that again—the neural index can get bearish and warn you of these subsequent retracements in price. We went through earnings here, but overall, you understand that the trend is bullish.
We want to use these VantagePoint predicted levels to be a buyer and potentially take some profit on those longs as we move higher in price, but also to reestablish a position. You see even this week, as we get that move through the weekend, where we get the gaps—not really tradable opportunities as you gap higher in a lot of stocks—but notice the past couple of days as the forecast settles in and says, “Okay, where should we expect price to trade?”
See the neural index—very bullish still—and offering up a nice opportunity here. I think this is the fifth week or so where we’ve brought in Bluebird, just highlighting this trend is continuing. The predictive neural index and predicted highs and lows are doing their job, guiding the trader forward to make those trading decisions and exploit—in this case—the bullish side of the market.
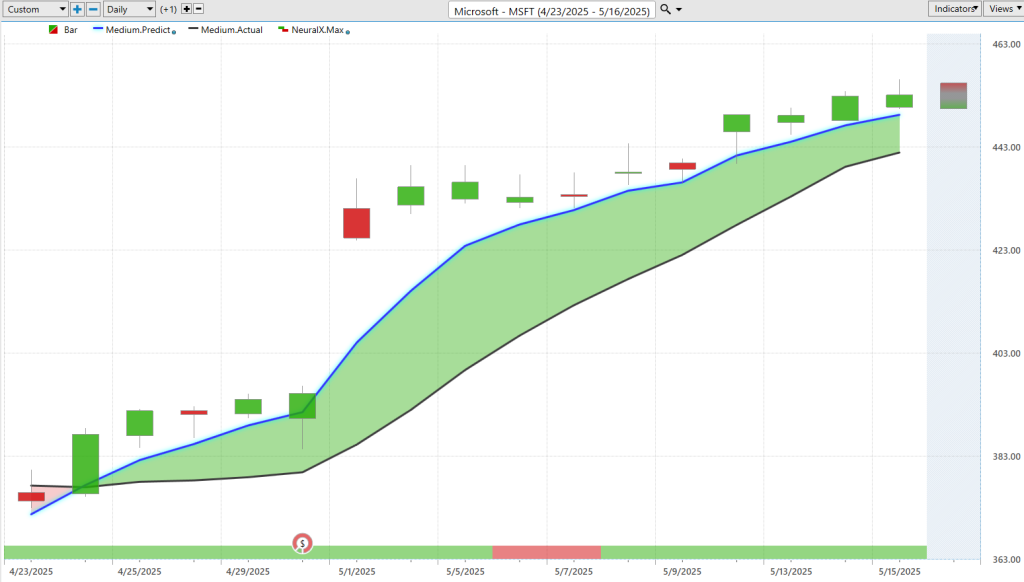
Here’s Microsoft—a very popular stock. There’s a lot of correlation with the broader market—the S\&P 500. Here, you see that blue line crossing above the black line again, coming into earnings. Look at all of this strength. If you understand that, okay, we’ve got a lot of strength here, we can buy the SPY, we can buy individual stocks, maybe we want to trade Microsoft.
More importantly—even after all of that move around earnings—we can look at how accurate those daily predictions are. Those daily highs and lows—the neural index, again—you notice the neural index goes bearish. We run a little sideways—not much going on—but then we get that uplift in prices.
Again, we can say, even with all of that volatility around earnings and that big gap in the chart, this is where the software does an excellent job of getting back on track and understanding, “Look down towards these predicted levels to potentially be a buyer.” We’ve seen the markets just keep scooting higher here—so really nice opportunity in Microsoft.
Again, highly correlated to the SPY. Really, most markets where we’ve gotten a nice move here on the bullish side are highly correlated. So this is where you want to understand: hey, there is strength in the SPY, and we can identify some of these individual markets where we may want to participate in that, but see a very similar trajectory here as markets improve—really wanting to pick your spots where you see those really strong forecasts and predictions.
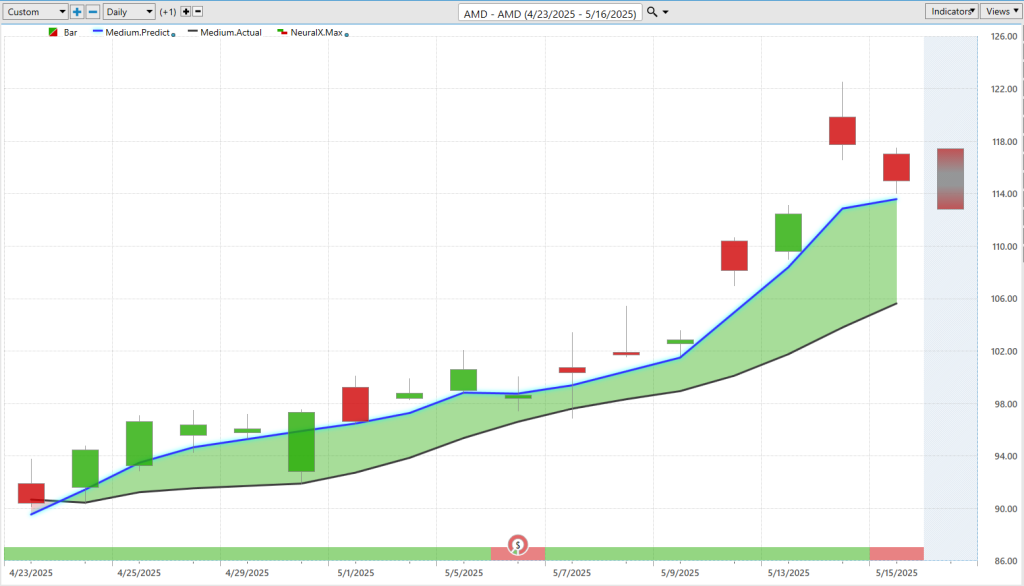
Lastly, here—AMD, which we brought in last week. Again, really benefited off of this gap higher we’ve seen in the market. Of course, you want to establish those positions early. When you have the tool that says, “Okay, we’ve got this blue line crossing above the black line, neural index bullish,” we’re going to go through earnings right here on the calendar.
Look at those predicted highs and lows. You get plenty of opportunities to establish a position down towards these levels. You’ll notice that if you’re ready to come in down towards these predicted lows, the market never returns to those levels. Once the trend continues—especially as we get through earnings—you never came back and even touched these 93–94 levels on the chart. Now we’re trading up about 116.
So again, really nice moves here in shares of AMD. But again—very simple forecast. Blue line above the black line. A lot of separation. A lot of strength from the neural index. It really identifies a place where you can focus that attention—see about a 26% rally here in the past 16 trading days.
Really exciting stuff. Really nice moves spread out through a lot of different markets. But this really speaks to that intermarket analysis approach. You see a lot of correlation in the market, and you want to identify that. Really understand that the broader markets are going higher. You can pick a few stocks where you really see those strong forecasts and then benefit off of the very short-term predicted highs and lows. Really make the most of those opportunities.
So once again, this has been the Hot Stocks Outlook for May 16th, 2025. Thank you all for watching. Best of luck out there, and bye for now.