


Register for a Free Live Training
Hot Stocks Outlook uses VantagePoint’s market forecasts that are up to 87.4% accurate, demonstrating how traders can improve their timing and direction. In this week’s video, VantagePoint Software reviews forecasts for SPDR SPY($SPY),
Fiverr International ($FVRR), Zoom ($ZOOM), Goldman Sachs ($GS), CHEWY ($CHWY), Booz Allen Hamilton($BAH).
VantagePoint A.I. Hot Stocks Outlook for May 23, 2025
Hello again, traders, and welcome back to the Hot Stocks Outlook for May 23rd, 2025. I hope you all have had an excellent week out there in the financial markets. And, as always, we’re here to take a look at the most recent VantagePoint A.I. predictive forecast. So, if you haven’t already, go ahead and click on the link down in the description below and you can get signed up for a live demonstration and learn all the specifics about how these predictive indicators and technologies can help you manage and execute your trading strategies within the marketplace.
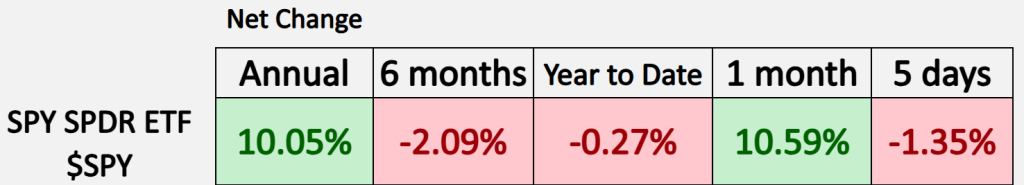
So, we’ll go ahead and start out, as we typically do, by taking a quick look at the S&P 500. And so, we can see that from last week, we’ve given up that year-to-date mark. We were up about 1%, and we pushed back below that start-of-the-year level. But we’re still up about 11% in the last month, and that’s what we’ve really been highlighting — these opportunities where the VantagePoint forecasts are exceptionally bullish, and we’ve seen really nice trends.
But we do want to be very cautious here and make sure that we’re keeping a close eye on those VantagePoint forecasts and understand how things may be shifting.

So, we’ll go ahead and start out with this really nice example from Fiverr International (FVRR). This is a great example of how all of these predictive indicators work together to produce that robust forecast for traders.
And so, what we’re looking at here is daily bars and candles — so each one of these candles is going to represent a full and complete trading day. And it’s right up against that price data that the first thing that you’re going to notice is that there is a black line and also a blue line value.
Now, the black line that you’re seeing there — well, that is actually a simple moving average, or what we refer to as the actual simple moving average. And that is a 10-period. So what it does is it just looks back at the previous 10 closes, it’ll add all those values together, divide by that number, and what that does is act as a good baseline and lets us know where market prices have been.
But, obviously, traders need to be ahead of that next move in the market. And so, what VantagePoint users are able to do is compare that black, or lagging, moving average to the VantagePoint proprietary predicted moving average. And so, we can think of this as a future representation of prices that are getting plotted on the chart — calculated and plotted on the chart every evening for the trader.
And so, whenever we see those predicted moving averages move above the actual moving average, it’s suggesting that those average prices are going to start moving higher, and traders may want to look to take a long position.
Now, what’s important to understand is how it does this. And so, to generate that value and place it on the chart — rather than just looking at past prices, right — so traditional technical analysis really just reconfigures what’s already occurred, VantagePoint’s technology is looking at intermarkets — so other markets that are known to drive and influence and provide exceptional price clues to where, in this case, Fiverr, the target market, is headed next.
And this ranges across the entire financial system. This can be other individual stocks. It can be ETFs within the sector. This can be things like global currencies or interest rates, or even global commodities like gold and oil. And so, it takes all of this into account, specifically for the market you’re trading, and uses that information to generate these highly predictive and highly accurate forecasts.
So, again, we see as that blue line crosses above the black line, it’s suggesting that prices are going to start moving higher. And over the past month here — well, where is an area where you might want to exploit the bullish side of the market? Well, here in Fiverr, you see that blue line maintains above the black line for the duration here and is still in a strong uptrend after a 35% — almost 36% — rally just in the past 30 trading days. So, very exciting stuff here.
But let’s go ahead and explain how some of these other predictive indicators work. And that again really rounds out the predictive forecast. So, if you look at the very bottom of the chart, you see this bar that goes from green to red back to green. Well, this gets updated every single trading day. And it again uses that technology to produce a very high level of accuracy on whether we’re going to see higher or lower prices over the next 48 hours. So, you can just think of that as a couple of trading days — two candles on the chart.
And so, you’ll see here that as the trend moves to the bullish side and we say, “Okay, well the trend is up. You’d only want to look to take long positions and take profit on those.” Well, you see that the neural index goes bearish here. And again, that’s always looking ahead just 48 hours at a time. So, you’ll notice that when that bearish signal from the neural index comes in, we start to run sideways and consolidate a bit.
So, VantagePoint traders can be ahead of that, understand we’re likely to see some short-term weakness, don’t expect for the market to break out right away. But as long as that blue line remains above the black line, that trend is up. And you’ll notice that as the neural index gets bullish, we really start to see momentum in the market return. Again, neural index gets bearish — consolidation — but once that neural index gets bullish again, you see it leads to this really nice rally over the past few weeks, where again we’ve been highlighting these very bullish opportunities.
So, lastly, we actually are provided a predicted high and predicted low. So, VantagePoint traders — before every single trading day — you’re provided the expected daily range. And this is what allows traders to set limit orders, potentially profit targets, and again incorporate that information into your analysis and your strategies.
And as we look back and say, “Okay, well, how accurate are all of those predictions against the actual market data?” And so, you see as this trend got started, it’s warning you that, “Look down here towards these predicted lows to be a buyer in the market.” You see it gives you an excellent entry down here about $24, which now we’re pushing up against $34.
But as that trend starts moving again, you get this adaptive technology that’s telling you, “Look for these prices to move down towards these predicted levels intraday.” You see about — you know — half the time you’re getting down to that predicted low. And within a couple of trading days, you’re trading higher still.
And so again, more recently, seeing these predicted lows get hit — you get days like this here, typically around weekends, where you don’t hit the predicted low. And sure enough, next trading day, you’re headed to that predicted low before the trend resumes.
So, really nice opportunity in Fiverr, and a good example of how all of these predictive tools work together. So now we can take that information and really understand any forecast produced within the VantagePoint intermarket analysis software.
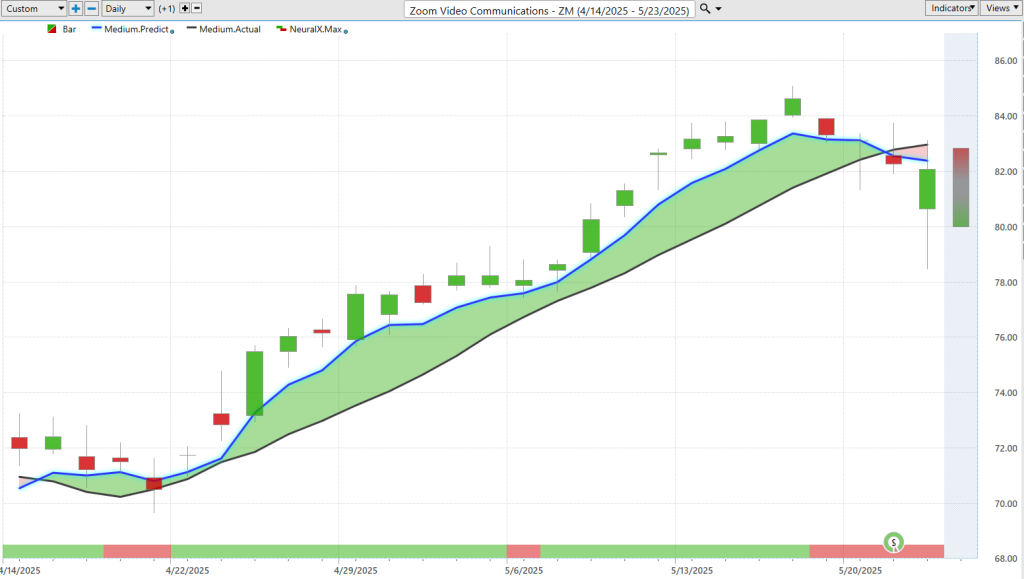
And so, here with Zoom Video Communications (ZM), I wanted to highlight this because we saw a lot of strength come through this period. And so it’s been very clear — you know — we want to find those areas where that predicted moving average is well above the actual moving average. Last week, we highlighted markets like Bluebird and Ciena. We just keep bringing those through because there’s a lot of correlation in the market. When you find an area that’s working well, you can keep exploiting that opportunity.
But you see as this market starts to move higher, we get that really prescient signal from the neural index — right — letting us know, “Look for that short-term weakness.” And then the momentum really comes in. We get a little blip here again — neural index gets very bullish, that momentum comes in. But more recently, you’re actually seeing a fresh crossover to the downside.
So, what’s really cool about this, again, is understanding that, “Okay, on the uptrend, well, we’d look towards those predicted highs or predicted lows to potentially get a position.” And in a downtrend, well, you’d look towards the predicted highs to potentially sell your long positions or even short.
And so, we can see again how accurate are all of these levels coming through. And again, it’s not just one day here, right? Things get updated. We get another level. And so, you’re constantly provided this information to help and guide you with your trading. See nice entries — nice entries here in the midpoint of the trade — before this rally continues. But more recently, what have we highlighted? Neural index — bearish — crossover and move to the downside. And you see the selling coming in from these predicted highs.
And so, that’s how traders can take in that information, manage the opportunity, and then walk forward with everything as VantagePoint makes those adjustments and continually updates these forecasts for the trader.
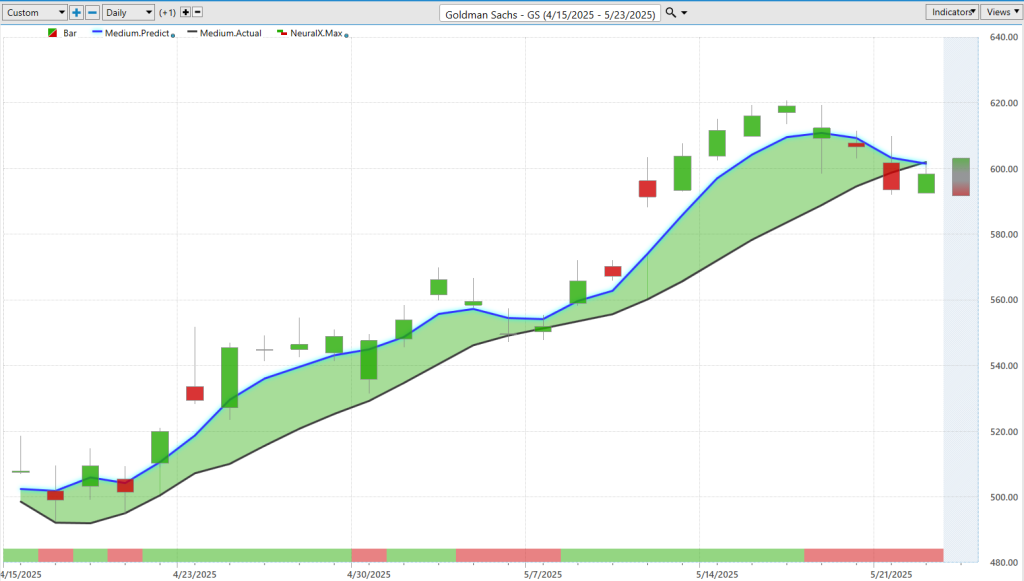
Here’s Goldman Sachs (GS) — very important financial stock. And again, recognizing a little bit of a pattern here as we get this blue line crossing above the black line, neural index very bullish, we get some sideways price action here early in the move and a couple of dips here, as you see that neural index getting bearish and getting some weakness.
But more importantly, again, seeing some of these markets actually cross to the bearish side. So, what I wanted to highlight here is that — what have we been focusing on with these Hot Stocks Outlooks over the past several weeks? Well, identify these markets in uptrend, use these short-term predictive forecasts to do that trade management that you might need to do day-to-day. But really pay attention to when these things start to shift as well.
So, you see again — see Zoom here flipping lower, Goldman Sachs getting that predicted moving average below the actual moving average, and actually some weak — you know — forewarning of that weakness, really at the beginning of the week signaling, “Look for these lower prices,” and keep updating those expectations.
So, we can again look at these predicted highs and lows. And you see here early in the trade — really nice opportunities to get involved. If you’ve got an order waiting, you’re just going to get filled at the open. And so, really nice opportunity on the upside, but starting to see some of these conditions shift. And so, that’s what’s very important to recognize — and keep updating these forecasts with the VantagePoint software.
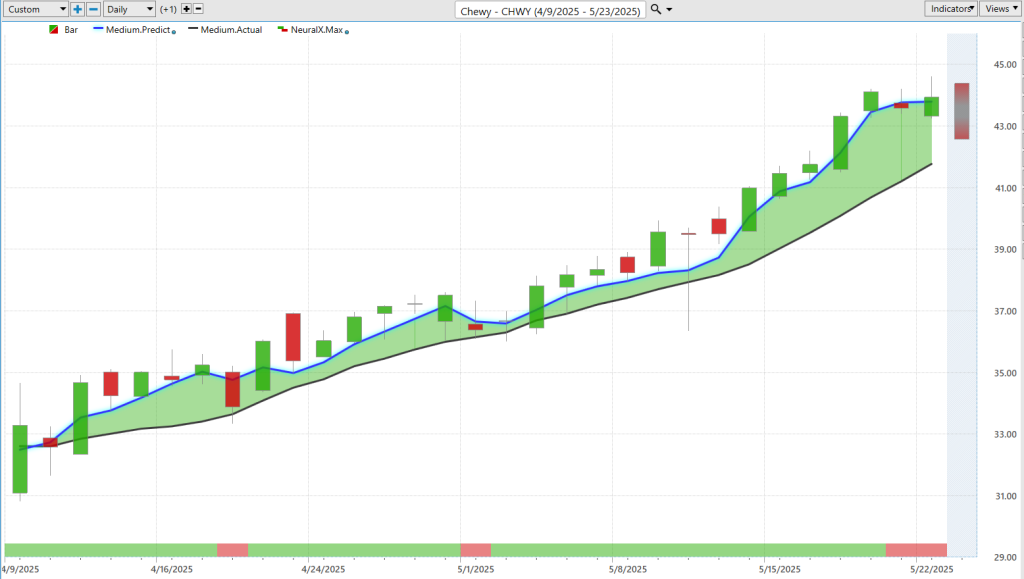
Here now is Chewy (CHWY). Again, blue line crossing above the black line — again, just highlighting these areas over the past several weeks. Where are we in strong uptrend? Where is that neural index confirming the uptrend and momentum? And then, of course, on a day-to-day basis, you might come in with those predicted highs and lows, which again correspond to that short-term daily sort of time frame that you might be working in to make a trading decision.
Here again, really perfect example of this — you see all the price action is bullish on this trading day, but we never hit these predicted lows. And sure enough, you see pushing down and then continuing the uptrend. So, really exciting opportunity here. Chewy’s done really well.
We can look at the overall move here since this got started — there up about 32%. Very similarly to Fiverr, a 33% move over about 30 trading days.

Lastly here, Booz Allen Hamilton Holding (BAH) — one of these cybersecurity firms. Here, you see this blue line crossing above the black line. Again, another great example here — neural index goes bearish, but the trend is still up. So, right — expect that weakness in the short term, but actually be looking to exploit the bullish side of the market.
And of course, you’re going to get an updated predicted high and low every single day. So again, we get these examples — you see these predicted highs and lows telling you, “Look for the market to trade down towards these levels.” And sure enough, down towards about $104, the market gets bid up — and multiple opportunities as we’ve experienced this market strength of, “Okay, well, if you can find an area where you want to focus in, you might not hit that predicted low every single day, but if you’re using this as a guide, you’re likely to get a very good short-term entry.” And can again exploit that opportunity there, whether it be shorter term or the longer-term trend you might be trying to take advantage of.
So again, we can look at the overall move here in BAH — about a 22% rally just over the past 36 trading days. Again, we’ve got earnings coming up here — so potentially a lot of volatility into next week.
So, we’ll go ahead and leave it there for today. But again, really great opportunities out there. And if you haven’t already, make sure you go ahead and click on that link down in the description. Get signed up for that live demonstration.
So once again, this has been the Hot Stocks Outlook for May 23rd, 2025. Thank you all for watching. Best of luck, and bye for now.


