


Register for a Free Live Training
Hot Stocks Outlook uses VantagePoint’s market forecasts that are up to 87.4% accurate, demonstrating how traders can improve their timing and direction. In this week’s video, VantagePoint Software reviews forecasts for SPDR SPY($SPY), E.L.F Beauty ($ELF), Zoom ($ZOOM), OKLO ($OKLO), Salesforce ($CRM), Uber Technologies (UBER)
VantagePoint A.I. Hot Stocks Outlook for May 30, 2025
Hello again, traders, and welcome back to the Hot Stocks Outlook for May 30th, 2025. I hope you all have had an excellent week out there in the financial markets. As always, we’re here to take a look at the most recent VantagePoint A.I. predicted forecast. So if you haven’t already, go ahead and click on the link down in the description below and you can get signed up for a live demonstration and learn all the specifics about how these predictive indicators and technologies are helping traders make much better trading decisions out in the marketplace.
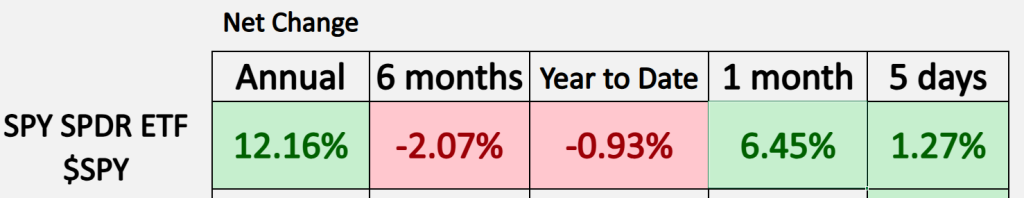
Now, each week what we typically do is take a quick look at the S&P 500 via the SPY ETF, and this gives us just a broad-based view of where the market has been over these bigger blocks of time. And so we can see here that now, year-to-date, we are back down below, even down about 1%. We’re still up about 6.5% over the last month, but that’s been a highly correlated rally—a lot of stocks doing well—and this is really what we’ve identified with VantagePoint, right? There’s a lot of markets doing well. We can really pinpoint individual opportunities and then use the predictive forecast to manage those opportunities as we move forward in through time.
So let’s go ahead and go back to the charts here and really highlight how all of this works.
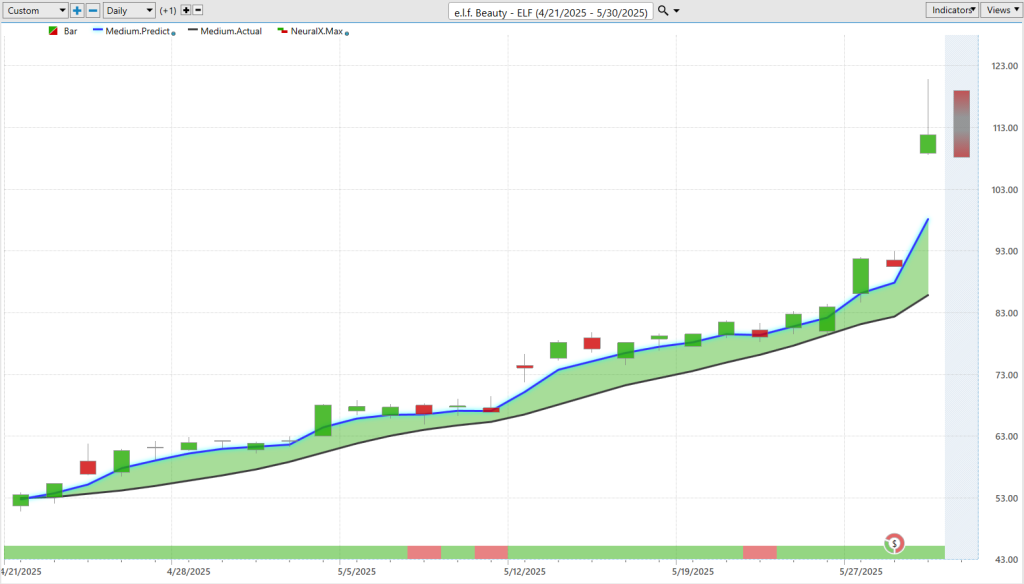
Together, we have a great example here in ELF Beauty. What we need to understand is that all of these predictive indicators and tools work the same—whether we’re doing it on this forecast or Salesforce or Uber or some of these subsequent charts. What we’re seeing here is daily bars and candles. So each one of the candles on the screen—that’s going to represent a full and complete trading day.
The first thing that’ll jump out at you is, right up against that price data, there is a black line and also a blue line value. The black line that you’re seeing there is actually a simple moving average—or what we refer to as the actual simple moving average. In this case, it’s a 10-period, so it would look at the previous 10 closes, add those all together, and then divide by that number.
One of the weaknesses with traditional technical analysis like that is that all the data that generates that value—and most technical analysis indicators—comes from the past. Additionally, it only looks at one market in isolation, as if the markets aren’t driven by some of these larger ETF groups or the value of the dollar index or other individual stocks that share important price clues as to where things are headed next.
Whenever we see that blue line, this is VantagePoint’s proprietary predicted moving average. For this number to get generated and plotted on the chart—which again we can think of this as an average price that’s getting forecasted beforehand—this is where VantagePoint’s technology of artificial neural networks comes into play. They’re performing what we would call intermarket analysis. Rather than just looking back at past prices, what VantagePoint’s tools are able to do is understand how other markets are driving and influencing the future price of, in this case, this asset—ELF Beauty.
This can be a wide number of things. It can be individual stocks that share not only positive correlations but potentially inverse or leading and lagging relationships. Neural networks are expert at taking huge amounts of data, really finding the significant relationships. But it goes all the way through the board—through individual stocks into important ETF groups that wrap up a large part of the market. It can go down to currencies and global interest rates, and even things like global commodities where applicable—where we have gold mining stocks and energy producers. So it takes this approach and really analyzes how other markets are driving future prices and uses that data to generate highly accurate predictions about where price is headed next.
Whenever we see that blue line cross above or below—in this case, above—the black line, it’s suggesting that those average prices are going to start moving higher. We really get this effect of all of these intermarkets weighing into that prediction. When we have a lot of other markets that may be driving and influencing bullish nature in ELF Beauty, it’s going to skew this indicator to the bullish side and offer a very early signal of where those prices are headed next.
So what we can see here very plainly is: as that blue line crosses above the black line, we expect prices to go higher. We’ve never moved below the black line. We’ve had a consistent rally here—about a 103% rally over 27 trading days. Again, highlighting that you want to identify those markets where we’ve seen this blue line cross above the black line—a lot of strength—but again also identify where that is persisting, where we actually are still in an uptrend and haven’t seen things reverse. This is what allows traders to really adapt to those changing market conditions.
That’s the VantagePoint predicted moving average—it really helps VantagePoint traders identify the overall trend direction. But there are other tools here to solve other problems, and again these are all driven by that neural network calculation but tuned to solve different problems.
So if you look at the very bottom of the chart, you see this bar here that goes from green to red, back to green. This is the VantagePoint proprietary neural index. What this does is anticipate short-term strength or weakness in the market over the next 48 hours. So this—unlike our predicted moving average—is a very short-term strength or weakness indication and can alert traders to potentially those buy-on-the-dip scenarios, especially in markets where you may want to be looking to take a bullish position. This has a very high level of accuracy—upwards of 80-plus percent of getting that right on whether we’re going to see those prices move higher or lower.
You see as we get this predicted moving average crossing above the actual moving average, you have a lot of strength from that neural index. That momentum in the market persists until about here, where you see the neural index goes bearish. You get a couple days of sideways price action, and then the trend resumes. Again, here you see the neural index gets bearish—you actually have a kind of normal day here, a gap down, really trading at about the same prices—before we get that move higher. You actually see that before then, the neural index flipped back to bullish and we start to see the market advance.
So, really nice tools here to help traders not only with the overall trend but short-term expectations so they don’t get sort of bucked out of an opportunity on some short-term weakness. What’s really exciting about this is: every single trading day you’re provided with the next day’s predicted high and low.
You see here that you have this—what we might call a shadow candle—and what that is is predicting essentially today’s predicted high and low value. What we can do is look back and say, “Okay, well how accurate have all of those predictions been before the trading day?” So what’s going to occur here is we’ll get the actual trading day—we’ll fill in here—and we’ll see how accurate that predicted high and low is.
But each week what we can do is come back and say, “Okay, well how have these indicators and tools performed?” Once you identify that the overall trend is up, you’ve got that momentum from the neural index—well, this is where traders can utilize that predicted low. You can set limit orders, you can have your live charts or alerts open for when you get down to some of these price levels. But you see how early on in the trade you’re getting excellent entries into this uptrend—about six opportunities where the market moves down to the predicted low. Within a day, it starts to trade higher. Then we see as we get this gap up and more volatility, the software does a great job adapting.
That’s a very important quality here—understanding: hey, how is volatility changing? How are the daily ranges changing? And how is that going to affect how you should participate in the market?
So again, we see here even after this trading day, you see that predicted high and low slanting lower—and sure enough, you get a day where pretty much the entire range slants lower a little bit, offering up some great levels to participate in the market. You see about four or five entries here. On days like this, you actually would get filled at the open if you have a limit order waiting in the market. Then we get this really strong advance through earnings, which really propels the move here.
So really nice opportunity here in ELF, but a great example of how regardless of the markets you’re trading, you can utilize these tools and approaches to get an edge on the market, get good positioning, and add these opportunities to your portfolio with a small amount of risk.
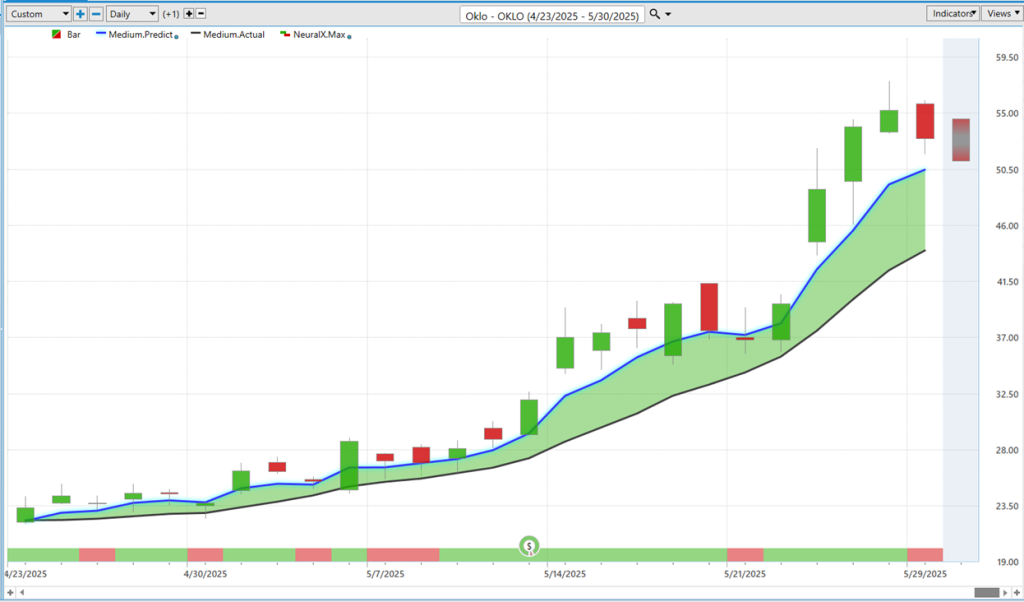
Here’s an opportunity in OKLO. Again, we can see that predicted moving average crossing in this period around April—at the end of April—that blue line crossing above the black line. Now, earlier here you see the neural index going bearish and we sort of run sideways, get a little bit of choppy price action. But again, let’s look at those VantagePoint predicted highs and lows…
But again, let’s look at those VantagePoint predicted highs and lows. Every single trading day—again, before the trading day occurs—you see what’s happening here. We’re getting a slant lower here as far as the predicted high, the range coming in lower. But previously, well what have we had? These predicted lows offering this guidance that say, “Hey, if you want to be a buyer in this market, look down towards these levels.”
Weeks like this are really exceptional. You see here that you’re getting a lot of noise—but do you want to be trading on this day or this day? Wait for those opportunities and those great levels to come through. You see you’re getting a much better price over that, you know, about seven- or eight-day period before we get this next advance. What that can allow traders to do is have that nice entry where you don’t have to risk a lot to participate in the market.
We get this again—continued advance here in shares overall. Again, really nice move here as well. We can see the move—about a 133% rally over 25 trading days.
If you watch these Hot Stocks Outlooks week to week, you’ll probably notice that we’ve been talking a lot about just bullish opportunities week after week after week after week—until last week. We started to see a little bit of softness and weakening in the market among a lot of different individual stocks.
We can actually use these tools collectively with features like VantagePoint’s IntelliScan. So we actually get a scan that will identify, “Hey, where are these fresh opportunities and crossovers happening?”—whether they be to the bullish side or potentially to the bearish side.
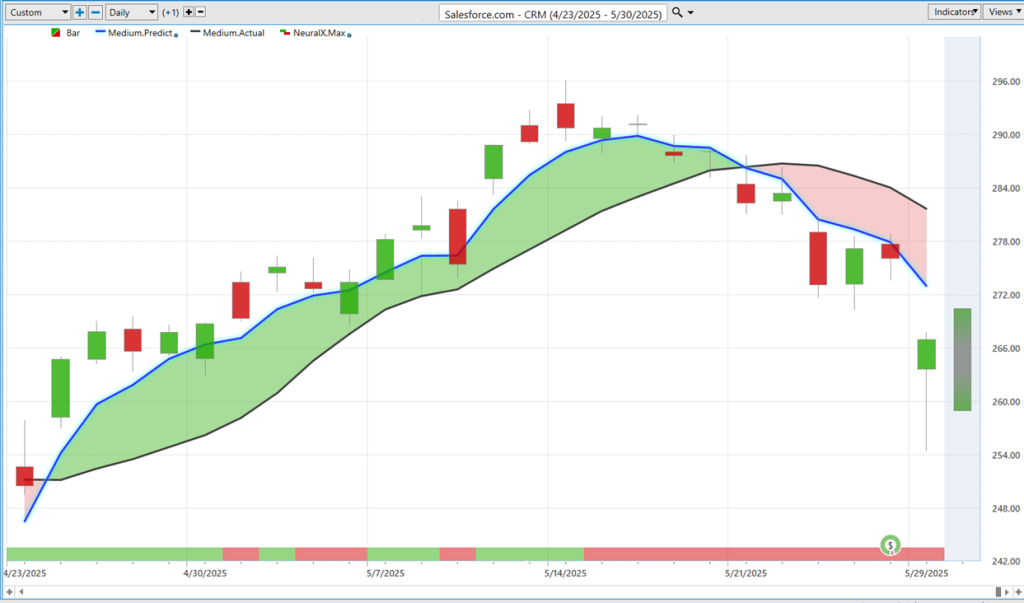
Here we see in Salesforce.com, we have a strong move again here towards the end of April. Again, a strong correlated move as far as stocks are concerned. But what have we seen more recently? You see this blue line crossing below the black line—this is actually coming through last week. Again, using that same approach of, “Well, where would be a good place to potentially short or certainly take profit if you still have any longs in the portfolio?”
You see up here at this predicted high level—we can see we’re far away from there now—but that was a predicted high of 286. The market had gapped down, and it’s trading around, you know, the 250s recently here. So a really strong move to the downside. This is where VantagePoint traders have the tools to really understand how they want to adjust that portfolio—do they want to skew completely on the bullish side, take advantage of bullishness, or potentially start hedging some of those long positions in the portfolio?
You see Salesforce here down about 7% just in the last five trading days. Again, getting that move over earnings but seeing a warning there as far as weakening.
Additionally, let’s look at this neural index. This has actually been weak coming from the top here—signaling: expect weakness over those subsequent 48-hour periods. That has really persisted all the way through. So sending a pretty strong signal to short-term traders that this is not the opportunity to try to exploit on the bullish side.
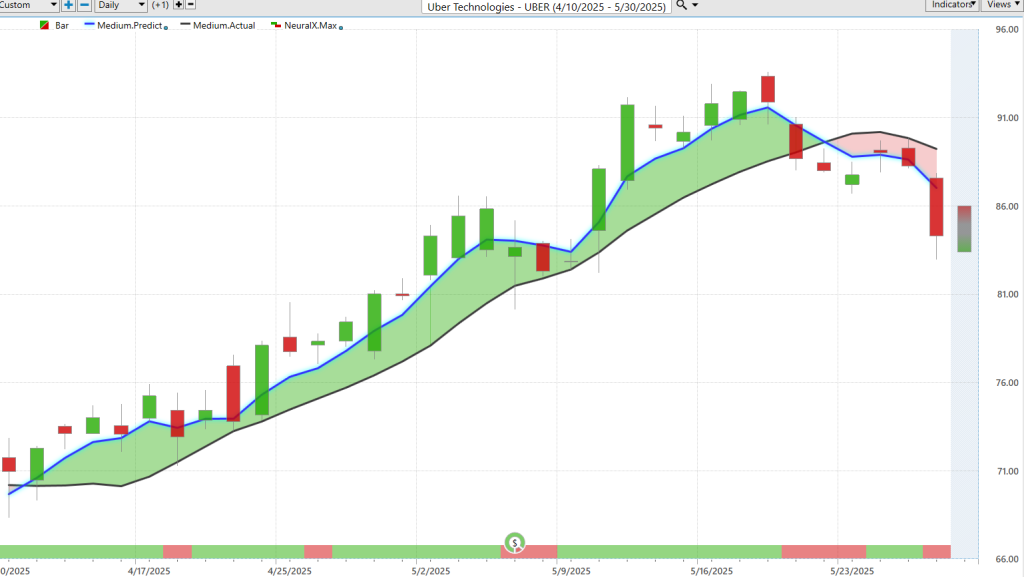
Here’s Uber Technologies, in a very similar situation, where—again—a lot of strength in April after we got those tariff announcements coming off. The market performed extremely well really all the way up until the last week or so. We’re starting to see some cracks here.
You see again that blue line crossing above the black line, neural index very bullish as we go through earnings. But more recently, seeing that crossover to the downside. We can again look at those predicted highs and lows over these periods—understanding that, well, we might want to be buyers over this first couple of months here, but more recently things have shifted to the downside.
So what were great opportunities to be buying down at predicted lows and targeting predicted highs—or adding these things to your portfolio for a longer-term position—has certainly shifted here. We see the market has moved up towards these predicted highs. Again, if you have limit orders and things waiting, you’re just going to get filled at the open.
The market is down about 5.5% here just over the past three trading days. So very important to understand and identify some of these shifts—especially if you’re trading in any of these markets or your overall portfolio may be very skewed to the bullish side—because we’ve seen a lot of strength, right? So it makes perfect sense to capitalize off of a lot of this strength that has come through. The VantagePoint forecasts have been very bullish. But we’ve got to understand when that shift occurs and make those adjustments.
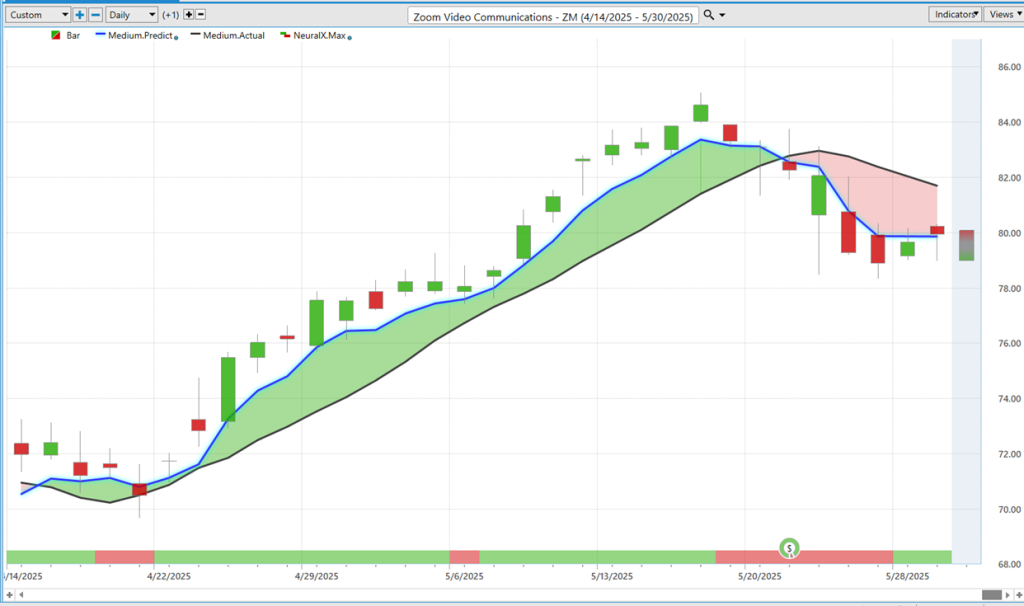
Here’s Zoom Video. This was actually a market we brought through last week. Again, just driving the point home that, you know, really at the midpoint of last week, we started to detect there’s a little bit of weakness here. So traders may want to be prepared to adjust things in the portfolio.
Here’s Zoom Video, really strong crossover to the bullish side. We had this period where a lot of stocks were doing well—even Bluebird was a Zoom Video Communications market that kept bringing in over and over and over again—and it’s the same thing. We’ve recently seen this crossover move to the bearish side that really forces a trader to make some adjustments, tighten up stops, and get defensive.
Again, we can look at these predicted highs and lows, now going really intraday. You see how these levels last week we pointed out as great levels to short. You see more recently, moving up towards the predicted high, but a very dangerous level to be on the bullish side here as we see the overall trend is bearish—at least in shares of Zoom.
So, we’ll go ahead and leave it there for today. Again, just more recently seeing things start to shift and level off—not as just overly bullish as we’ve seen, with almost every market moving into an uptrend. You know, we had earnings around Nvidia and all that, really getting the market excited. But you know, if you’re trading an individual stock, you want those clues that are going to tilt the odds in your favor and help you understand when it’s the right time to get aggressive—and also when to shift.
So we’ll go ahead and leave it there for today. Once again, this has been our Hot Stocks Outlook for May 30th, 2025. Thank you all for watching. Best of luck and bye for now.


