


Register for a Free Live Training
The Hot Stocks Outlook uses VantagePoint’s market forecasts that are up to 87.4% accurate, demonstrating how traders can improve their timing and direction. In this week’s video, VantagePoint Software reviews forecasts for SPDR SPY($SPY), First Solar ($FSLR), Amazon ($AMZN), HF Sinclair ($DINO), Costco ($COST), Hims and Hers Health ($HIMS), New York Time Company ($NYT)
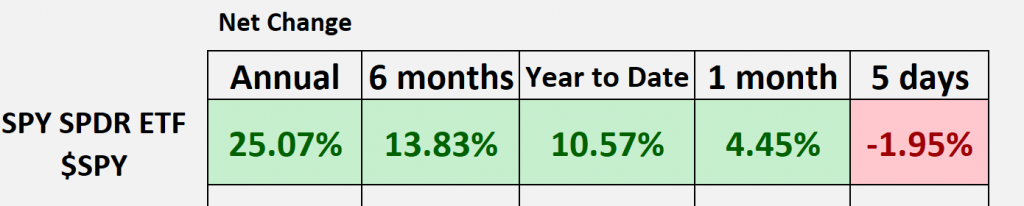
SPDR SPY ETF ($SPY)
Hello again, traders, and welcome back to the Hot Stocks Outlook for May 31st, 2024. I hope you all are having an excellent week out there in the financial markets. As always, we’ve got plenty of opportunities to cover here in today’s Hot Stocks Outlook, so if you haven’t already, make sure you go ahead and click on that link in the description below and sign yourself up for a live demonstration to learn all the specifics about how these Predictive Technologies can help traders make much better trading decisions out in the marketplace.
Now, as we typically do, we’ve got a lot of opportunities to take a look at, but first, we want to start and take a peek at this S&P 500 to get that sense of the broader market. What we can see here is that year-to-date, we’re pushing up around 10-11%, a really nice move out of the SPY, but we are seeing volatility pick up. This is why it’s especially important to be positioned in the right assets, potentially have some hedges in the portfolio that make sure that if we continue higher, we’ve got markets that are doing really well, but you really want to identify those weak spots in the market and either avoid them or set aside, look for cheaper prices later on down the road. Here, so let’s start out with First Solar ($FSLR).
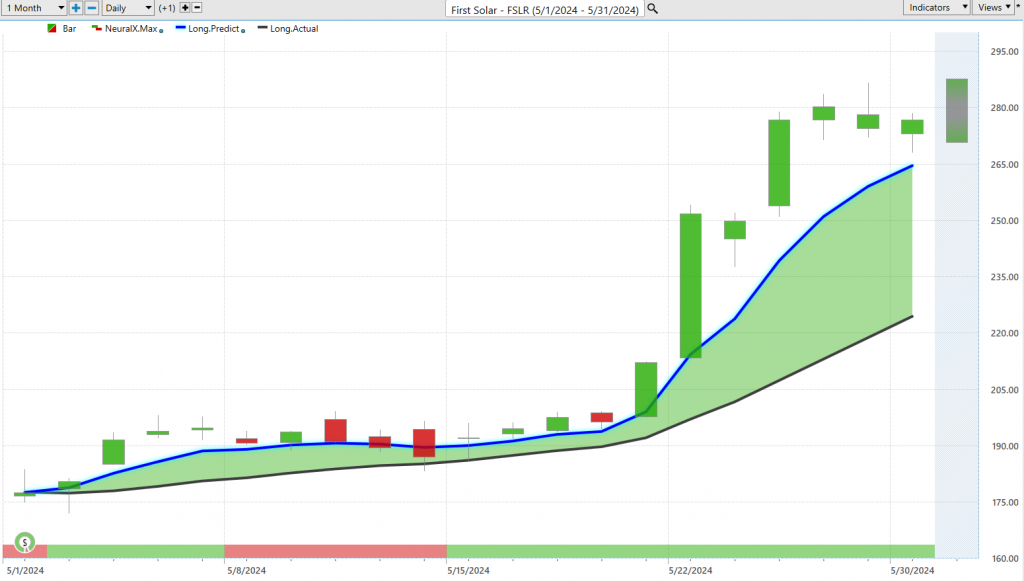
Taking a look at First Solar, all of these examples really use the exact same set of indicators and interpret them the same way. With First Solar, what we have here is daily price action. Each one of the candles that you’re seeing represents a full and complete trading day. Right up against that price data, what you’ll notice is there’s this black line and a blue line value. The black line value that you’re seeing is a simple moving average; this is a very common technical analysis tool. In this case, it’s a 10-period, so it looks back over the previous 10 closes, adds those all together, and then divides by that number, which is a good indicator to let you know where market prices have been.
The problem with technical analysis tools like this, and this is really fundamentally different from how Vantage Point works, is that all of the data for this comes from the past, so it’s always lagging. Additionally, it’s only looking at one market in isolation, so it’s really just summarizing where market prices have been for First Solar and plotting that moving forward. Vantage Point traders are able to compare this lagging, essentially lagging moving average to this blue line, which is a proprietary predicted moving average. For that price, it is essentially calculated and plotted every evening for the trader.
Well, this is where the technology of artificial neural networks is doing their job. Specifically for First Solar, what we’ve discovered here is that there are known market relationships that will drive and influence the future price of First Solar. Now, specifically for this market, it could be technology ETF groups or solar ETF groups, it can be individual stocks throughout the solar space or other technology stocks, or stocks seemingly that aren’t connected but do share a very important statistical relationship here. It’s looking at all of these market relationships, all the way down to things like the Dollar Index, global interest rates, also things like the value of crude oil or global commodities. It takes this global approach, looking at how all of these markets intersect and affect the target market. It uses that data and information and the artificial intelligence to generate highly accurate price predictions.
So, in a sense, you can say that we’re using all of that data from these in-market relationships to really be the data sets used for the neural networks to figure out these problems. So, whenever we see that blue line, in this case, cross above the black line, what is it suggesting? Well, it’s skewing those moving averages to get more bullish, suggesting the average price is going to start moving higher, and you see as that blue line crosses above the black line, which we actually have a lot of great features within Vantage Point. “The IntelliScan feature can identify where those fresh opportunities are opening up, where there’s that one-day cross of the blue line and the black line signaling that uptrend. Now, additionally, we can bring in things like the Vantage Point Predicted Neural Index. You see this bar at the bottom of the chart that goes from green to red, back to green, and the Vantage Point Predicted High and Predicted Low range. So, this goes a lot shorter term, right? The Neural Index at the bottom, that’s a 48-hour indicator, just looking for short-term strength or weakness. Every single prediction you see on the most recent day is only looking out 48 hours ahead, and it does that with a very high level of accuracy, upwards of 86% across a wide number of markets.
And so, when you have that 48-hour forecast as well as a prediction of intraday prices—so intraday predicted highs and lows for the next trading day—what’s going to happen is First Solar will trade, we’ll get the actual market data, but those predictions will stay static. And this is what we look at each and every week: how accurate are all of these daily predictions? When we understand, okay, the market’s in an uptrend, you may want to be a buyer in First Solar. Well, you see on this trading day, you almost perfectly move down towards that predicted low. Here’s another predicted low, predicted low, predicted low, predicted low, predicted low, predicted low… So you see here, there are four, five, six, seven, eight entries, most of those happening before we actually get this acceleration in momentum. But all happening at the very advantageous parts of the very short-term range, right? So, you can accumulate a position, minimize the risk, be prepared for these periods where you might get a little sideways price action. The market runs sideways, but as long as that blue line remains above the black line, and that Neural Index is bullish, well, the short and long-term forecast is bullish.
So again, a really nice opportunity over a 50% move here in just the past 24 trading days, essentially about a month on the calendar, about a 55% rally in First Solar.
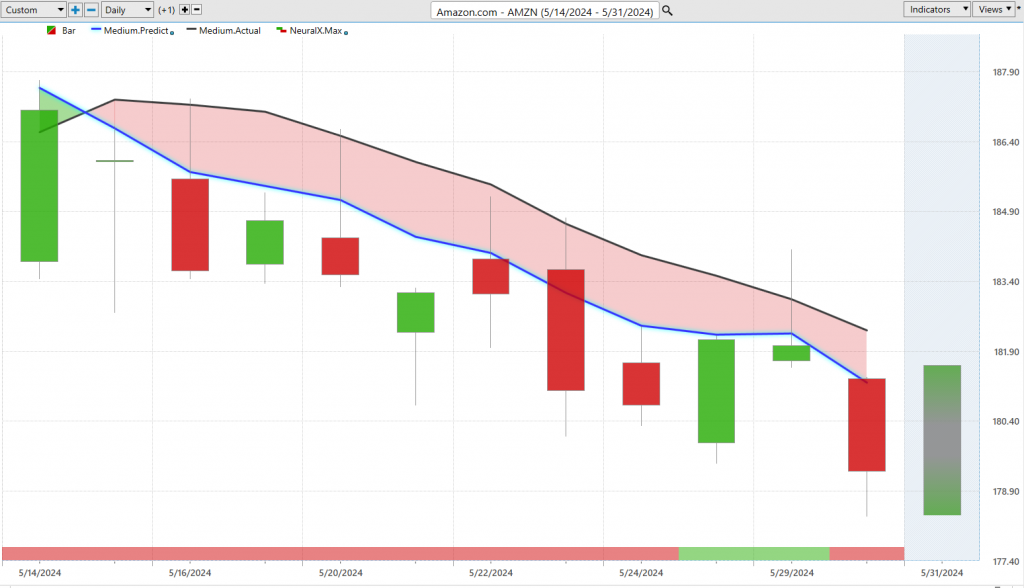
So, I wanted to bring in a lot of this variation we’re seeing in the market. So, we talked about Amazon ($AMZN) last week, right? This is a very popular stock, a lot of trading activity going on here, but what we highlighted last week is, hey, we’ve seen some areas where there’s bullishness. But right here in Amazon, you see that blue line below the black line, Neural Index bearish, and when we update this, well, over the past really four or five trading days—we had a holiday this week—but what have we seen? Well, we’ve seen the overall trend down, the Neural Index got bearish here, and you see subsequent higher highs over the next 48 hours. But now, let’s look at those predicted highs and lows. You see exactly how this works: if you had shorted Amazon back here, great, great, you can take some profits as we move forward.
But going into this week, you know this level is screaming at you that you don’t want to be long intraday or in the overall trend with the price at that level. And we see that what happens with Amazon, you know, and the Dow, right? We get some weakness here, and so we’ve seen really just over two days, Amazon down another two and a half percent. And this is exactly how we want to use these predictive tools to get those good entries, whether we’re short-term or longer-term swing or position trading. Well, you know, what were we forecasting for Amazon this week? Weakness. Well, you know, after this trading day, that would be the high of the day.
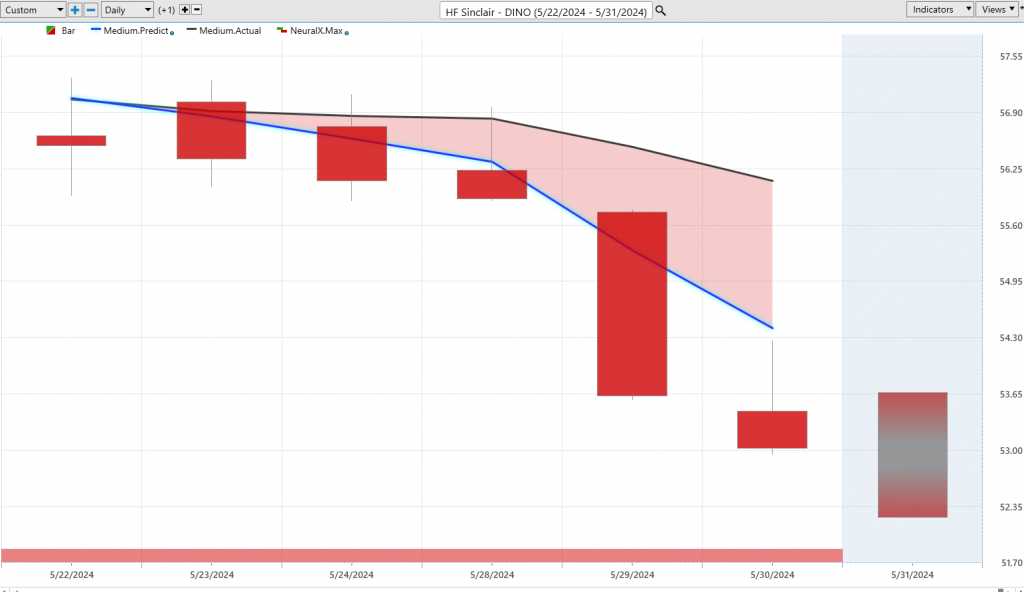
Um, so, you know, it all comes down to using your trading strategy and time frame but leveraging these tools based on what they do well here. Um, so HF Sinclair ($DINO), the energy space, is actually seeing some fresh weakness come in here. And so here’s HF Sinclair, a lot of the oil sector stocks, right? So we see this blue line crossing below the black line again, this being more recent, and look at all this weakness each and every day, indicating that over the next 48 hours, expect the trend to go lower. Use your Vantage Point Predicted highs and lows as potentially levels for excellent price level acceptance. Right, so we don’t quite hit that level there, but you see how we get very, very close, then the market declines again here.
So, uh, pretty nice move here, uh, so far, again, just energy’s weakening a bit here and seeing a lot of volatility around just the commodity markets, but 7% decline here, right? So not a great place to be in some of these oil and gas stocks currently, and not a bad place to hedge the portfolio along with potentially things like Amazon there.
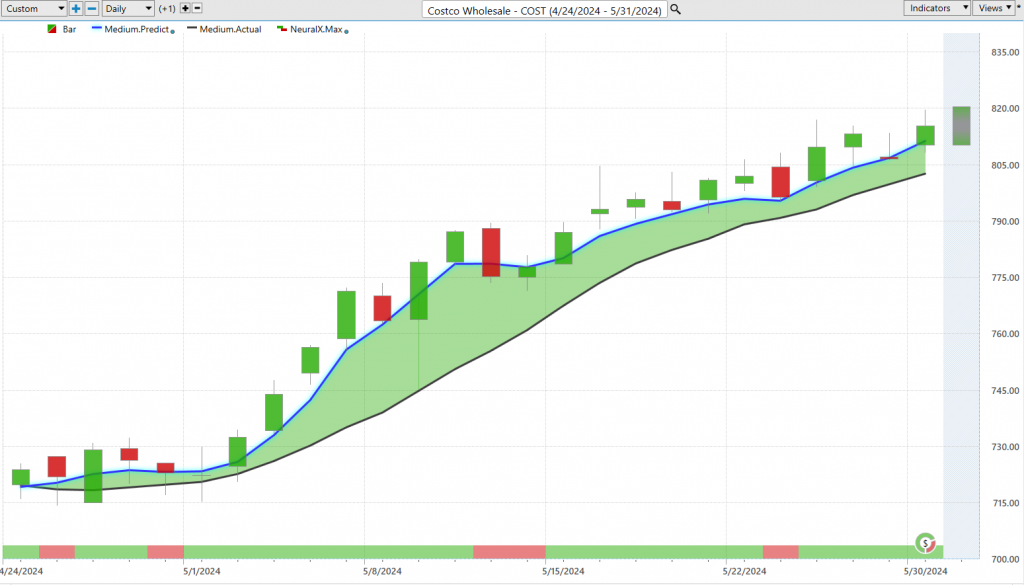
Uh, here’s Costco ($COST), and so just really inversing, you know, things like what we see in Amazon. Well, you see our blue line crossing above the black line, a lot of separation between that predicted average and the actual moving average. And, of course, Vantage Point Traders can say, okay, well, if I’m a short-term trader, okay, the overall trend is up, we’ve got our neural index and predicted highs and lows, and of course, we can use those levels, understanding that, okay, well, you know, we may get periods where this neural index goes bearish and look for subsequent weakness over those 48-hour price levels. But the overall trend here is very bullish, and you know, we want to be buying towards those predicted lows, target the predicted highs, you see each and every day as we come up to these predicted highs and cool off a little bit uh inaday there. So really nice opportunity here in Costco, overall of a move here, uh, getting a really nice move here about 133% rally in 25 trading days.
So again, as we started to see a lot of these markets turn up uh last month and some of these trends doing well, but again you want to identify, you know, the differences, right? Where things are strong and where things are very weak here.
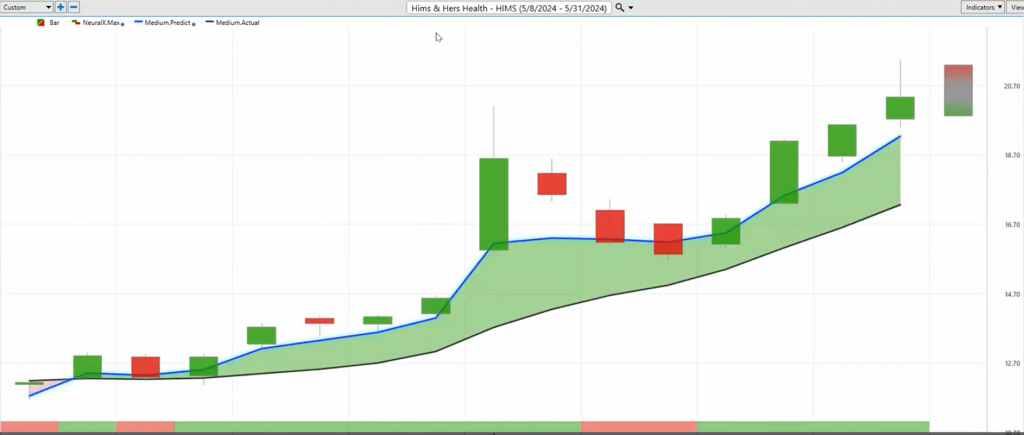
Uh, here’s uh Hims and Hers Health ($HIMS), so Hims and Hers Health getting a lot of attention here, uh, blue line over black line, right, neural index very bullish. We get a little bit of a blip here, flip here, get a couple of days of weakness, but overall, you’ve got blue line over black line, a lot of strength from the neural index, and that’s where you see that momentum really pick up in the marketplace.
So if you’re doing trading in any of these stocks, you want to understand on a, you know, day or two period, hey, do you want to be a buyer? Do you want to be looking for entries? Here’s a 61% rally in the past 15 trading days. Again, even just 500 shares is about $3,800 move.
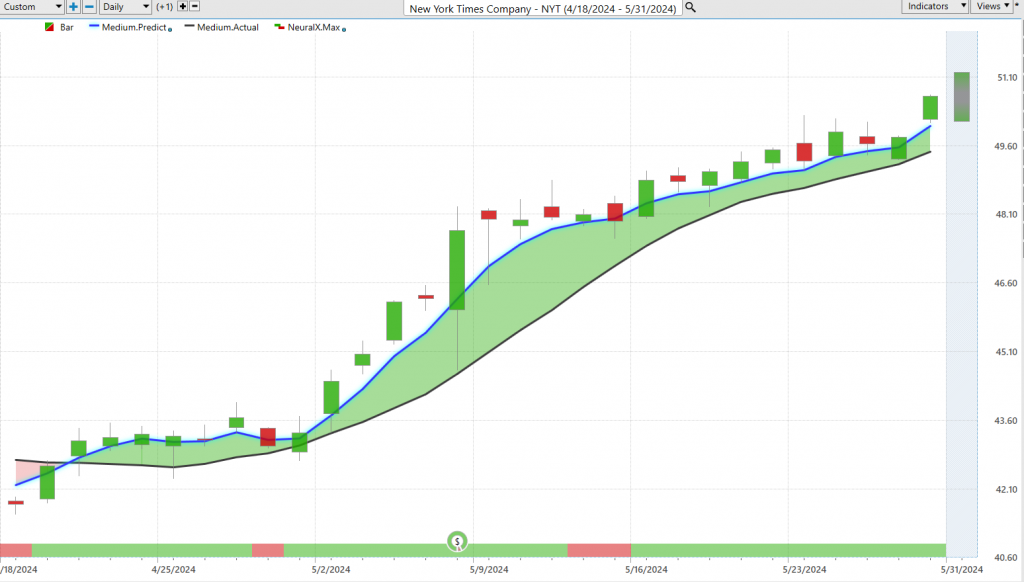
Uh, New York Times Company ($NYT), we’ll go ahead and end here very similarly with these bullish opportunities, very clear signals here, right? Blue line over black line, neural index very bullish. Uh, you see here again, you get these little blips where there’s a couple of days of weakness, but overall, blue line over black line, neural index bullish, that’s where you’re really seeing that momentum pick up. And of course, that’s where you’d want to look towards, you know, for the short-term traders, Vantage Point predicted highs and lows, so scooping up shares down at these predicted levels, and giving you a nice entry as that overall trend resumes.
Uh, so again, really nice opportunity here in shares of New York Times, a very interesting market we have here, right? Things are very, very mixed, you actually have the spy and some of these markets turning lower, uh but some stocks doing well and still in trend. So you know, when we start to see those blue lines cross below the black line in certain areas, you know like Amazon where we’ve seen some of these other warning signs, well you can accommodate that, but you know, in the meantime, we’ve got stocks moving up, you can trail your stops, and these really uh, a nice rallying market, and you’re seeing some pretty impressive moves uh, but you got to be particular about which stocks you’re seeing that in, and that’s where the Vantage Point predictive forecasts are extremely helpful.
So, uh, we’ll go ahead and leave it there for today. Once again, this has been our Hot Stocks Outlook for May 31st, 2024. Thank you all for watching, best of luck, and bye for now.


