


Register for a Free Live Training
Hot Stocks Outlook uses VantagePoint’s market forecasts that are up to 87.4% accurate, demonstrating how traders can improve their timing and direction. In this week’s video, VantagePoint Software reviews forecasts for SPDR SPY($SPY), Blue Bird ($BLBD), Ciena ($CIEN), AMD ($AMD),
Bank of America ($BAC), Levi Strauss and Company($LEVI).
VantagePoint A.I. Hot Stocks Outlook for May 9, 2025
Hello again, traders, and welcome back to the Hot Stocks Outlook for May 9th, 2025. I hope you all have had an excellent week out there in the financial markets, and as always, we’re here to take a look at the most recent VantagePoint A.I. predictive forecast.
So, if you haven’t already, make sure you go ahead and click on that link down in the description below. You can sign up and get a live demonstration so you can learn all the specifics about how these predictive technologies are helping traders make much better trading decisions out in the marketplace.
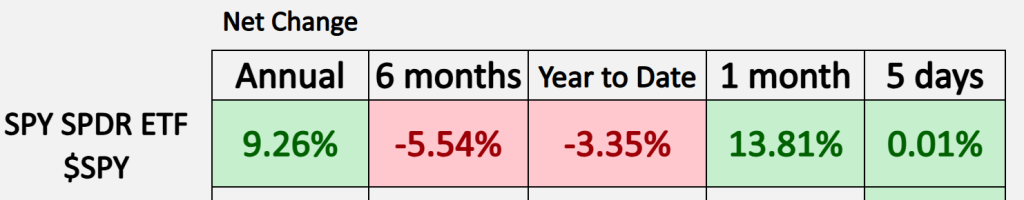
Now, as we typically start out, we tend to take a look here at the S&P 500, just to get a sense of where, broadly, equity prices have been. A couple things really stand out here: we can see year to date we’re still down about 3%, but if we went back an entire year, we’d only be up 9%. But if we went back 30 days—because of all this news and volatility around tariffs—well, you have about 14% just over the past 30 trading days.
This is why, with the recent Hot Stocks Outlooks, we’ve been focusing on: where are the VantagePoint forecasts showing very strong signals as far as our predicted moving average crossovers? That really helps the trader identify where is this strength coming in? Where should that focus and attention go?
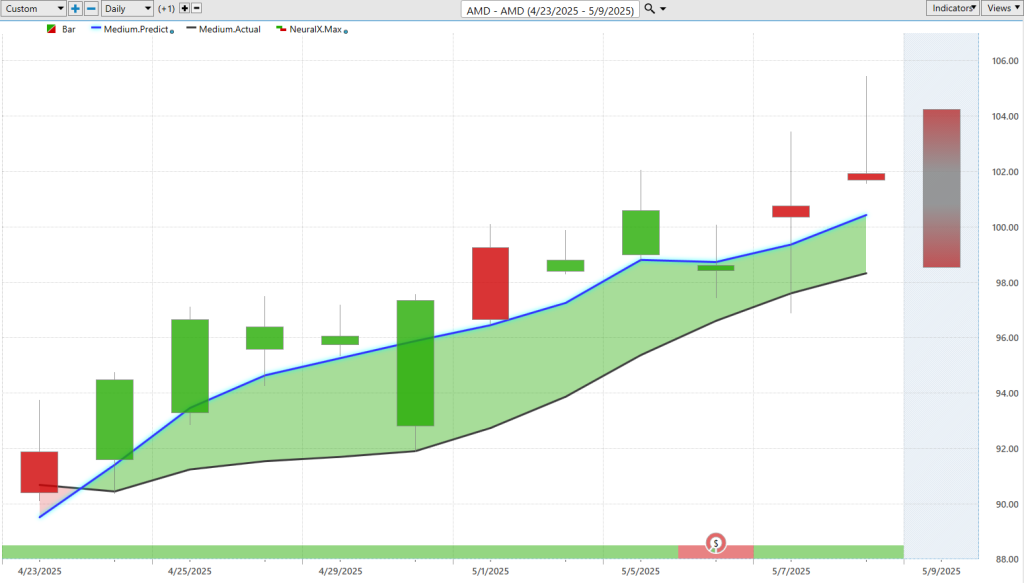
So, a really great example here in shares of AMD of how all of these predictive tools work together for the trader. What we’re looking at here is daily bars and candles. Each one of these candles is going to represent a full and complete trading day. It’s right up against that price data that you’ll first notice that there is a black line and also a blue line value against the price action.
That black line that you’re seeing there—that is actually a simple moving average, or what we refer to as the actual simple moving average. It’s a simple moving average that, in this case, looks back over the previous 10 closes. It’ll add all those values together and then divide by that number. For VantagePoint traders, this acts as a baseline, letting us know where market prices have been.
What we can do is compare that to the proprietary predicted moving average—this blue line that you see on the chart. For this number to get calculated, essentially a price to get plotted and calculated on the chart every evening, well, this is where the technology of artificial neural networks comes into play.
They’re performing what we would call intermarket analysis. This is very important for shares of something like AMD. You know, AMD is not just driven around by the previous closes of AMD. It can be driven by things like the Q’s or, potentially, technology ETFs. It can also look at other individual stocks like, you know, Nvidia or Intel, some of its competitors. But it’s also able to find important market relationships between markets that you wouldn’t assume there’s a relationship, but it’s able to pull out those price clues and use it to your advantage to produce this highly accurate forecast.
This goes all the way down the line—it could go to stock index futures, it could go to global interest rates, depending on the market. It may even look at commodities like gold, silver, wheat market—depending on, again, applicably, where the intermarkets have identified an important market relationship. So, it takes this global approach, and it’s using all of that data with the help of these artificial neural networks to generate what are essentially price predictions with a very high level of accuracy.
So, whenever we see this blue line cross above the black line, well, that’s VantagePoint suggesting that these average prices are going to start moving higher, and traders may want to look to take a long position. What’s great about this is we have all of these features within VantagePoint to actually identify these fresh crossovers as they occur. It’s called the VantagePoint Intelliscan feature.
Regardless of what criteria the trader is looking for—for shorter-term day trades, longer-term position or swing trades—you have all the tools here to really identify these opportunities and, more importantly, adapt as the market moves forward.
So, a really great trade management tool—once you get into a market, well, you want to know, “Hey, where should I be buying more? Where should I be taking profit?” This is where these subsequent tools we’re going to talk about here really help traders.
Now, if you look at the very bottom of the chart, you see this bar that goes from green to red back to green. This is also utilizing that technology of artificial neural networks, but I always like to say that it’s tuned to solve a different problem. This problem being short-term strength or weakness over a 48-hour period. This is where VantagePoint’s very high accuracy statistics come from. We get this right about 80+% of the time on a very wide range of markets.
So, when we see we get that predicted moving average crossing above the actual moving average, when that neural index is bullish, you tend to get some price momentum in the market. Now, in addition to not only the overall trend forecast but a short-term forecast, you also get the VantagePoint predicted high and low. So, before every trading day, you’re provided this range of where these extremes in the market are likely to be. This is what helps traders with entries, limit orders, profit targets—again, applying that information to how you like to trade.
As we look back at all of these predictions, you can see how accurate all of these forecasts are. What’s interesting about this is: you see that we look back, and what’s going to happen is we’re going to get the actual price data filling in, but those prediction levels will remain the same. So, you see, as this market started to get moving—excellent opportunities down towards the VantagePoint predicted low. If you have an order waiting, you’d get filled at the open there and then immediately trade higher towards these predicted highs.
So, really nice opportunities even here, two days ago, moving down to the predicted low—what would have been on Wednesday—and seeing a nice advance up to $105 a share. This is what’s very interesting: we got these lower predicted lows here really warning traders that, “Look, we may get a little bit of a pullback, but the overall trend is still very bullish here.” As we look at AMD, we can see that again, overall, really nice move, and broadly, markets have done well.
So, when we’re looking around at the tech stocks, looking at the NASDAQ, this is where we see a lot of strength. We’ve highlighted this separation over this period—how strong is that prediction against the actual moving average?
So, let’s move forward with that information, and I’ll actually come back first, and we’ll review some of these markets that we’ve looked at in previous Hot Stocks Outlook.
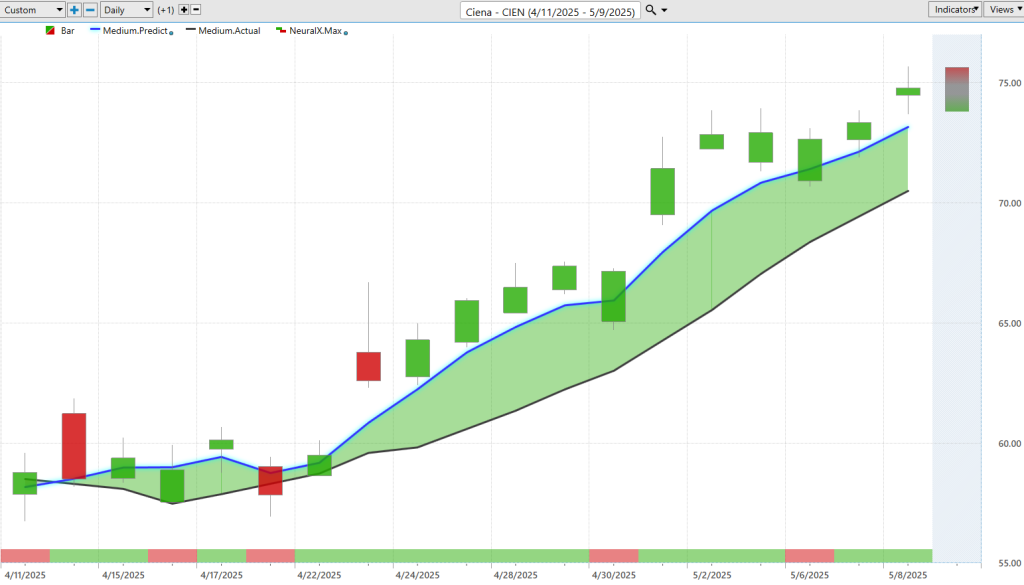
So, here’s Ciena Corporation. This is another opportunity where, again, recently we’re saying, “Look, there’s a lot of separation between that predicted moving average and the actual moving average.” A lot of strength from the neural index. You see, as this blue line originally crosses above the black line, you may get these periods of sideways price action, right? Notice the neural index goes bearish—we get a little sideways price action for a couple of trading days—but overall, the trend very, very bullish.
We can look at those VantagePoint predicted highs and lows. You see multiple levels here offering up opportunities for the trader to get involved in the market. This past week here, you see this would have been Friday—well, actually that would have been Monday, Tuesday, and now we’re going into Friday here. So, really highlighting that, “Look, this is an area where there’s strength in the market.” Even through that Fed announcement, we’ve had some persistent strength here. It’s about a 4, almost 5% rally just from last week’s most recent VantagePoint predicted lows. So, really nice opportunity there as we see tech stocks do very well.
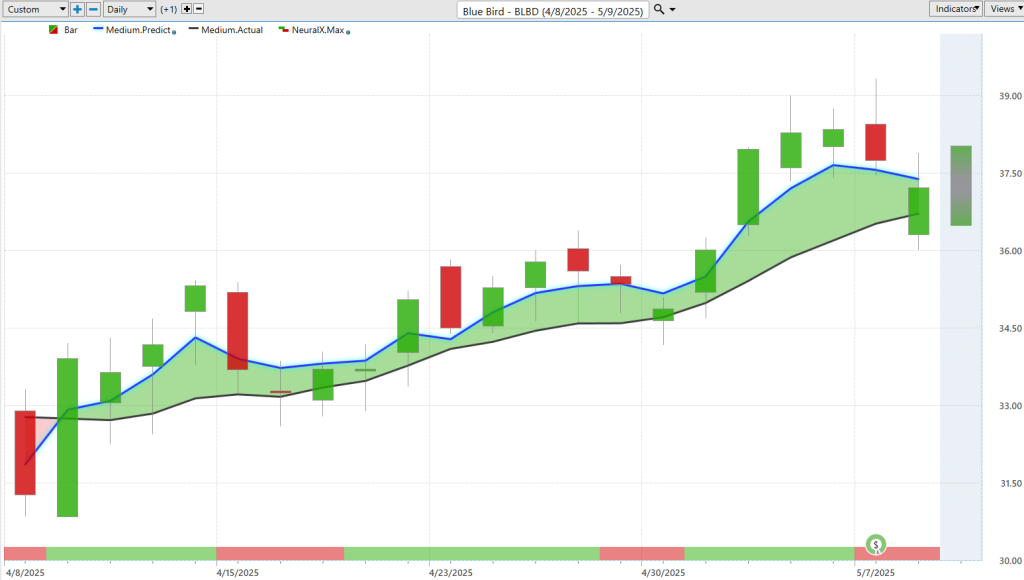
Now Blue Bird, here—really interesting. Now, we just had earnings, and that’s always going to add some volatility to the chart. You see the market gap down but then traded up in the direction of the overall trend. This is a stock that I originally brought through right after we got all that strength from the tariff announcements being taken off.
So, what we were highlighting is, “Look, here’s a strong crossover to the upside.” There’s a lot of separation between that blue line and the black line, and as long as that blue line remains above the black line, well, in this case, you could exploit the bullish positioning.
You see here how many opportunities where the market has moved down towards these VantagePoint predicted lows. As a trader looking to do either short-term or potentially longer-term trading in the market, these are the areas where you want to be scooping up shares. You see that even with that move around earnings, your entries down here, well, haven’t even gotten close to being affected yet. So, it gives you the opportunity for not only the short-term trades but also that long-term positioning should those trends continue.
So, really nice opportunity here in Blue Bird. Pulled back a little bit from its highs, but this is a 12, almost 13% rally in the past 20 trading days. Over this period, it’s been up almost 19% in 19 trading days.
This is a very important area where we say, “Okay, well, VantagePoint forecast and the Intelliscan are identifying this reversal of trend.” We’re seeing the persistence as far as that blue line remaining above the black line, and you see that as you get more and more strength, well, it just sort of plays out here where you saw that original strength holding up for quite a long period of time. Again, really nice opportunity there in shares of Blue Bird.
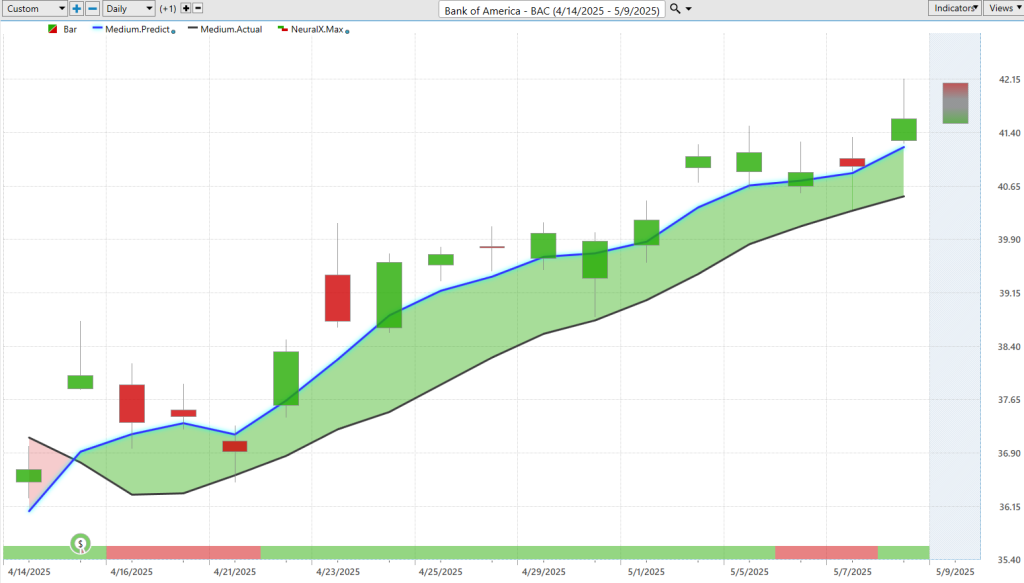
More traditionally here, here’s Bank of America. It’s a very popular stock. Very clearly here, back in the middle of April, crossover to the upside after earnings. You see that the neural index gets bearish here, and you get weakness for the next 48 hours. But look at that separation between the predicted moving average and the actual moving average. It’s a very strong market. We get a little bit of a blip here in the middle of this week, but very clearly an area where you want to be a buyer. Also sends you some valuable information about, “Hey, what’s going on with financial stocks?”
So, there’s a lot of opportunities throughout financial stocks that—as Bank of America moves higher—a lot of other banking stocks will move in the same way. You can hone in with your VantagePoint forecast on, “Hey, where is the best place to go ahead and exploit this opportunity here?” So, Bank of America shares up about 12% just in the past 16 trading days.
Levi Strauss and Company($LEVI)
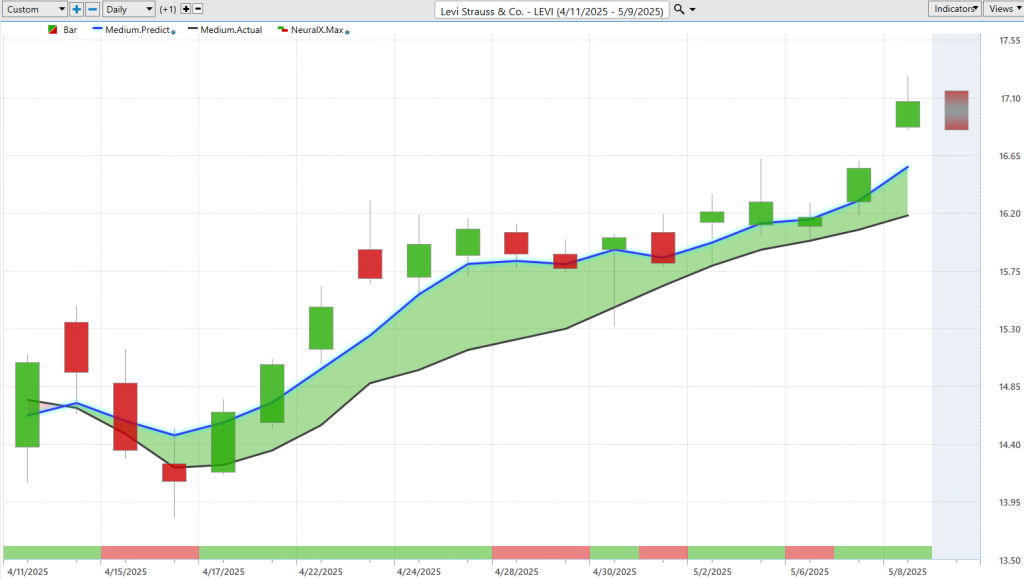
And lastly here, a little bit going on within retail. A lot of stocks that really got hammered because of tariffs—well, we’re starting to see this blue line cross above the black line. This is what’s so interesting about this: notice that that blue line crosses above the black line, and look at the next day’s predicted highs and lows. Where I bring these up, even with all of this volatility, it’s warning you, “Look for the market to come back down here,” right?
Even after this trading day, it’s warning you: expect prices all the way down at these lows a couple of days later. Sure enough, those are where these excellent entries are, and then the trend really starts to take off as we settle in. You see, it does a great job of adapting and saying, “All right, all right, we’ve gotten a big rally. Well, how are things shifting moving forward? Where are those levels for the trader to get involved?”
You see about five entries just in the past couple of weeks here as shares of this market advance. So, really exciting opportunity here in Levi, and it gives you a little information—again, just like financials—about the space: that there is some bullishness here. We are seeing bullish forecasts—about a 16% rally in 18 trading days on shares of Levi Strauss.
So, really nice opportunity spread throughout the marketplace.
We’ll go ahead and leave it there for today. Once again, this has been the Hot Stocks Outlook for May 9th, 2025.
Thank you all for watching. Best of luck, and bye for now.


