


Hot Stocks Outlook for the Week of
November 13th, 2020
The Hot Stocks Outlook uses VantagePoint’s market forecasts that are up to 87.4% accurate, demonstrating how traders can improve their timing and direction. In this week’s video, VantagePoint Software reviews forecasts for Steve Madden (SHOO), Denali Therapeutics (DNLI), Baker Hughes (BKR), New York Times Company (NYT) and PBF Energy (PBF)
Register for a Free Live Training
This Week’s Hot Stocks Outlook
Hello again, traders and welcome back to the Hot Stocks Outlook for November 13th, 2020. Hope you all are having a excellent week out in the financial markets. And as always, a lot to cover in today’s Outlook. So we’ll start out here with shares of Denali Therapeutics, really been looking at a lot of the different pharmaceutical biotech stocks over the last few weeks. We also have New York Times, Baker Hughes, and PBF Energy. So a couple of energy stocks to take a look at that sector. And then Steve Madden, which we looked at last week and identified some trending conditions there.
Denali Therapeutics (DNLI)
But starting out with shares of Denali Therapeutics, a really good example of how these indicators work on any market, regardless if you’re trading stocks, commodities, ETFs. And what we have here is daily price data. So each one of these candles represents a full and complete trading day. You’ve got the high, low, open, close prices there. And right up against all that price data, you’ll see that there is a black line and also a blue line there. Now, the black line that you see there is actually, it’s a simple moving average. We refer to it as the actual simple moving average. And that’s a very common technical indicator. And what it does is it looks back over the previous, let’s say, 10 trading days, add all those close prices together, divide by 10, you get a rolling moving average of where market prices have been. And the problem with solely utilizing tools like that is they act as a good measure of where market prices have already been. But of course, as a trader, you need to know where are things moving next so you can be ahead of that move.
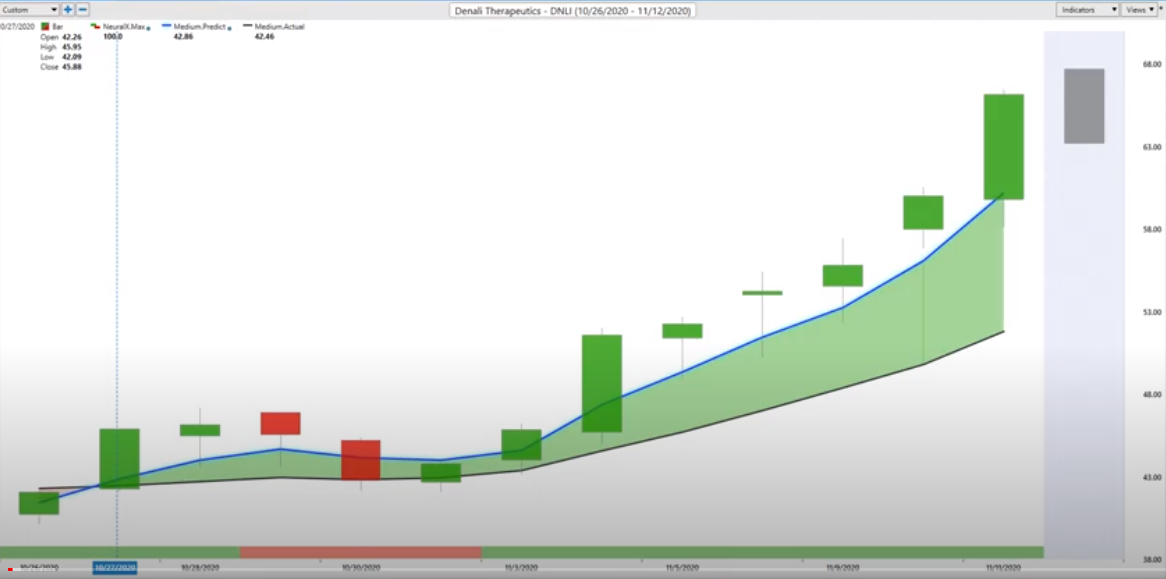
Denali Therapeutics
And so what we’re able to do is actually compare that black line, that value on the chart of that simple moving average of where prices have been, and we compare it to this blue value. And so for that line to be calculated, that value each and every trading day, VantagePoint is utilizing the technology of artificial neural networks. And it’s doing what’s called intermarket analysis and it uses this approach to really produce a predicted moving average. So a forward-looking predictive tool, letting us know where things are headed next.
Now, to really break apart what does that mean, intermarket analysis, well, what that means is, specifically for Denali Therapeutics, the technology has identified markets that share very strong correlations. There’s going to be positive correlations, negative. There can be leading or lagging relationships. Now, in many markets, you’re going to see big things, like the E-Mini S&P 500. You’re going to see things like the Dollar Index, global interest rates. But there’s very important relationships and often subtle relationships in things like ETFs, also individual stocks. And what the software does is understand those market relationships, learn how those markets are affecting the target market in this case, and actually generating predictions. So true predictions, things that haven’t yet occurred.
And what it does is it takes those predictions and builds them into the value of these indicators, turning what was a lagging indicator that looks at past price data into a actual forward-looking predictive tool. So rather than having indicators that, again, are victims of past price, really get dragged around by what’s already occurred in the market, we have this weighting that allows to really cut out the lag time associated with moving averages. And also, we have these other indicators you see at the bottom of the chart. You see this line that goes from green to red, back to green. This, as well, gets updated each and every trading day. And this is a true prediction in that it’s looking ahead 48 hours. So two trading days. You can think of that as two candles on the chart. And forecasting short-term strength or weakness over the next 48 hours.
And in addition to that, you’ll see you also have a predicted trading range here. So a predicted high and low. Comes in at 6:00 PM Eastern Time the night before, going into the next trading day. So you have all the information you need to identify the overall trend direction, whether there’s short-term strength or weakness, and also what levels are appropriate to accept positions and entries into the market.
So what we can do is say, okay, well, as long as that blue line remains above the black line, the overall trend is up, but we can take a look at how accurate those daily predictions are. And what’s going to happen here is we’re going to have a candle fill in and see how accurate that predicted high and low is, but we can look back and see how accurate previous forecasts were. And this acts as a really good tool to really limit the amount of risk you have to take in the market and understand, okay, well, if we’re at an intraday low and I’m in an overall uptrend, factor that in. And just, depending on that overall trading style, whether you’re a day trader, swing trader, whether you’re trading instruments like options, you really have a accurate forecast moving forward of what to expect.
And you see here that we have this neural index, and you’ll see this with these subsequent charts, really helps you understand when there’s some temporary weakness in the market. But as long as that blue line, again, says the overall trend is up, you want to hold onto that long position, or keep expressing that bullish position, as far as your actual position taking in the market here.
Here in Denali Therapeutics, and again, we’ve seen this in a lot of biotech pharmaceutical stocks, some doing very well and some doing very poorly. And that’s where having a hedged portfolio can really come in and be effective. Here you see a 53% rally in just the last 12 trading days. 500 shares. They’re on a fairly cheap stock. Have move up about $11,500. Now, last week, we looked at a couple markets where there was some weakness and we still have a little out here.
New York Times Company (NYT)
So here we have New York Times Company. It’s very clear, of all the markets to be long over the past few weeks, even with that tremendous rally we had at the beginning of the week, here we have New York Times crossover to the downside. Neural index very bearish here.
You’ll notice you get these days where the neural index goes bullish here. You see you get a gap up. You get some higher highs over the next couple of trading days, but the overall trend is still very much to the downside. And you’d only want to go ahead and short that market, take profits on shorts. And what’s really nice here, as we go ahead and, again, can look at these predicted highs and lows, and there’s going to be these times where you get volatility and move a little bit outside of these ranges, but you see how the market, even when a day like this, where you come way outside the range, wants to come back all the way in and move back into that trading range. Before the market, again. Moves a little bit lower here.
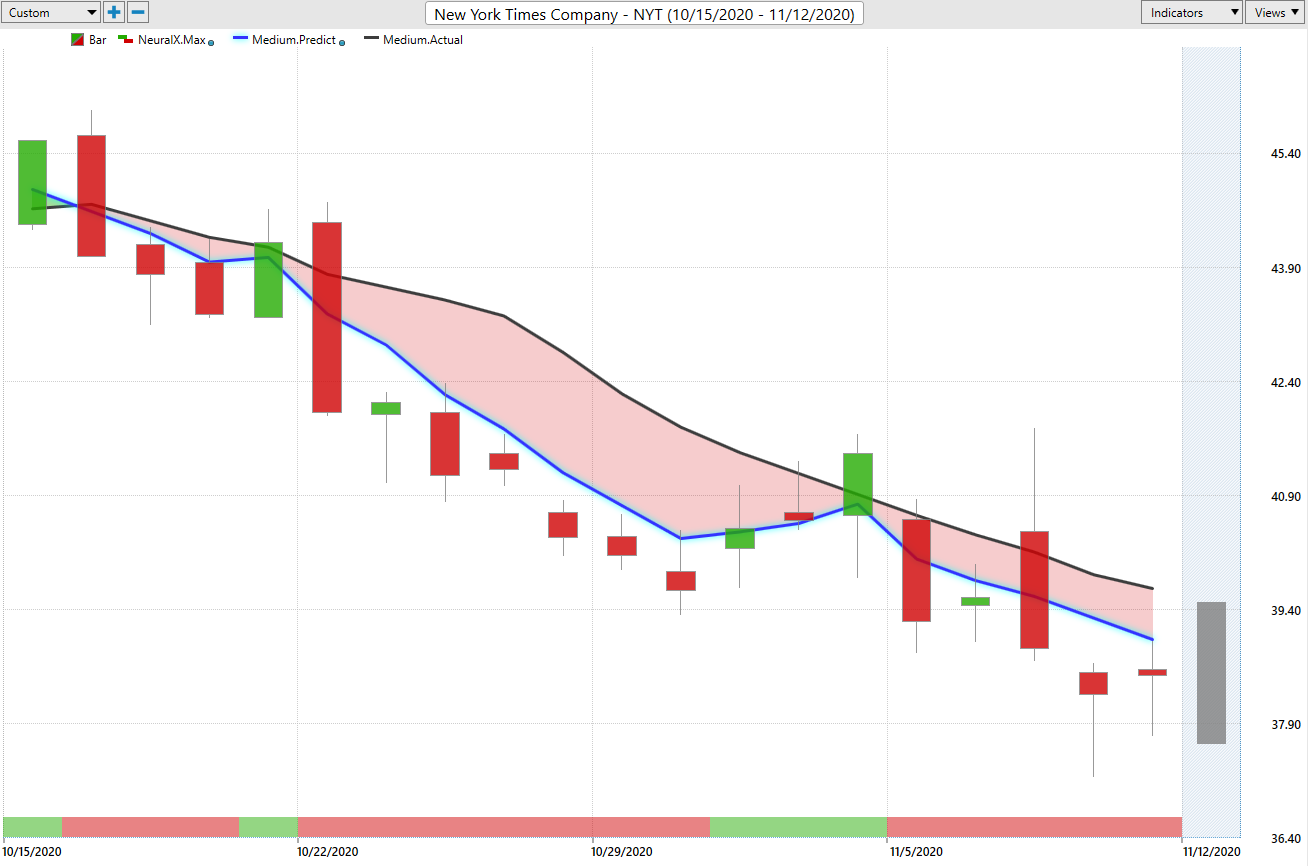
New York Times Company
And again, getting these clues from the neural index, a little bit of strength coming in, but the overall trend being very, very bearish here. And the last thing you’d want to be doing is, again, trying to take long positions where there’s clearly other places in the market where there’s a lot more strength, like Denali Therapeutics, and like some of these energy stocks, which we’ll go ahead and get to here shortly. But a 13% decline over the past 16 trading days. Really nice place to, again, hedge that portfolio. There’s places to go long, really benefit, when you get that huge move in the higher and the S&P 500. But that’s not happening everywhere. And then when you have that hedged portfolio, you not only have places where you can make money on both sides of the market, but likely benefit from those areas where the bigger move, as far as the broader markets, take things.
Baker Hughes (BKR)
Now, this has been pretty interesting with energies recently. Shares of Baker Hughes here, we actually have had a crossover for a long time here, going back to October. You see that blue line moving above the black line, maintaining that position, going all the way now, pretty much a couple of months here. But what I want to highlight is not only this nice trend, and of course, these predicted highs and lows coming in and doing a really great job as even energies were doing poorly over some of these windows before we had things really aggressively move higher as stocks moved higher recently, but you see all of these predicted lows coming in. And you see how quickly the market, within a couple of trading days, wants to move pretty much into a profitable position, within a couple of trading days here.
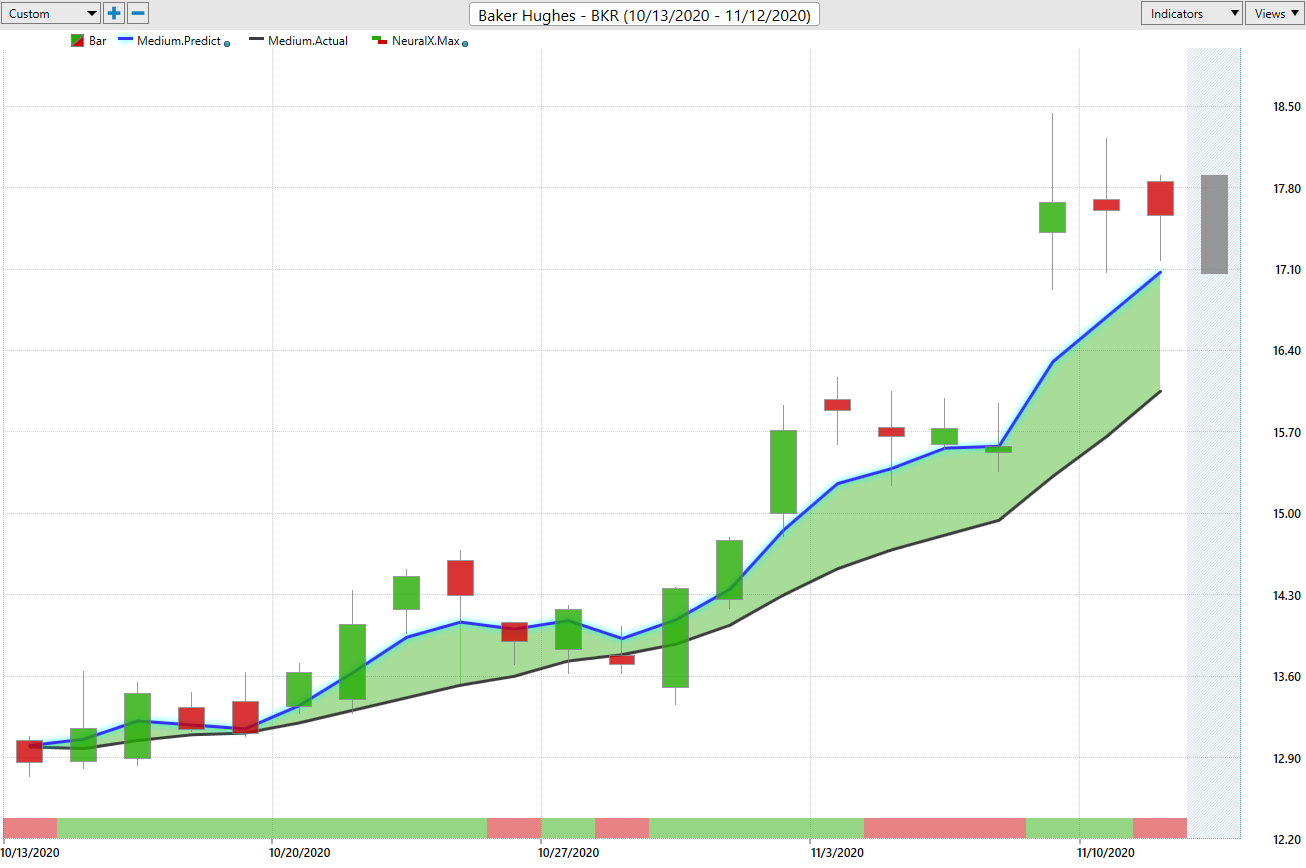
Baker Hughes
You’ll get these instances where, if we look at the neural index, you’ve got some sideways action here. Again, a little bit of weakness over these trading days, a little bit of weakness here. But very clearly, you want to use that weakness to actually be a buyer in the market. The overall trend is still up, and we see shares really start to explode over the past week here. And what was really interesting about this, and we’ll cover this in the next chart here, but you saw a lot of these energies more recently start to turn higher and really let you know that something’s going on here. Look for markets where there’s some strength, and especially don’t be short. Crude oil, if you see all the energy stocks starting to turn higher. So Baker Hughes, over the past 25 trading days, you have a 35% rally. Again, about 500 shares has you about $2,300.
And this is where we want to highlight. And this is where the Intelliscan feature comes into play. So we have the tools here to actually go ahead and scan for fresh crossovers, or really however you want to look for things. If you want to look for a market that’s been trending for a certain period of days. What’s really helpful is utilizing these tools to look for actual, fresh crossovers in the market. And what that allows you to do is utilize that predictive forecasting ability to get in the market before the market really starts to accelerate. And that’s going to allow you to really limit your risk, take a position in the market, and benefit as that new trend begins.
PBF Energy (PBF)
That’s why you want to look at these markets as we get those fresh crossovers coming through. That’s really where the best opportunities are opening up. But here in PBF Energy, and again, across the whole energy sector over the past couple of weeks, seeing these crossovers move to the upside. You see a very strong cross there with your predicted moving average. Neural index, very bullish here. And then with the help of those predicted highs and lows, you understand, well, where do we want to be a buyer in this market? And you see you get that huge explosion in volatility. The predicted range does a really great job of getting back on track and saying, “Okay, well, now we’re in a different spot. Let’s look at those intermarket relationships. See how crude oil is bouncing around, see how the other energy stocks are doing, and understand where are we likely to trade.” And that’s what’s going to help you limit the risk, how much you have to risk to get into a particular opportunity, really maximize the upside.
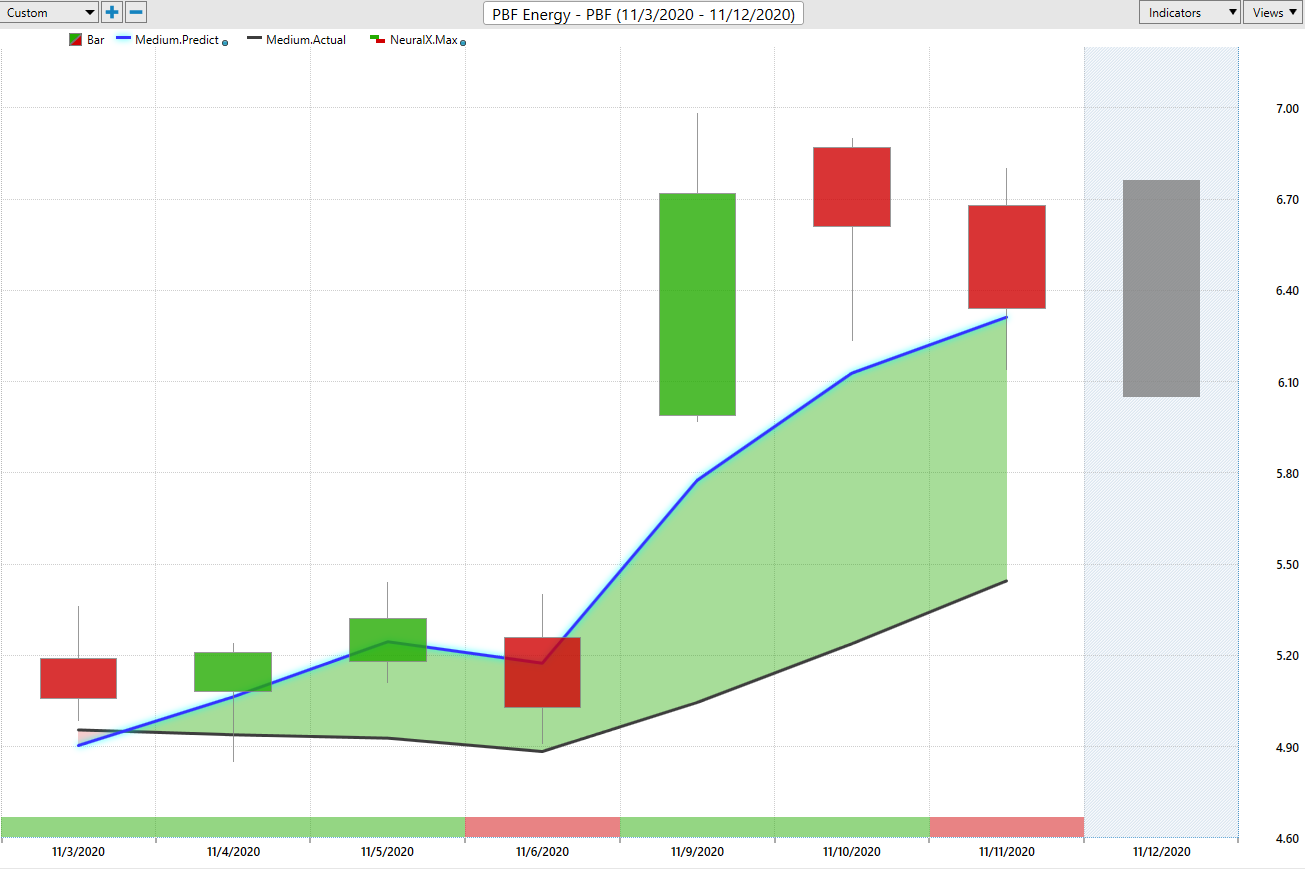
PBF Energy
So when you recognize these trending moves earlier and you understand, okay, well, only makes sense to be long here. Certainly don’t be caught short here as the market’s getting ready to explode. About 25% from the most recent close. But you see, after that trading day, you had a rally there of about 37% at one point. So huge move in a lot of these energy shares, which have really been beaten down over the past, really, several months here.
Steve Madden (SHOO)
Lastly, here, we’ve got Steve Madden and we looked at this last week. And again, a good example of you can have some areas in the market where you’re holding those long positions. As long as the blue line’s above the black line, you still have a trending situation. And you see that as the S&P and the broader markets do well, the markets that are already in an uptrend do extremely well. We see that with Baker Hughes. Things really explode to the upside. Well, same thing here with Steve Madden, which we actually looked at last week. So if we look at five trading days ago, again, really nice entries to go ahead and take this long position.
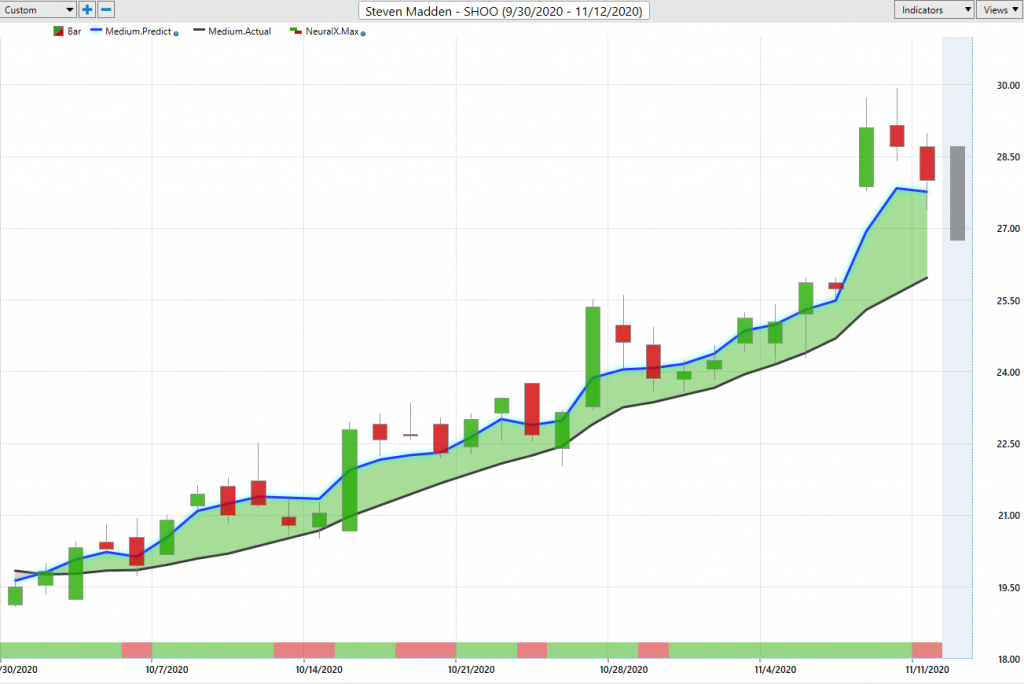
Steve Madden
And again, here’s a situation where the market gaps up pretty much about 20% from those recent predicted lows. Currently up about 13%. But overall, just a absolutely huge move here. About a 43% rally over the past 29 trading days. Again, 500 shares there on a very cheap stock, trading in the, well, what was about the 19 to 20s. Now, what, pushing up to the 30s. Has you up about $4,200 on just 500 shares. But again, it’s all about saying, “Okay, well, which sectors are doing well? Where are things trending? Where are we seeing similar market conditions across the sector?” But also avoiding areas in the market. When you see eventually these blue lines move below the black lines on these forecasts where stocks are moving higher, you understand, look, it’s time to take profit. Don’t get caught remaining on the long side of things, and protect those profits.
Additionally, how many opportunities are you going to have when you say, “Okay, well, I understand I potentially want to be long and only taking long positions on the market.” Well, you’ve got really great intraday levels. And not only that, though, but a tool that’s adapting. So after each trading day comes in and says, “All right, recalibrate based on what’s going on and make sure you understand over the next trading days how things have shifted and where you might want to take position.”
So once again, this has been our Hot Stocks Outlook for November 13th, 2020. Thank you all for watching. Best of luck out there. And bye for now.


