Register for a Free Live Training
The Hot Stocks Outlook uses VantagePoint’s market forecasts that are up to 87.4% accurate, demonstrating how traders can improve their timing and direction. In this week’s video, VantagePoint Software reviews forecasts for Gilead Sciences ($GILD), Take-Two Interactive ($TTWO), Tesla Motors ($TSLA), Fastenal ($FAST) and Under Armour ($UAA)
Hello again traders, and welcome back to the Hot Stocks Outlook for November 18th, 2022. Hope y’all are having a great week out there in the financial markets. And as always, plenty to cover here in today’s outlook. We’re going to start out, we have shares of Gilead. We got Take-Two here, Tesla, Fastenal, and lastly we’ll end on Under Armor. And if you haven’t already, make sure you go ahead and click on the link of the description below and you can get a live demonstration and actually learn more of the specifics of how this predictive technology can help you make better trading decisions in the marketplace.
So, what we’ll do is we’ll start out here with shares of Gilead and really explain all the indicators and how this works really regardless of what markets you’re trading and futures, commodities, currencies. But here we are here with our hot stocks outlook.
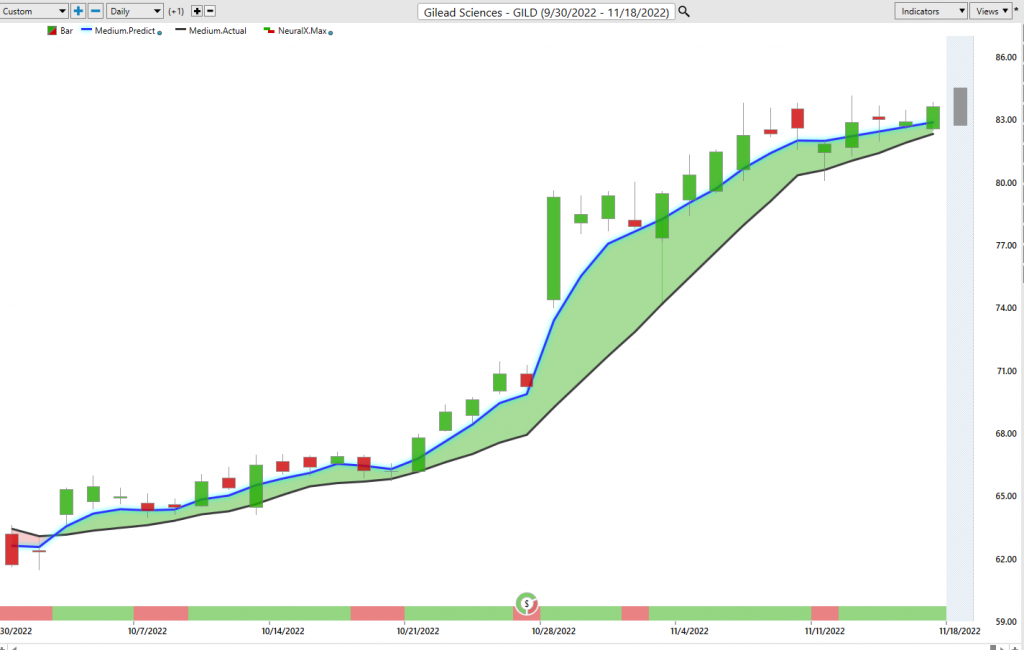
So, starting here with Gilead, what we have is daily price action. So, each one of these candles that you’re seeing is representing a full and complete trading day. And right up against that price data, you’ll notice that there is a black line there, and there is also a blue line. Now, the black line that you’re seeing there, that is very simple. That’s a simple moving average. What it does is it just looks back at the previous 10 close prices, it adds those all together and divides by 10. So, that’s very somewhat obvious information, right? The market’s just going to update its close, it’ll update that level, and it really just smooths out the price action to let you know where market prices have been over a given period of time. Well, traders need to be ahead of the next move in the marketplace. And so what we want to do is actually compare that black simple moving average to this proprietary blue value on the chart.
And so for this number, to get plotted and calculated for the trader each evening, this is where the technology of artificial neural networks come in and perform what’s called intermarket analysis to produce a much more highly accurate indicator. So, let’s understand how this works to produce that value. So, rather than just looking at those past prices, what the software’s able to do is understand other markets that are known to drive and influence the future price of Gilead, or what we might call the target market in this specific case. Now that can be things like the broader indices like the Nasdaq, it can be again the S&P 500, but there’s really important broad market relationships like crude oil or gold values. This all factors into a lot of stocks in a very obvious way, like energy producers, mining companies, but almost any stock out there is driven by things like the dollar index.
And this has affected probably everyone’s portfolio out there, but it’s affecting your portfolio every day in very subtle ways, and this is what’s going on with the software. It’s unable to understand these subtle relationships, how the dollar broader indices, how maybe biotech ETFs or individual stocks within this space specifically affect Gilead sciences. And then it summarizes all that information and actually uses it to generate a true price prediction. So, this technology is looking at these global market relationships, generating predictions of future prices, not looking back at the past, and what we’re doing is using that predictive data to generate these indicators. So, what you have is a forward looking predictive tool that’s going to react and be highly reliable as far as skewing in the direction that the market is likely to move. So, whenever that blue line crosses above the black line suggests average price are going to start moving higher, and therefore you might want to go ahead and take a long position or start executing your strategy as a trader that matches the forecast here.
So, we have a 29% rallying of about 30 trading days and just a couple hundred shares, about $3,800 move. But we got some questions about things like predicted highs and lows and some of the shorter term indicators. Okay, well, this all works together as a overall forecast. So, when you look at the very bottom of the chart, you see this bar that goes from green to red, back to green, and this is the predicted neural index. Again, it’s utilizing that predictive data generated via the technology to produce its forecast, but it’s solving a different problem for the trader. This indicator is tuned to look for just short term strength or weakness over the next 48 hours, or you can think of it as two trading candles. And so this allows traders to really be ahead of short term weakness but not lose sight of the overall context of the trade.
And so we see this all the time where you see overall in this move, the neural index is green because the market has skewed bullish, the predicted moving average is clearly skewed bullish. But over that period, you may get some blips in the neural index where what you want to do is expect some weakened price action over the next 48 hours. Doesn’t mean you have to get out of the position, but what it means is expect… You see these gap downs on these days, these sideways price action, but overall, the trend is very, very bullish here. And so inside of that information, knowing that the trend is up and the neural index is bullish, well, you’re also provided an intra day predicted high and predicted low. And again, those neural network relationships are tuned to solve a different problem here, not trying to skew the overall average prices like the predicted moving average, not trying to forecast 48 hour strength or weakness, but actually picking out an intra day high and an intra day low where there’s likely to be some buyers or sellers.
So, when we go back and look at this, we can say, okay, well if the trader understands, all right, got Gilead, I may want to be long here, express that long position, I can use the neural index to know what my expectations should be if I should be looking for deeper dips to buy on weakness, and then I can use the predicted high and low before each and every trading day to make these assessments of where I might want to set limit orders and where I might want to set short term profit targets to take profit and add more to the position potentially. So, you see here that every day, you’re provided this shadow candle, and what’s going to happen is the actual market data will fill in the previous prediction. And so we can see how accurate all of these predictions are. We really just do this every week as we look at these forecasts.
But what we can see here is if you understand, hey, in Gilead, I want to be long, or just understanding biotech, understanding that there’s a lot of markets in up trend, you may want to focus in this area, and then use this really adaptive predictive tool to make better trading decisions. So, you might want to be buying at the predicted low. You see a lot of opportunities to sell up at the predicted high and get lower prices in the short term. But what’s really great about this is if you can establish a position and you get a nice cushion in the market, well then maybe some very advantageous levels to build a large position and potentially make a lot of money without a lot of risk. Because your entry is given quite a bit of cushion at this point as the market advances. And there’s still plenty of trading here, where you see you’re hitting these predicted lows, shooting up the predicted highs, and the forecast doing a very good job here. So again, there’s Gilead Sciences, but we can take a look at take two.
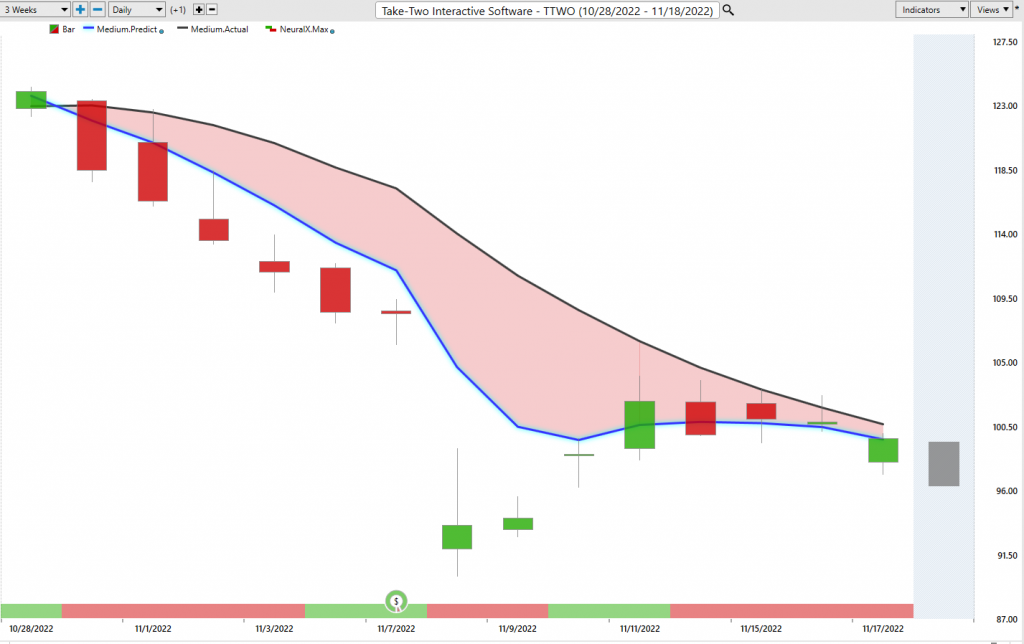
And so we looked at shares of Hasbro over the past few weeks have just been killed, but we looked at EA and Activision over the past couple months, and it’s very important to highlight these areas where there’s some strike. So, EA has done a lot better. Here’s take two though, this crossover to the downside more recently and very clear that, look, the market is in a down trend. You see the neural index gets bullish here and you sort of run sideways. You get another bounce up here. But the overall trend here, very clear that if you want to get long look for something like Gilead, but clearly Take-Two, we looked at Disney, we’ll look at Tesla, there’s some places where just have not worked out in a market that’s actually done fairly well here. So, here we have Take-Two, and you see how this works, is very strong forecast to the downside, very clear blue line crossing below the black line.
And so the trader can understand, look, there’s been a very important shift here. Now, these predicted highs are much more advantageous levels to look to short and target those predicted lows. And you see this leads into, I don’t know if this is earnings or whatnot, but you really want to get out of the way. And so this is what’s really interesting about vantage point, is it has this very high level of accuracy attached to things like the predicted neural index, really through earnings, through fed announcements. And so you want to accommodate for those things, right? You don’t want to trade a market and not know that earnings are tomorrow, right? But that’s something that the trader can fully understand when those big calendar events are coming up. But otherwise, you’re going to have a predictive forecast that’s going to do a good job taking advantage of those market participants and understanding where they’re lining up, whether bullish or bearish, and where the stronger trade is.
Now, what’s nice about this is we can use this technology and really use it to identify new opportunities, so really see the places, hey, where those shifts happening now, and what is alerting us to as far as how this market is setting up?
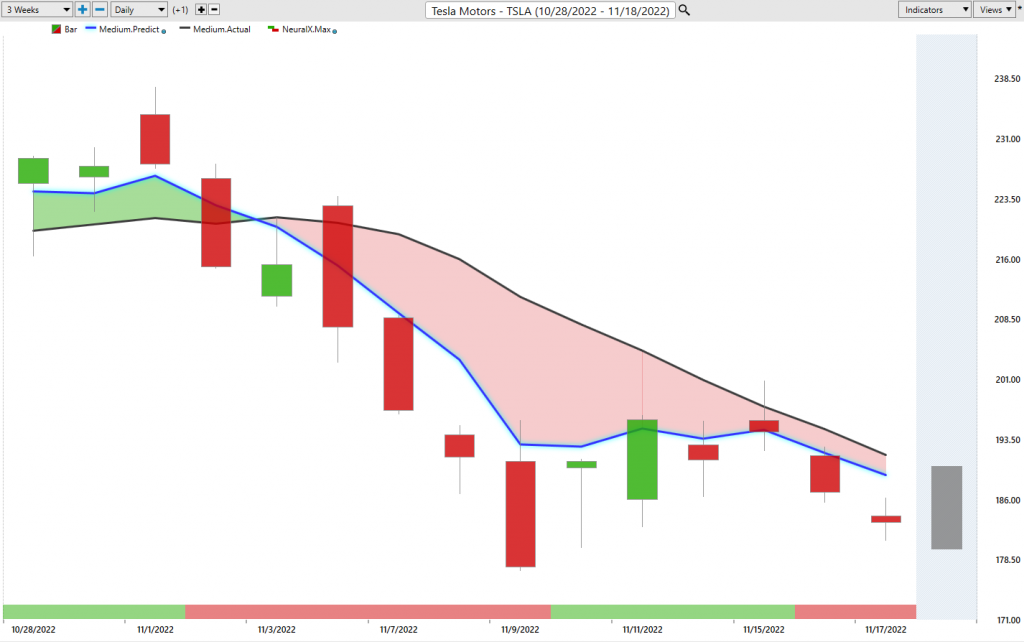
So. Move forward, we got shares of Tesla. So, I just like bringing this through because it’s very popular company, a lot of people trade this, but here we’ve had a market that’s done really well, the S&P sort of climbed higher, but shares of Tesla is really not where you want to be. You see this blue line crossing below the black line. Look at the neural index just going into this area. So, again, this updating 48 hour forecast highlighting weakness in the market. Well, if you have the overall trend is down and getting aggressively weaker, and that neural index is saying, hey, 48 hours into the future, you’re likely to have some weakness, and you see how that’s some very important information for the trader to have.
Now, as the market recovers, you see you get these subsequent 48 hours, but still that blue line, so that prediction of average prices is still not above the actual moving average, and therefore not really breaching the criteria for bullishness. So, a little bit of a decline here in Tesla’s… I mean Tesla’s really been one of these markets where we’ve gotten more of these bearish forecasts. You’ve wanted to be short over the past several months here, 16% decline in 10 days. So, this is very important to not get on the wrong side of these things. And again, even a hundred shares, there’s about $3,500 move there.
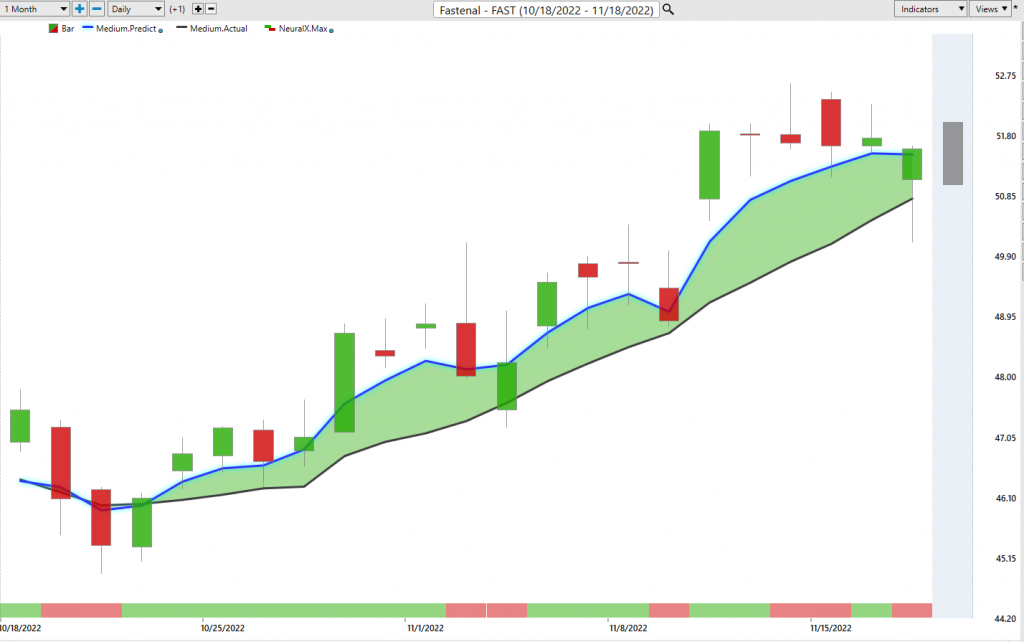
Now, here we have shares of Fastenal, and here’s a more bullish opportunity here. So, you get this crossover to the upside, blue line over the black line.
And again, just with sort of broad strokes here of where should you be avoiding where markets in down trend, and where is there potentially some opportunity out there? So, as that blue line remains above the black line, you’ll see you’ll have days like this where the neural index comes in, you get a gap down. You got a neural index here. This, again, might be there’s a lot of earnings and things coming through here. But again, neural index, a little bearishness here, a little more, but the overall trend is up, and then we can look at those predicted highs and lows, which is really going to guide likely your very short term behavior of where you’re accumulating position. Now, I personally, I like to really pay attention to previous predicted highs and lows as well, because this is very short term. Sometimes all the buying takes place one day, and then you get a gap down to the previous predicted low and things like this. You’ll notice these sort of things with the technology, but you want to pay attention to the bigger theme there.
Is the market in an up trend? Do I want to be a buyer here? And then go in and set up your risk management and make sure you can deal with the volatility for the type of trade that you’re trying to take. But look at some of these predicted lows. I mean, this does just an excellent job of everyday updating and saying, okay, what shifted? Well, even on this trading day, you see how the predicted low, or the predicted high here actually slants a little bit lower. You sort of run sideways and it’s warning you be prepared for some volatility here. Now, as you get again, I think that might be earnings there, but here again, predicted lows, predicted lows, predicted lows. Here, the market goes a little squirrly, but closes right in the middle of that range. So, again, as a trader, you’re going to have to decide on what sort of trading strategy you’re going for here.
But when you’re a trend trader and you’re getting good entries, well, you can generally deal with volatility and trade off of those predicted highs and lows, even as your volatility starts to heat up, but the big thing is you want to catch that big move. And when you get markets trending like they are, and you’ve seen in Gilead and even on the bearish side and some of these examples, there’s a lot of money just by maybe sitting on some of your position and letting that market continue. If the blue line crosses below the black line, maybe you want to make those adjustments.
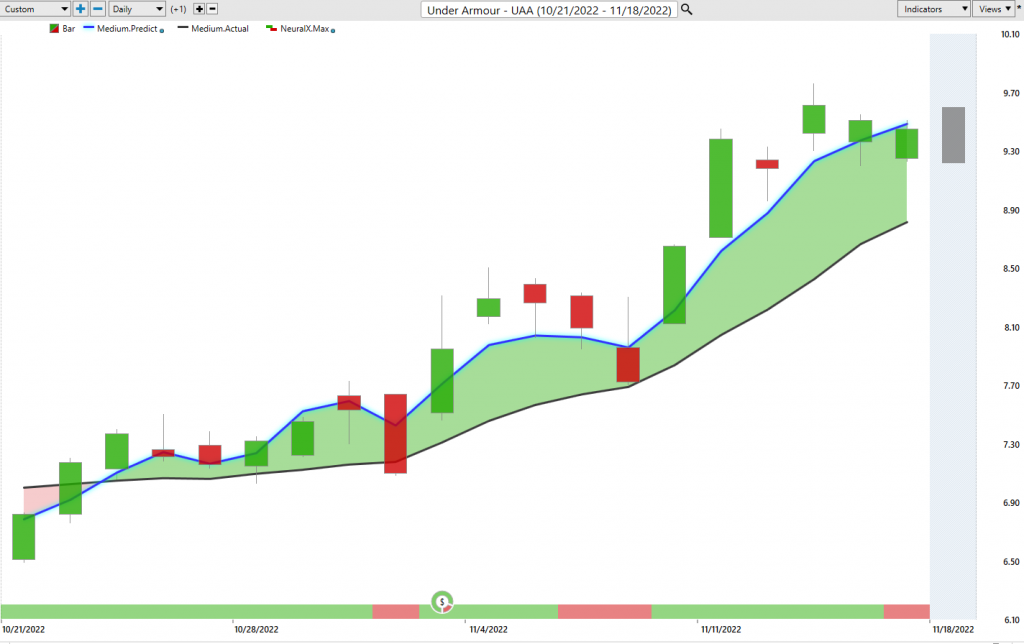
Lastly here, we have shares of Under Armor. Again, very similar example. We’ve seen a lot of this throughout just the Nike. Under Armour, a lot of this consumer space, but blue line over the black line. This is actually earnings right here and above this one, but same thing. You see how this works, and let’s look how accurate these forecasts are right after that earnings move. We can go ahead and bring up the predicted highs and lows, and then you see how this works.
There’s earnings if you want to be long or trade options, whatever around that, deal with that risk, but look how this updates. Predicted low, predicted, low predicted low, bigger move is to the upside, predicted low, predicted low, predicted low. And you even see in these examples, if you have orders waiting at those predicted lows, you get filled at the open on the gap down, and then the market trades straight up. And that’s what’s so interesting about these neural networks, is they’re going to produce levels and forecasts, essentially, strategies that are not going to be obvious to the average trader, but the trader can leverage these tools to make better trading decisions and manage themselves effectively in the marketplace. So, again, we can just take a look at the overall move.
I know it’s a little different trying to highlight some of these predicted highs and lows and how to think in the very short term or really make potentially longer term for your trading, but there’s a 31% rally there over the past 17 trading days. There’s really great opportunities throughout these markets, but you want to know where to look, and then how to manage that opportunity once you’re in it to really get the most out of these moves that we’re seeing in the marketplace. So, once again, this has been our Hot Stocks Outlook for November 18th, 2022. Again, if you haven’t gotten that live demonstration, go ahead and sign up, learn more of the specifics about how you can make better trading decisions with the use of this technology. So, have a great week. Thanks again, and bye for now.