


Hot Stocks Outlook for the Week of
November 27th, 2020
The Hot Stocks Outlook uses VantagePoint’s market forecasts that are up to 87.4% accurate, demonstrating how traders can improve their timing and direction. In this week’s video, VantagePoint Software reviews forecasts for Plains All American (PAA), TransOcean(RIG), Eastman-Chemical(EMN), Goldman-Sachs (GS) and Walt Disney (DIS)
Register for a Free Live Training
This Week’s Hot Stocks Outlook
Hello again traders and welcome back to the Hot Stocks Outlook for November 27th, 2020. Hope you all are having an excellent week out in the financial markets and as always, plenty to cover in this week’s outlook. We’re going to start with a theme from last week, really looking at a lot of these energy companies and energy shares. We have Plains All American, also Transocean. We also have Eastman Chemical here, Goldman Sachs and lastly, Walt Disney.
Plains All American (PAA)
Starting out here, what we have with Plains All American and really all the charts, whether you’re trading a stock, a futures or commodity market, a currency, all of the forecasts here work off of end of day data. Each one of those candles represents a full and complete trading day. And right up against that price date, you’ll see that there is a black line and also a blue line. Now the black line that you see on the chart there, that is actually a regular simple moving average. A very common technical indicator and really one of the weaknesses with most technical analysis is that it’s really looking at data exclusively from the past so it gets dragged around by typically the most recent close price and acts as a good measure of where market prices have already been but of course, traders need to anticipate where are prices moving going forward?
What we’re able to do is actually use that black line, again as that measure of where market prices have been but what we want to do is compare that value to the value of this blue line generated. And for that value to be calculated every day, Vantagepoint is doing what’s called Intermarket analysis and it’s specifically utilizing the technology of artificial neural networks to do that. When talking about Intermarket analysis, well, what does that mean? Well, energy stocks are a really easy and simple example for this because obviously shares of Plains All American, share some extremely important market relationships with oil futures markets or even things like the whole entire energy complex of heating oil, natural gas.
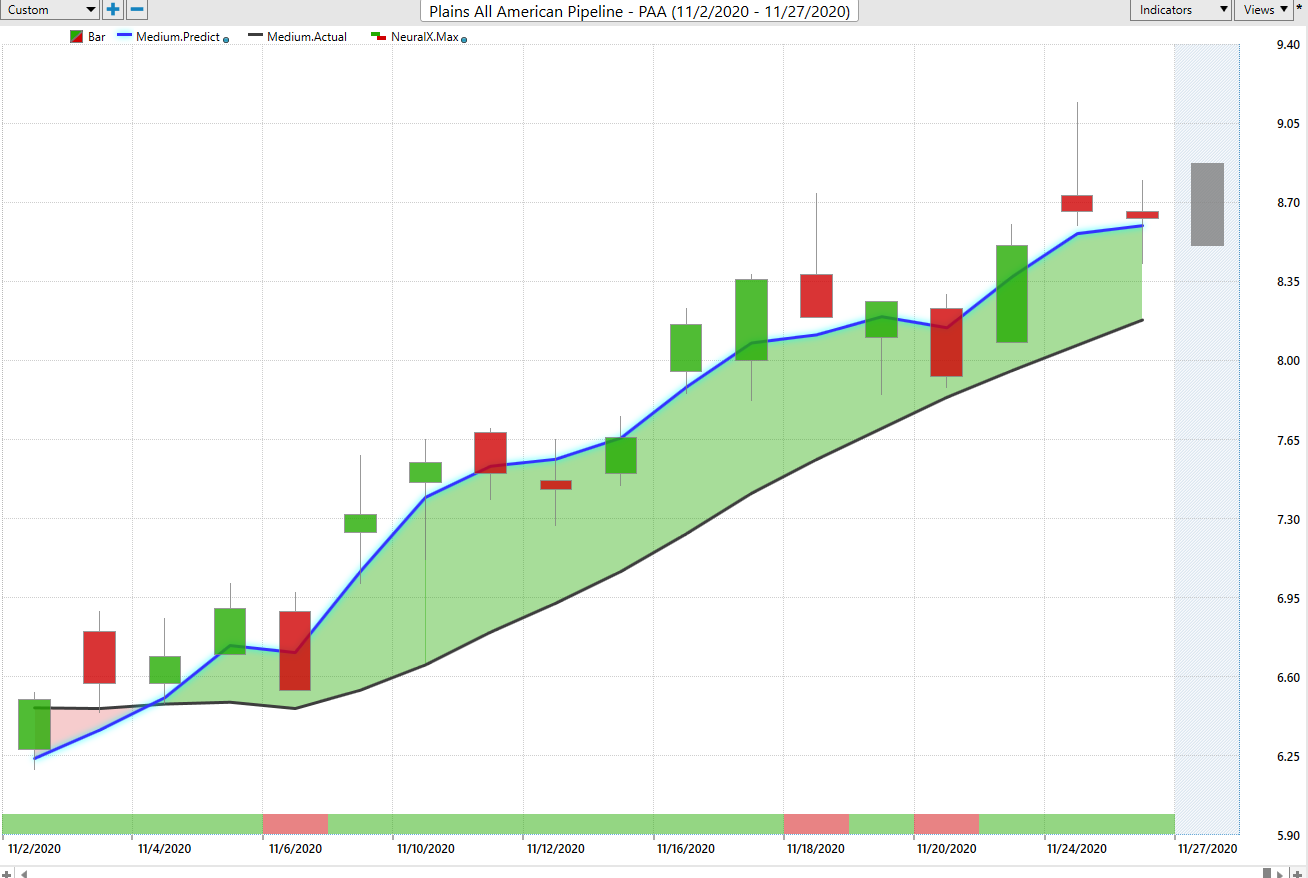
And so that goes into the calculation of future prices of Plains All American, but there’s also other important relationships with what’s going on with the S&P 500 as a whole. There’s important ETFs that model energy services in the market. There’s global currencies and global interest rates and all of that that is going in and being used to calculate and actually generate future price prediction. You can think of that as data off to the right of the chart that hasn’t yet occurred. And that data, that prediction data is actually used and built to construct this moving average. Turning what was a lagging traditional indicator into a forward-looking predictive tool.
Whenever that blue line crosses above the black line, the overall trend in average prices are expected to start moving higher. Now neural networks can really be trained to forecast a very specific time period. You really set a goal for it and what it’s trying to do well, if you look at the very bottom of the chart here, you’ll see you have this bar that goes from green to red, back to green and this gets updated each and every trading day as well. And what that indicator is tuned to do is look ahead 48 hours ahead. It’s looking at short term strength or weakness in the market and this has an accuracy rate of about 87%, really averages around 80%. Almost four out of five times, it’s getting it right on whether average prices are going to be higher or lower 48 hours into the future.
And again, that technology is used to really be tuned to a different time period. To actually highlight a predicted high and a predicted low for each and every trading day before the trading day happens. Literally at 6:00 PM Eastern the night before, all of this information is known to help you go into the next trading day. As long as that blue line crosses the black line, says the overall trend is up and you would therefore want to look to take long positions in the market. We see in this case of Plains All American and many of the energy shares, it’s been three weeks now, we come in and go look at Baker Hughes, look at all these energy markets starting to turn higher. And when you see similar activity in very similar stocks, it’s usually a good sign that something very important is going on there.
We see shares up about 29, almost 30% in just the past 15 trading days. Literally only about three weeks on the calendar a 30% rally. But what we can also do is take a look at how accurate these predicted high and low forecasts are for each trading day. You see that if you understand that, look, I would only want to be long and taking profits on long positions, you get a really nice fill here on this down day and you see how important this is. That on this trading day, the market’s going to trade lower, but then that gap up’s going to happen in that market’s going to start trending higher.
And you see, as the volatility picks up in the market, you get these additional days where the software is going in and saying, “Okay, well, if you want to add to your position, make sure you have those orders ready to go and scoop up some shares as the market moves higher.” About a 30% rally, a really nice entry early on in that, but several entries here within the past week as shares move up about 70, 80 cents higher on an $8 stock.
TransOcean(RIG)
Now moving forward to Transocean and this is a very similar situation. We saw really this first week of November, a lot of these energy shares start to turn higher and this is very easy to see with the help of this IntelliScan feature, which allows you to set up the predictive indicators to scan for exactly what you’re looking for. If you’re a trend trader looking for new trends, you can look for these fresh crossovers. If you’re a shorter term trader, you can utilize the predictive neural index at the bottom here, as well as the predicted high and low range to figure out intraday, where might you want to start getting involved and take a position?
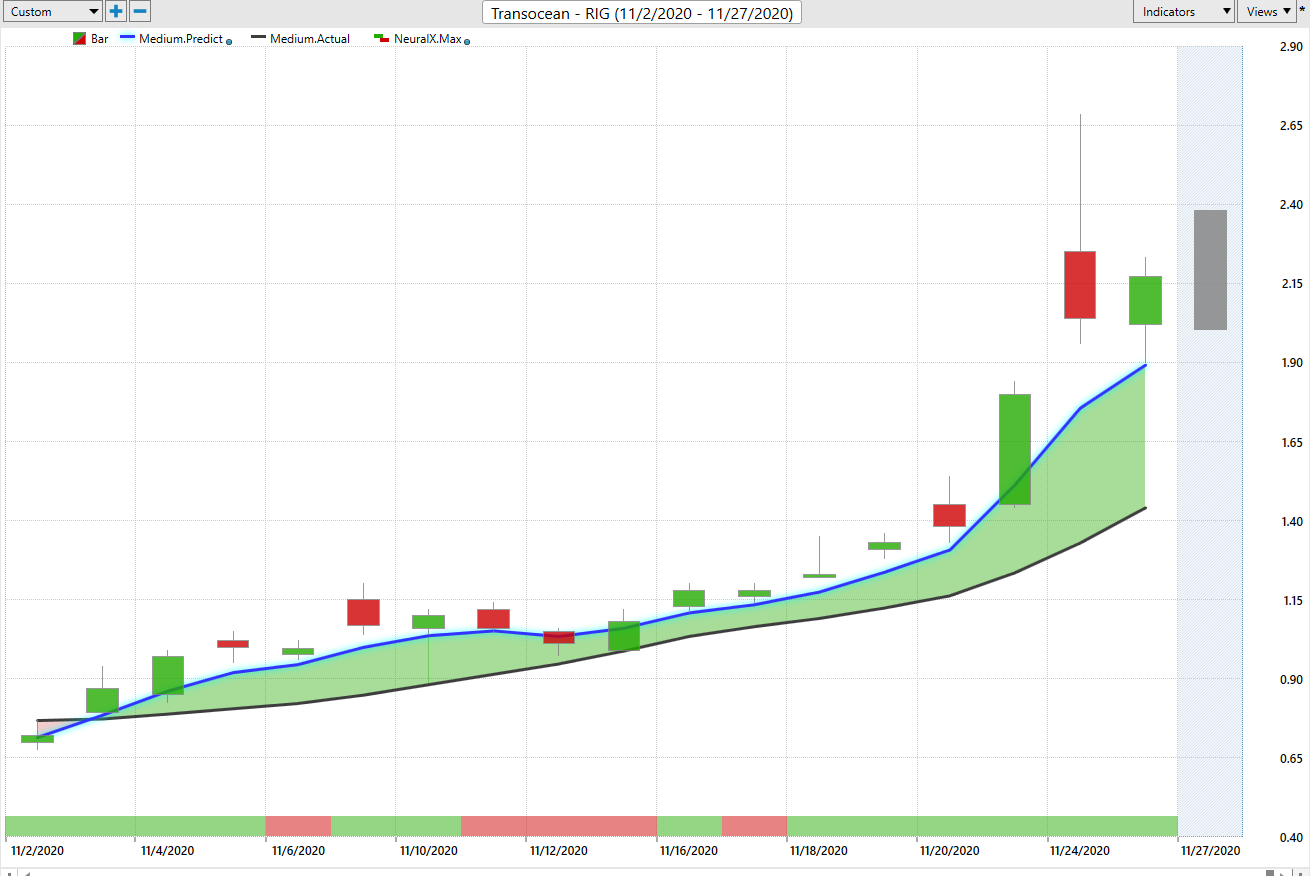
And you see just over the past week, shares have really started to move higher. But again, when you identify that look, this is an area in the market of interest. You’ve got a very cheaply priced stock here at about 90 cents from where those crossovers move to the upside, these shares are up a 144% in the past 16 trading days. Really just in the past week, you’ve gotten pretty much a doubling of shares. And again, we can take a close look at those predicted highs and lows. What you understand is, okay, well, if this is an area of the market where you should be paying attention and you say, “Okay, well, here’s a stock where I can accumulate some cheap shares.” You see these daily levels coming through, down here at about a dollar per share. Look, scoop up some of this position down here. And as this market really starts to move, you see that things aggressively start to break out here, but you want that guidance, especially with a very cheaply priced stock.
Entry prices, critically important and you can come in on an intraday basis and get that very good intraday price level. Now, when energy start moving up, typically as a positive effect on chemical companies as well and basic material stocks. Here again, we see this crossover at the beginning of November, stocks start to move higher and you see that this neural index, we have a couple of these periods like right here, it looks like it actually gets it wrong. But the overall trend you see is very strong, a lot of separation between that blue and the black line, but you’ll see it’ll be very helpful in periods like this, where the neural index gets bearish here and says, “Hey, there’s going to be some weakness over the next trading day. Don’t get too thrown off if the market trades lower over the next couple days.”
You also have the guidance of the intraday predicted lows to say, “Okay, well, where might this market trade to? And where might you want to have limit orders waiting?” And certainly don’t have your stops waiting in this area. But as long as that blue line remains above the black line, it’s saying, “Look, expect average prices to move higher.” And again, another example of shares that have really done well as we’ve seen basically energies move higher, basic material, really the whole market, but from a percentage basis, certainly these energy and basic material stocks have done really, really well.
Eastman Chemical(EMN)
Here, we have Eastman Chemical up about 19% in just the past 14 trading days and here again, some traditional examples of when the S&P starts moving higher, it drags up stocks generally when oil is moving up as well. Well, energy stocks are really going to move, but also things like Goldman Sachs, Walt Disney here and again, you saw a lot of the market turn higher, early part of November. As you’re running that nightly scan, you recognize that, okay, well, there’s a lot coming through over this November 3rd, 4th and 5th period, strong crossovers to the upside, as far as the blue and the black line and letting you know that use your predicted trading ranges, those predicted highs and lows to stake out a entry position and get a good entry price in that share market.
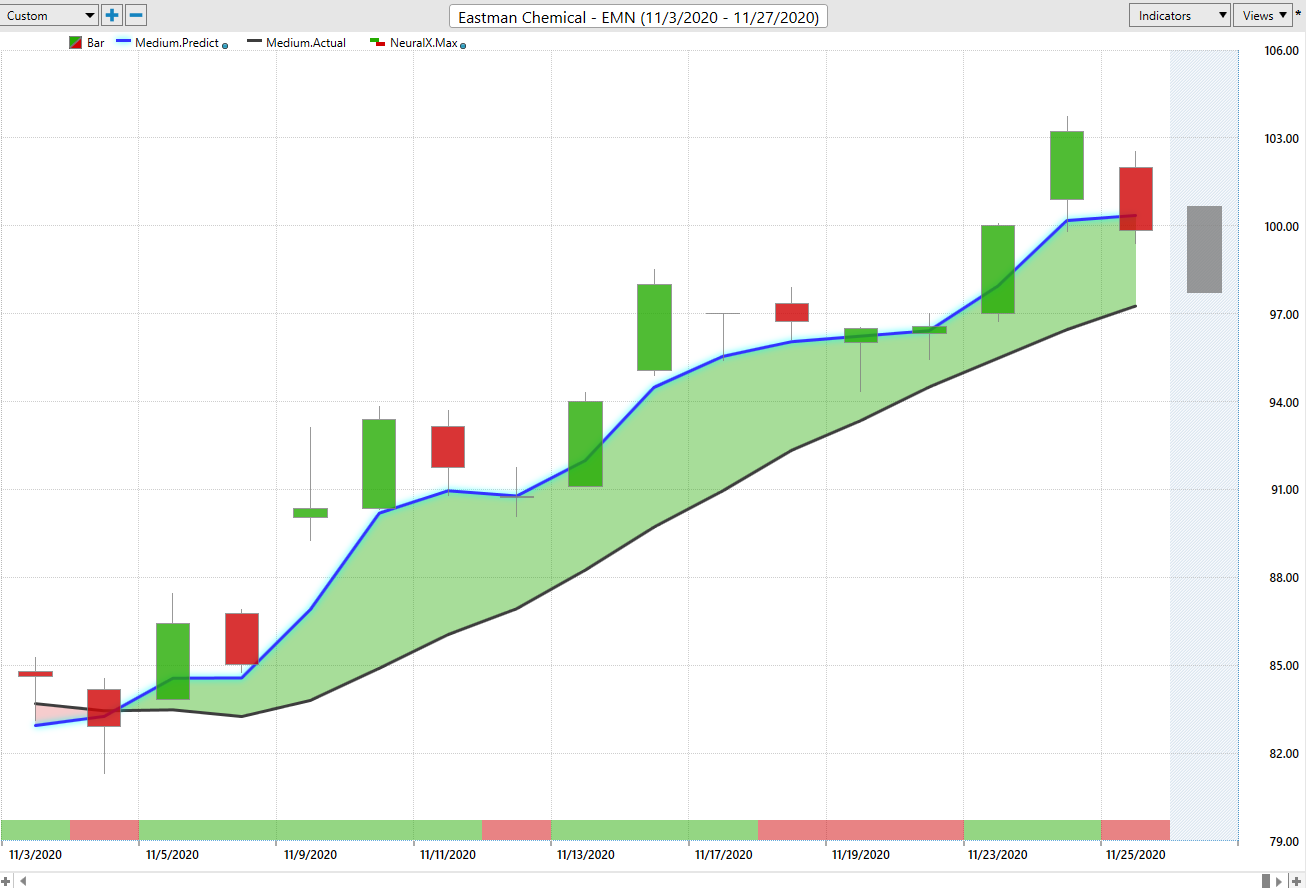
See early on, we get that hitting of the predicted low here, we get a lot of volatility and this is where things really work well is when volatility really comes into the market and you see you’re breaking out of that range aggressively. The neural network forecasts do a very good job of looking at those intermarket relationships, utilizing the technology and adapting and understanding that, okay, there’s been a big move here. Let’s figure out where things are and get those forecasts back online. And you see here the very next day, getting some very good forecasts here that say, “Well, you’ve got these trading ranges that you need to be aware of.” And again, that market trend starts to continue and break out to the upside with really numerous entries along the way to go ahead and get involved.
Goldman-Sachs (GS)
Again, if you’re a swing trader, a day trader, regardless of your timeframe, you’ve really got all the tools here. You’ve got overall trend, you’ve got short term strength or weakness and also that predicted high and predicted low literally intraday price levels to go ahead and take positions from.

Shares of Goldman here up about 18% in the past 15 trading days. I
Walt Disney (DIS)
f we come over to Walt Disney, similar picture here, very strong crossovers at the beginning of November saying, “Look, this is the time to go ahead and get involved in shares.”
And this is why this is critically important. You really want the benefit of these predicted moving averages is recognizing trend reversals earlier because rather than grabbing all the data from the past and really being a lagging indicator in that regard, you’re utilizing actual price predictions that are going to produce a faster signal, especially when you run this on the aggregate of the wide swath of different stocks in different sectors that you can do analysis on. When these crossovers really start to come through and you see that strong separation between the blue and the black line, it’s critically important to get those positions on because oftentimes you will get gaps on the chart and there’s no price to be traded as the market in this case moves from about a 127, gapping up to 142 but you have the help of the predicted high and low ranges.
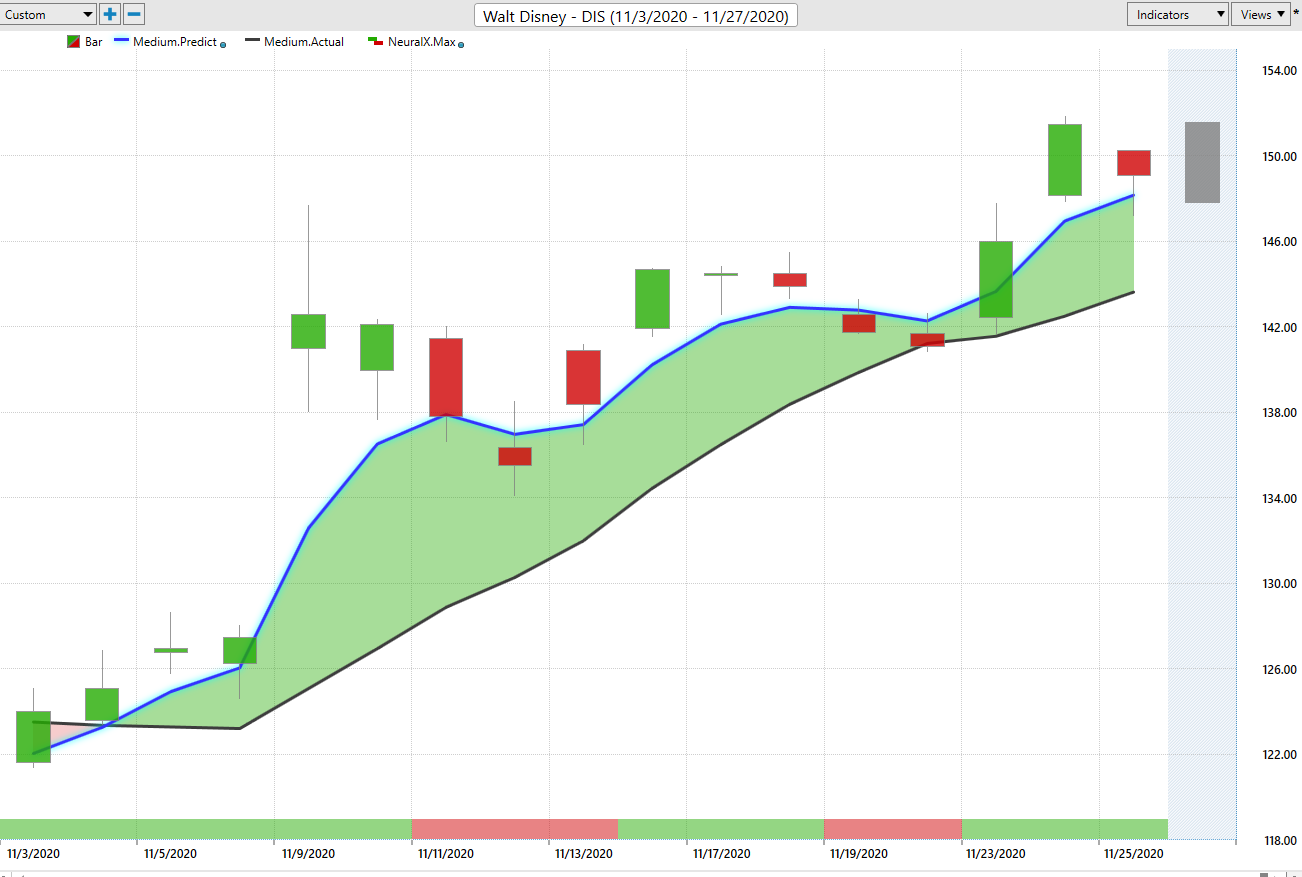
When you understand that, all right, well, you got to look to get a price here. You see this all the time with the market trading outside of that range, closing within it and then that overall trend really continuing, your neural index getting bearish here saying, “Look out for some cheaper prices here over the next couple days.” Again, same thing here, these small retracements in the market, but overall that trend and that blue line, very strongly above the black line signaling a very strong trend here.
Again, if we look at the overall move here, most of that taking place early on, but shares up again, similarly to Goldman about 18 and a half percent here in the past 14 trading days. We saw just so many markets, specifically the energy sector, turned up a long time ago, but those things really starting to accelerate as the S&P moves higher, oil futures markets move higher and that’s had an extremely positive effect on stocks, specifically in the energy space, but generally throughout the market.
Once again, this has been our Hot Stocks Outlook for November 27th, 2020. Thank you all for watching. Best of luck out there and bye for now.


