


Register for a Free Live Training
Hot Stocks Outlook uses VantagePoint’s market forecasts that are up to 87.4% accurate, demonstrating how traders can improve their timing and direction. In this week’s video, VantagePoint Software reviews forecasts for The Trade Desk ($TTD), Iris Energy ($IREN), Cleanspark ($CLSK), Applied Materials ($AMAT), IBM ($IBM), Home Depot ($HD)
VantagePoint A.I. Hot Stocks Outlook for October 10, 2025
Hello again traders, and welcome back to the hot stocks outlook for October 10th, 2025. Hope you all have had a nice week out there in the financial markets. And as always, we’re here to take a look at the most recent Vantage Point A.I. predictive forecast.
So, if you haven’t already, be sure to go ahead and click on the link down in the description below and get signed up for a live demonstration so that you can learn all the specifics about how these predictive indicators uh and trading technologies are helping traders navigate the financial markets.
Uh and so we’ll go ahead and start out. We got a lot of opportunities to cover here, uh but a really nice example of how all of these predictive tools work together in shares of The Trade Desk ($TTD).
The Trade Desk ($TTD)
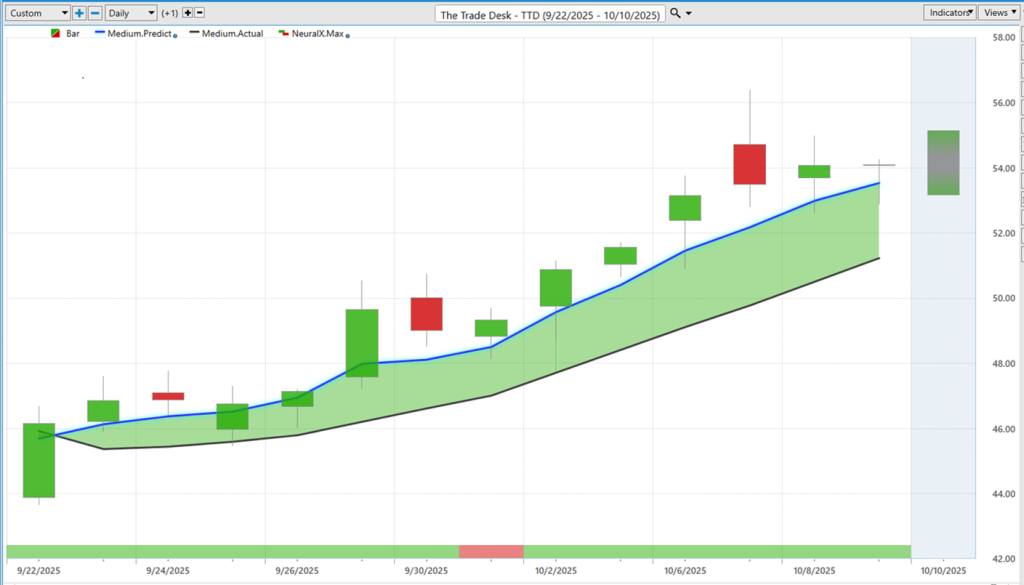
And so uh what we’re looking at is simply daily bars and candles, right? So each one of these candles that you see there will represent a full and complete trading day. And it’s right up against those daily bars that you’ll notice that there’s a black line and also a blue line value.
And so what that black line value is, is actually a simple moving average. So a very common technical analysis indicator, uh in this case, it would be a 10-period simple moving average, which is just going to look back at the previous 10 close prices, add them all together, uh and then divide by that number.
And so a lot of traditional technical analysis works in that realm of things, right? It’s just reconfiguring past prices and has no predictive capability. And obviously traders need to understand where are things likely to head next.
And so Vantage Point traders are able to use that as our baseline and reference this blue line that you see on the chart. And so whenever this blue line crosses above the black line, well, this is where Vantage Technology is really skewing these indicators in this instance to the bullish side.
And we could think of this as a forecast of future average prices. So you see our medium-term predicted moving average moving above the actual moving average. And as long as that blue line remains above the black line, that’s Vantage Point suggesting that these prices should continue to trend higher.
And really, since that forecast has come through, we’ve moved up about 16, almost 17% here in the past 13 trading days.
Now, that helps you out with the overall trend, but there’s other tools here that really round out the entirety of these predictive forecasts. Uh, and so when you look at the very bottom of the chart, you’ll see this bar that goes from green to red back to green. Uh, in this instance, it stays green almost all of these trading days.
And we’re looking back about, uh what was that, 13 or so trading days. Really more than that, probably 15 trading days. It stayed bullish for about 14 out of 15 of those. Uh and so this indicator has a very high level of accuracy — upwards of 80% plus accuracy — uh at predicting short-term strength or weakness over the next 48 hours.
So this is where short-term traders can really use this to navigate those expectations over an extremely short period of time. And they can combine that with the Vantage Point predicted high and low.
So you have this 48-hour forecast here from the neural index at the bottom — a predicted high and predicted low getting to intraday prices and important levels where traders can do some uh trading from.
Uh and we can look back and see how accurate have all of those predictions been against the actual market data. We can really see how this works. And so you’re provided this daily range before each and every trading day.
So early on in this trend, traders can understand, okay, well, if we can buy down at these predicted levels, well that would be a really nice entry, uh as far as to participate in this uptrend. You see even yesterday here moving down to the predicted low and then trading in between the range uh by the end of the day here.
So this is how all of these predictive tools work together, and we have really great features here where you can actually scan and identify, hey, where are these fresh crossovers occurring? Uh where are these new opportunities really popping up on the chart where you can focus your attention in the right place at the right time.
Iris Energy ($IREN)
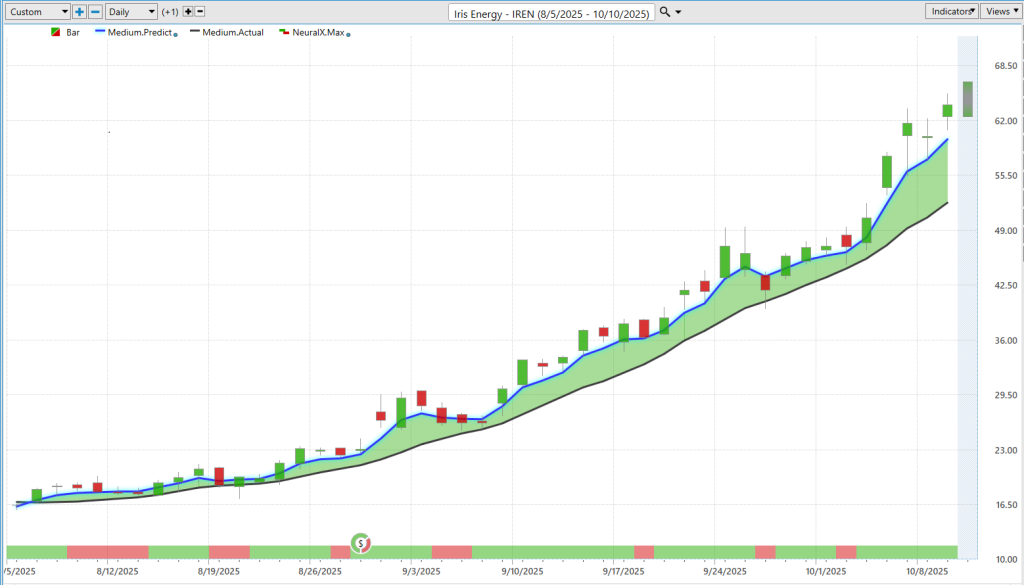
Uh one of those areas where we’ve seen a lot of bullishness is uh Bitcoin miners and a lot of these data uh uh company stocks here. So here we have Iris Energy, uh really going back uh quite a long period of time, a couple of months here as far as individual trading days.
Uh but you’ll notice that this blue line remains above the black line really for the duration. And so when we look at the entirety of this move, got a very strong push even this week, continuing to move higher.
A couple of weeks ago, we looked at CleanSpark. We’ll go ahead and revisit uh the most recent forecast from there, but you see about a 260% rally in just the past 46 trading days.
And so you’ll notice you’ll get these periods where the neural index will go bearish. You get this sideways price action, but again, as long as that blue line stays skewed on the bullish side of the black line, the overall trend still remains to the bullish side.
And so you see many of these periods where you dip lower over the subsequent couple of trading days, but overall the trend very bullish here, uh and getting a 260% rally.
Uh we can of course look and see how accurate are all of those predicted highs and lows. Uh when we go back over a long period of time, you see how many opportunities down at these predicted levels, especially early on in the trend for traders to uh uh really uh build a position, uh potentially do some short-term trading using that short-term range to take profits when you get up towards those predicted highs.
Uh but knowing you really only want to be long — be on the bullish side of the market here, buying and taking profits on longs.
Even just this past week, what would have been Monday here — well, actually, this would have been Tuesday uh and Wednesday — moving down towards these predicted lows and markets up about 14% uh since those predicted levels have come through.
Cleanspark ($CLSK)
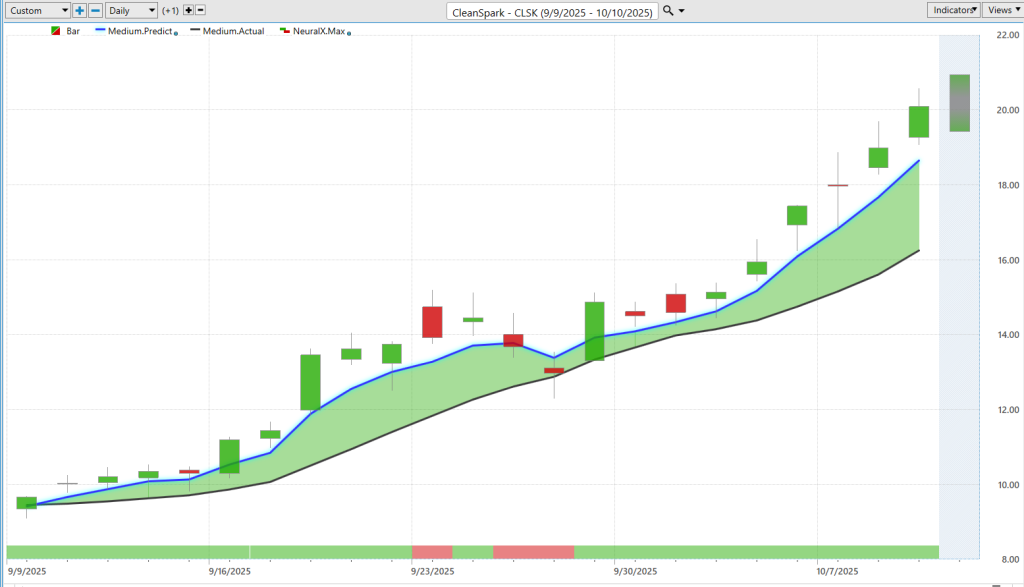
Uh here’s CleanSpark, which uh we actually took a look at this several weeks ago uh when this trend started to get uh uh formed here. This blue line crossing above the black line, we had a little bit of a retracement.
You see the neural index going bearish, warning of that weakness, but again, overall, the overall trend remains bullish. And as that neural index gets back to its green configuration, we really see the momentum kick back up in the market.
And this has been a really great opportunity here. You see again uh midweek here moving down towards the predicted low. And when you really have, you know, things like alerts set on some of these charts down at these predicted lows, you really know, hey, we’re starting to get these, you know, uh markets that are in uptrend scooting down towards these predicted lows.
See about a 19% rally just over the past three trading days, uh that of course coming within uh really about a 100% rally here uh in just the 19 trading days, right? So really nice opportunities in some of these uh Bitcoin mining stocks.
Applied Materials ($AMAT)
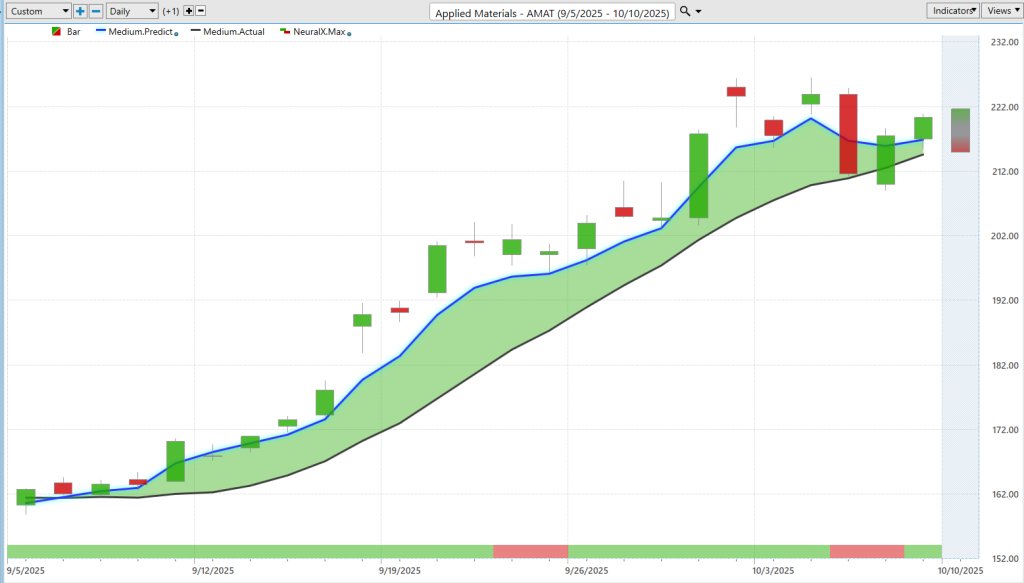
Uh here’s Applied Materials. So really same approach. We’ve got our blue line crossing above our black line. You’ll again get these periods where the neural index goes bearish.
And as a trader, especially taking a longer-term swing or position trader, you really want to be aware of, hey, we might get that dip in prices, might get a little bit of a gap down the next trading day.
Uh but a lot of separation here between that predicted moving average and the actual moving average suggests the trend again is still bullish. So you’d only want to be taking those long positions, uh take profit on your longs.
Uh and we see again about a 35% rally here in just the past 23 trading days.
IBM ($IBM)
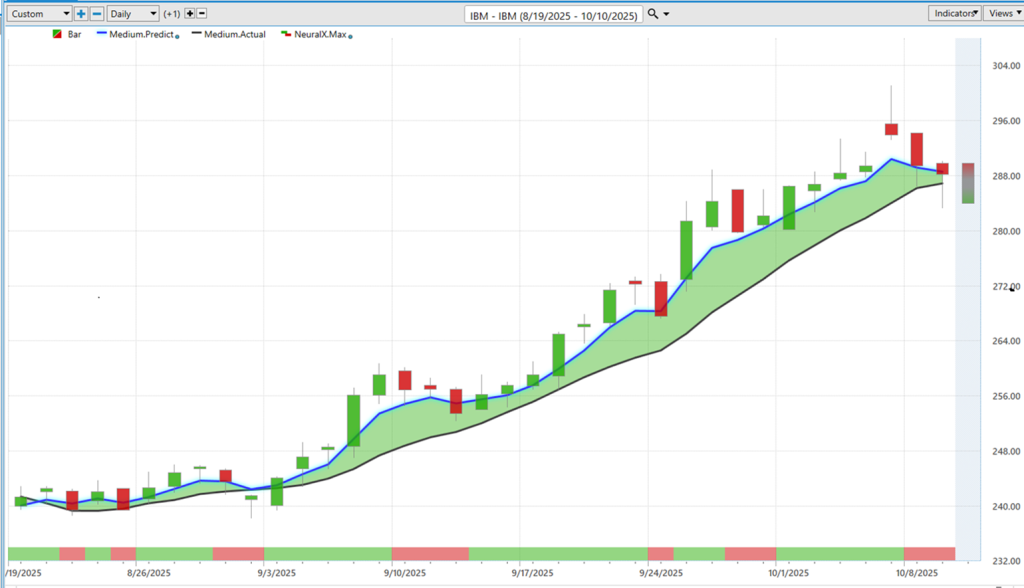
Uh IBM here. So a very uh uh uh you know longly traded stock here. Blue line crossing above the black line. Couple these instances where the neural index goes bearish, but again a lot of strength here uh in the overall forecast.
Uh and allowing traders to again exploit the bullish side of the market here. So we look at this overall, got about a 19% rally here uh in just the past 36 trading days, uh and numerous opportunities where the market is moving down towards these predicted low levels, uh and then trading higher here.
You see we get this volatility gapping up, a lot of movement uh around these predicted levels, uh and then uh again the market still in that bullish trend.
Home Depot ($HD)
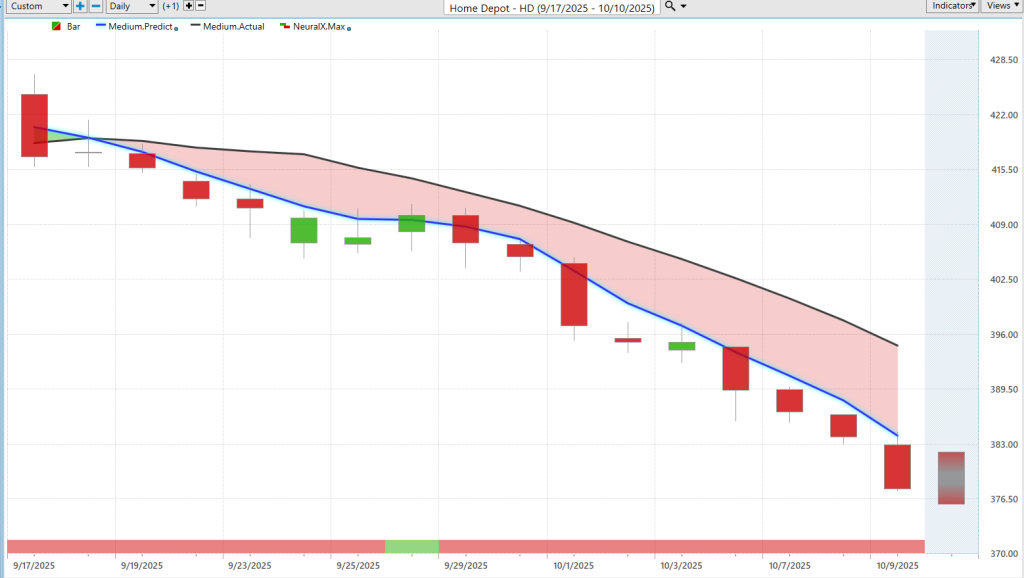
Uh lastly here, and uh you know last week we looked at Reddit, which is one of the few opportunities where we’ve seen some bearishness in the market. Uh but it is important to highlight that, you know, markets don’t always go up, and we have, you know, plenty of markets that are actually currently in downtrend.
And so you don’t want to focus your attention there if you want to find opportunities to buy. Uh here we have Home Depot, uh very clearly here blue line below the black line, neural index bearish, and just a lot of separation uh between those values.
Right, so we get one day where that neural index pops up, but when we really factor in, all right, how accurate is this neural index? Well, again, it’s going to get that right about 84–85% of the time on a very wide range of markets.
So traders can really, you know, really navigate and say, okay, well what should the expectation be here, uh when we have the trend and the neural index bearish? Well, that’s where you’d expect that strong bearish momentum in this case.
And of course, we can look at the predicted highs and lows here. I see early on in the trend just hugging these predicted lows, not getting much of a move off of there until uh really last week, last uh uh would have been Thursday there, moving up to the predicted high, trading lower.
Um and uh again, pretty strong move here just off of these levels. And just highlighting some areas where you might want to avoid, right? Some of the retail space, uh some of these, uh uh uh, you know, hardware stores and companies like that, but mostly just the retail space here not doing well.
Uh down about 5% just in five trading days, uh and overall, uh seeing a much larger move, almost about 10% here in just the past few weeks.
Uh so we’ll go ahead and leave it there for today. Once again, this has been the hot stocks outlook for October 10th, 2025. Thank you all for watching. Best of luck out there and bye for now.


