


Register for a Free Live Training
Hot Stocks Outlook uses VantagePoint’s market forecasts that are up to 87.4% accurate, demonstrating how traders can improve their timing and direction. In this week’s video, VantagePoint Software reviews forecasts for Intuitive Machines ($LUNR) , Centerra Gold ($CGAU), Ciena($CIEN), Intercontinental Exchange ($ICE), Regions Financial ($RF)
VantagePoint A.I. Hot Stocks Outlook for October 17, 2025
Hello again, traders, and welcome back to the Hot Stocks Outlook for October 17th, 2025. Hope you all have had an excellent week out there in the financial markets.
And, as always, we’re here to take a look at the most recent VantagePoint A.I. predictive forecast. So, if you haven’t already, be sure to go ahead and click the link down in the description below and get signed up for a live demonstration. You can learn all the specifics about how these predictive indicators and technologies are helping traders make much better trading decisions out in the marketplace.
Intuitive Machines ($LUNR)
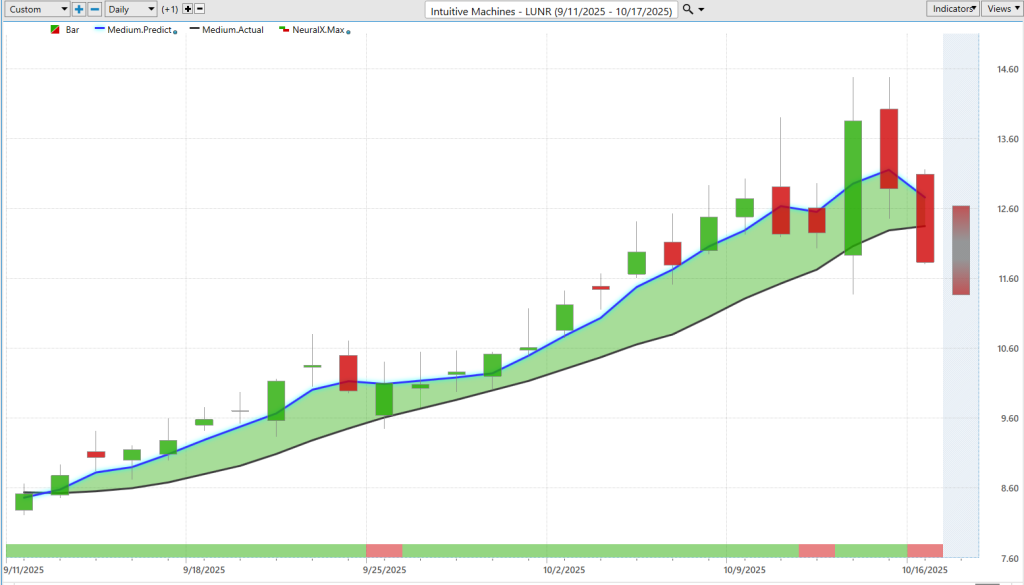
Now, we’ll go ahead and start out with shares of Intuitive Machines ($LUNR) — a really good example of how all of these predictive tools work together.
What we’re looking at here are daily bars and candles. Right? So, each one of the candles on the screen represents a full and complete trading day. And, right up against that price data, what will stand out is that there is a black line and also a blue line value.
The black line that you’re seeing there is actually a simple moving average. This is a very common technical analysis indicator. In this instance, what it does is just look back over the previous ten closes, add those all together, and then divide by that number.
VantagePoint traders are able to use that as a baseline, letting us smooth out the existing price action—letting us know where market prices have been. But obviously, traders want to be ahead of the next move in the marketplace.
What VantagePoint traders are able to do is compare what we might call a lagging or actual moving average to this VantagePoint proprietary predicted moving average. We can think of this as a future price that’s going to get calculated and plotted on the chart every evening.
Whenever we see this blue line value move above the black line value, that suggests these average prices are going to start moving higher. As long as that remains the case—as long as that blue line remains above the black line—we expect the overall trend to continue higher.
We see this market, since we get that forecast coming through, actually rally about 67%. We’ve come off a little bit over the past couple of days, but when we round out the entirety of these predictive indicators, they can help traders adapt to shifting market conditions.
At the very bottom of the chart, you’ll notice this bar that goes from green to red and back to green. This indicator also utilizes neural network technology, but it’s tuned to solve a different problem—in this case, short-term strength or weakness over the next couple of trading days (about 48 hours).
So you’re getting this combination of the overall trend in combination with the predicted high or neural index here—a 48-hour prediction of strength or weakness in the market.
Lastly, you’re provided a predicted range: a predicted high and a predicted low before each and every trading day. This is where things get exciting. When we look at how accurate those predictions are against the actual market data, we notice a new predicted high and low range that will eventually fill in with the actual data.
When traders can identify a new opportunity and use these levels to establish a position, that really helps pinpoint entries and make the most of trading opportunities.
Even as we get this big expansion in the range and this blowoff top here, we move down to this predicted low. The next trading day, it’s telling you, “Hey, expect the range to go higher.” You get this really strong move, and the software does a great job of adapting.
Notice how the ranges are getting larger to accommodate for that volatility coming into the market. So, a really exciting move there in shares of Intuitive Machines ($LUNR).
There’s been a lot of really great opportunities spread throughout the marketplace. You see about a 50% or 60% move until more recently, where we’re starting to see some weakness spread throughout the market.
Centerra Gold ($CGAU)
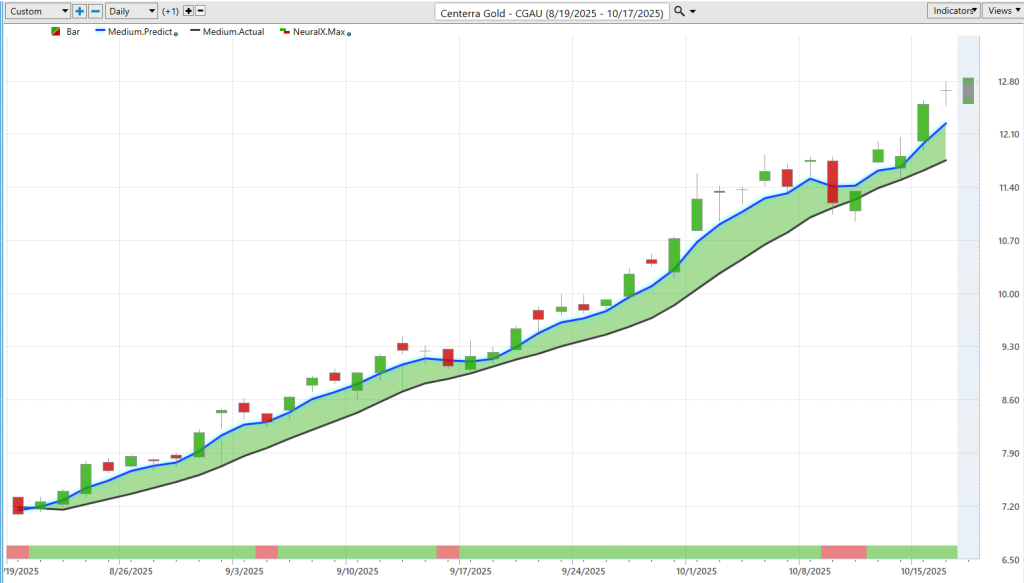
Now, one of those areas where there’s been pretty persistent strength is in the gold markets. A lot of different gold mining stocks are doing extremely well. Here in Centerra Gold ($CGAU), same exact approach: we have that blue line and the black line, all of these individual daily candles representing a full trading day.
What’s interesting about this is we can look back and say, “Okay, how accurate again are all of those predicted high and low levels?” Once you identify that the trend is up, you can make sure you’re taking bullish positions over this 75% rally over the past 40 trading days, using those daily updated tools like the predicted highs and lows to establish a position.
We see as this move gets started—it moves down towards these predicted lows—and within the next trading day, you’re seeing that trend continue higher and shares go up more and more.
You see days like this, where sometimes it happens through a weekend: you come down to a predicted low, and then the uptick begins, and the market starts moving higher once again.
We’re really starting to see some gaps in the chart and very aggressive pushes in price. So, a really exciting move there. Whether you trade gold miner shares or the gold commodity itself, VantagePoint produces some highly accurate forecasts here.
You see about a 73% rally in the past 40 trading days.
Ciena($CIEN)
Now, tech stocks have also done really well. Here’s Ciena ($CIEN) Corporation—a really nice example of some of these tools getting bullish before earnings.
We see a lot of that strength coming into the market. There’s a little bit of weakness over the subsequent 48 hours, but pretty much a perfect forecast as far as the overall trend—neural index bullish—and then we get all that noise around earnings.
What the software is really good at is adapting—understanding that there’s been a huge move because of that volatility catalyst around earnings. The software does a great job of pinpointing those predicted highs and lows so traders can keep trading and navigating that market effectively.
Again, you see here that big move, then the software doing a good job of showing where some places of value are to establish a position if you want to get on the bullish side of the market.
Shares are doing extremely well here in Ciena ($CIEN). This is actually a stock that did really well coming out of that April bottom and has continued higher—about an 84% rally here in the past 35 trading days.
Intercontinental Exchange ($ICE)

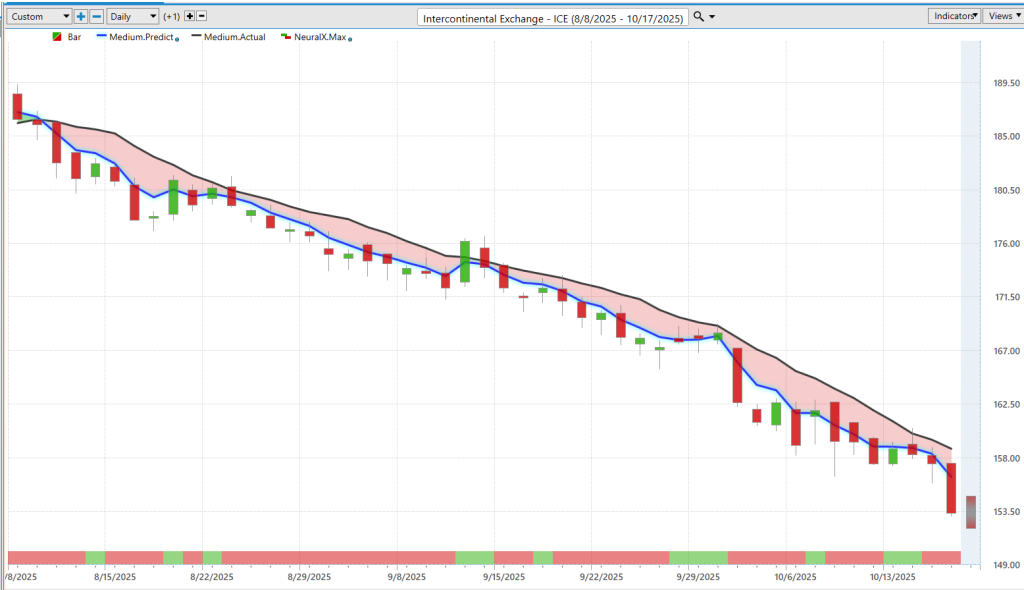
Now, there is some weakness spread throughout the market. We looked at Home Depot and Reddit a couple of weeks ago. Here’s Intercontinental Exchange ($ICE).
When we don’t have markets in an uptrend, as we’ve seen with the previous examples, well—markets can go down as well, and we want to be aware of where those areas of weakness are so we can either hedge the portfolio or avoid those markets altogether.
Here you see ICE down, with that predicted moving average moving below the actual moving average. You’ll get periods where the neural index goes bullish, and you tend to get sideways price action or retracement over the next couple of trading days.
But as long as that blue line remains below the black line, you’d expect the overall trend to continue lower.
Here we see shares down about 16–17% in the past 47 trading days, going into potentially some more market volatility and weakness. These predicted highs and lows—pretty much every day—give a new level that says, “Okay, if you want to come into this market, look to exploit the bearish side. Where are some advantageous price levels to take a position?”
We see even this past week—Monday and Tuesday—moving up towards the predicted high and then that downward trend continuing to persist and play out.
Regions Financial ($RF)
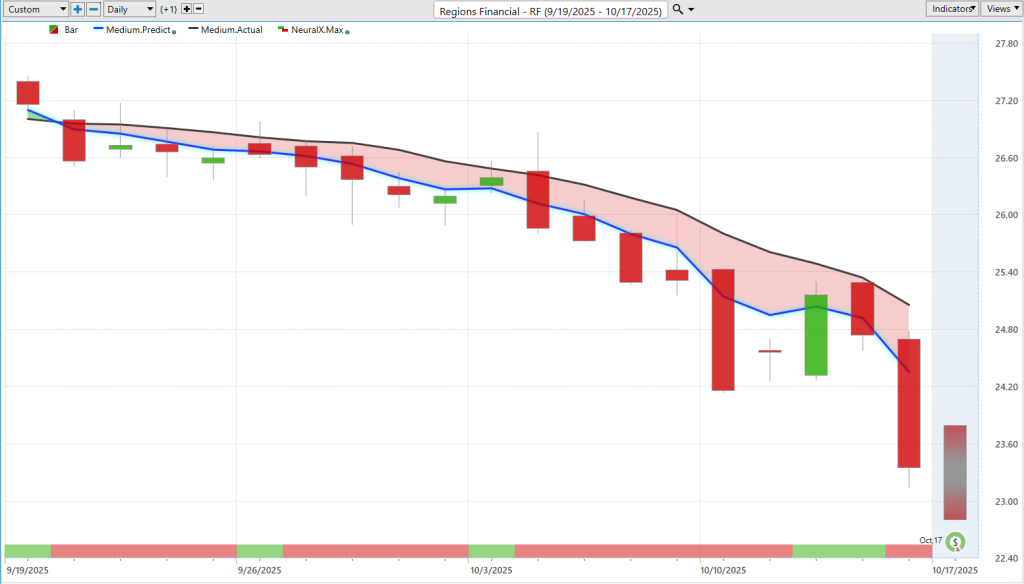
Lastly, in financials, we see Goldman Sachs, J.P. Morgan, and a lot of these stocks starting to turn lower. We want to keep a close eye on this throughout the financial space.
Here in Regions Financial ($RF), we see very clearly the blue line below the black line. Again, these neural index periods show that you get a bounce for a couple of trading days, but there’s now a lot of separation between that predicted moving average and the actual moving average.
Of course, when we take this down to the intraday level, we’ve got clearly defined levels that say, “All you’d want to be doing here is shorting, taking profits on shorts, or getting out of long positions if you have any left in the portfolio.”
Very clearly, this market is moving into a downtrend. You see about six opportunities here to get on the bearish side of the market, and shares continue to go lower.
We’ll see how much of this persists, or if it starts to spread throughout the broader market. Certainly, some signs of volatility—so you want to be a little careful going through the next couple of trading weeks.
Down about 13% here in shares of Regions Financial ($RF) and very clearly still in that downtrend.
So, we’ll go ahead and leave it there for today. Once again, this has been the Hot Stocks Outlook for October 17th, 2025. Thank you all for watching. Best of luck out there—and bye for now.


