


Register for a Free Live Training
The Hot Stocks Outlook uses VantagePoint’s market forecasts that are up to 87.4% accurate, demonstrating how traders can improve their timing and direction. In this week’s video, VantagePoint Software reviews forecasts for SPDR SPY($SPY), Pulte Homes ($PHM), Wingstop ($WING), Travelers ($TRV), Kohl’s ($KSS), Xencor ($XNCR), Boeing ($BA), McCormick and Company ($MKC)
SPDR SPY ETF ($SPY)
.
“Hello again, Traders, and welcome back to the hot stocks outlook for October 6, 2023. Hope you all are having an excellent week out there in the financial markets. As always, we’ve got plenty to cover here in today’s Outlook, so if you haven’t already, make sure you go ahead and click on that link in the description below, and you can get a live demonstration and learn more of the specifics about how all these predictive indicators can help you make those better trading decisions day in and day out in the marketplace.
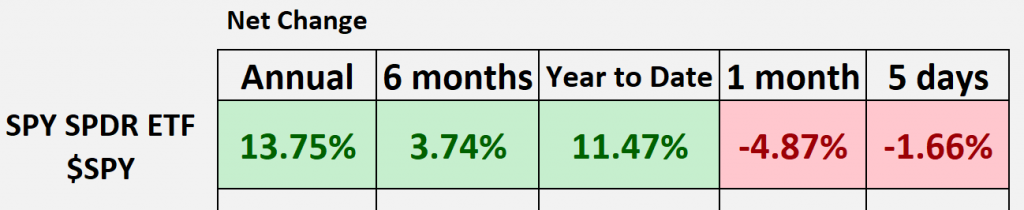
So, as we typically do, we like to take a look at the SPY and just get a sense of the broader Market. Where are things? SPDRs ($SPY)? And so, what we can see here is just from the SPY forecast from Vantage Point for the past 15 trading days, you’ve been in a very strong downtrend, and the Market’s down about 5% since that blue predictive moving average crossover crossed below the actual moving average crossover.
I just wanted to highlight again, we can look at our predicted highs and lows that we look at week to week, and you see early when this weakness came in, how these predictive levels do an excellent job of guiding the trader forward and knowing that, look, you want to short, take profits on short positions.
So, as we look more broadly at that SPY ETF, well, we can see that, okay, well, we’re up about 14% going back 12 months, but that year-to-date number has really gotten chipped into, right? So, we’re starting to see some generalized Market weakness pulling down individual shares. And this is why, as a Trader, you need to be very careful and have the best tools available so that you’re making sure that you’re making those good trading decisions and adjustments to the portfolio.
Here we see again that SPY ETF, very, very bearish. But now let’s look at some individual opportunities forecasted from Vantage Point and highlight how all of these predictive indicators work together. And so, you see that this chart here looks very similar to that SPY ETF. And this is really the magic behind what Vantage Point is doing is that to generate all of these predictive indicators, whether it’s your predicted moving average Crossing above or below, giving you that Trend Direction, your predicted neural index at the bottom of the screen, or these predicted high and predicted low values. Well, what’s happening is Vantage Point’s Technology of artificial neural networks are performing what’s called intermarket analysis on the target market in question.
And what it’s able to do is look at Market relationships like maybe the SPY ETF, maybe other Home Building stocks like Lennar or DR Horton, maybe it’s looking at ETF groups that are important to the capital goods space. But it’s also able to look at very important things like the macro side of the market, like what is the dollar Index doing? And that’s been huge for this generalized weakness you see in stocks, certain currencies, commodities like gold under pressure. And so, it’s able to take this really Global approach looking at how other markets are known to drive and influence the future price of Pulte, and then it uses predictive data generated via that artificial intelligence and uses that data to generate its predictive indicators.
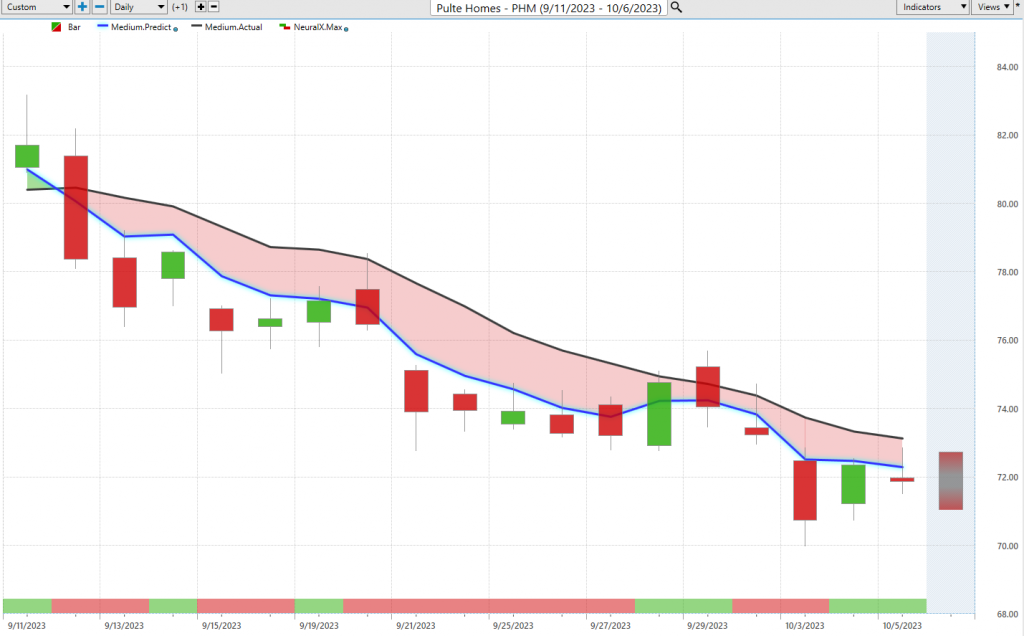
So, this is what’s really special here is when we look at Pulte Homes ($PHM). What we have here with this black line and blue line value is the black line value, that’s a regular simple moving average. So, in this case, it’s a 10-period simple moving average. You just take the 10 Close prices, add them together, and divide by 10. And what that does is smooth out the existing price action for Traders. But what we want to know is where are market prices headed next? And so, that’s where we utilize Vantage Point’s predicted moving average. And again, for this number to get calculated and plotted, essentially a future average price is moving forward. That’s where that technology behind the scenes is looking at okay, well, how is PHM specifically affected? How are these intermarket relationships like the dollar, like the S&P, like the home builder ETFs affecting the future price here? And it’s going to skew these indicators. In this case, we see bearish, letting you know that look, the future average prices are expected to go lower. You may want to short, take profits on shorts or maybe take profit on your long positions.
So, from there, you see that since that blue line crosses below the black line, similarly to the S&P 500, well, what have we seen here in shares of PHM? Well, you know, 18 Trading days, shares are already off about 10%. So, as a Trader who’s maybe you’re short-term, maybe you’re trading options, maybe you’re adding to positions, well, this is where Vantage Point is very effective to identify this generalized weakness coming in and then use things like Vantage Point’s predicted neural index, you see at the bottom of the chart, this being a highly accurate 48-hour predictive indicator and combining that with Vantage Point’s predicted high and predicted low. So literally an intraday range of where market prices are expected to trade. And so, when we look at all of those values and understand look, the overall trend is down. We may get these moves higher towards the predicted high, but that is the predicted high, right? Where we expect the market to trade at the high end for the day. And you see about 1, 2, 3, 4, 5, 6, 7, even eight entries as this Market continues some weakness.
So, you see again, neural index getting bullish. You may see some sideways price action or again, movement towards those predicted highs like we had back here and here. But the overall trend is still down, and therefore, you want to short and take profits on shorts.
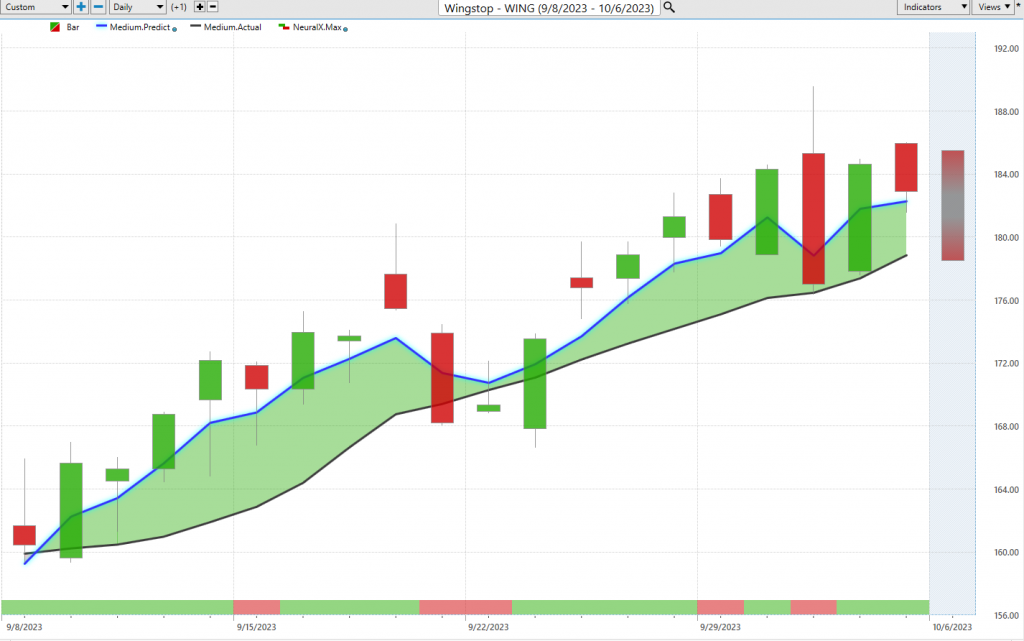
Now, we haven’t brought through too many bullish opportunities. And I even want to highlight just the couple that we have, Wingstop ($WING), to show the differences here and how Vantage Point is highly effective here. Well, here with WingStop, we highlighted this Blue Line crossing above the black line, right? So, this happened quite a while ago, really at the beginning of September. And we get all of those predictive tools doing a great job here of saying, okay, well, look towards Vantage Point’s predicted lows to accumulate a position. And you see that early on, you get a really great entry. I mean, the average price is probably about 163 here. You get a little bit of a dip here going into the weekend, but that blue line never crosses below the black line. Not only that, but you see that your neural IND gets bullish, and we see this strength actually playing out in the marketplace, specifically here in Wing Stop. But this is very few and far between, right? There’s not a lot of extremely bullish opportunities out there when you have the S&P weighing down on things.
But even in this case, you see about a 133% rally in the past 19 trading days.
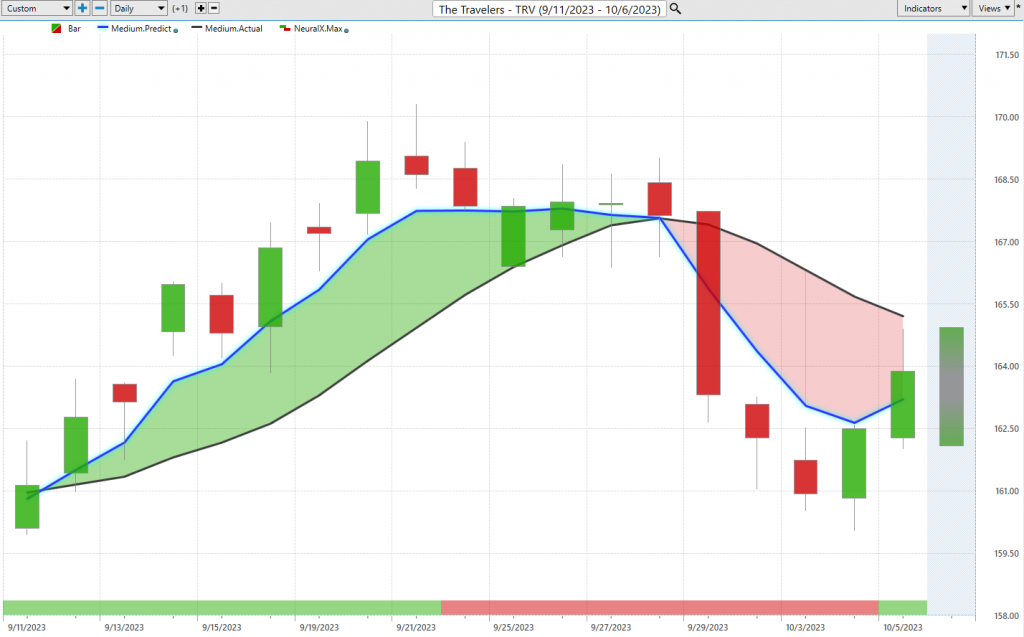
Now, this opportunity we brought through almost at the exact same time as Travelers ($TRV). And what I want to do is highlight the difference in these forecasts. So again, you see this Blue Line crossing above the black line, highlighting a really nice opportunity to get involved. And it’s those predictive indicators that allow you to say, okay, well, down towards these predicted lows would be a great place to accumulate that position. If you’re a short-term Trader, you get plenty of opportunities to take profit up near these predicted highs over the course of the trade. But what you see here with the neural index is highlighting that short-term weakness coming into the market. So you understand that expect weaker prices if you want to go ahead and be aggressive and look for momentum and wait for that neural index to get bullish.
But what we’ve understood as well is that the markets are quite weak through this period. Right? You want to be very careful with the opportunities you get involved in. And if that Blue Line’s Crossing above the black line, well, just get out at your entry. Break Even trade, maybe make a little money over the period, but be quite cautious when these predictive indicators start to skew against your position.
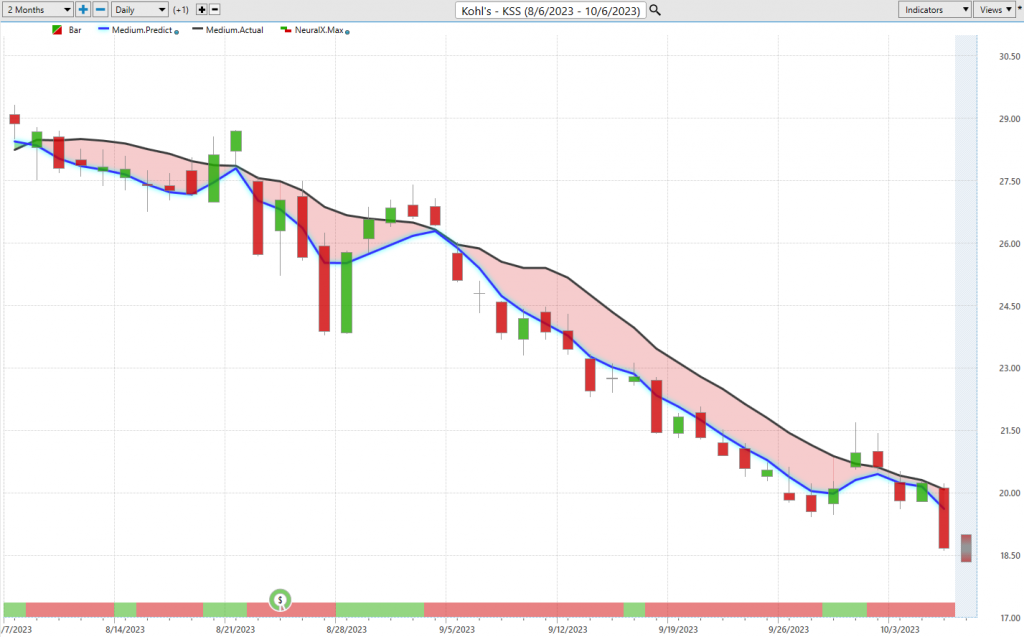
Here, shares of Kohl’s ($KSS), and again, you see some more of this persistent weakness in the market. That predictive Blue Line crossing below the actual moving average indicating there’s some weakness here. And we’ve got, you know, a retail stock here. Well, you’ll get those little blips where you see the neural index goes bullish. You see you get these really about a week of rally here. But what is that really warning you of? Short-term strength in a bigger move to the downside. And of course, you’d want to use things like those predicted highs and predicted lows to really fine-tune those entries if, in fact, you wanted to maybe set some short positions in the market. So, you see that the overall trend is down, and you get these little blips here where you see that even on this trading day, right? So before this trading day occurs, you have this predicted high and predicted low range slanted up saying, look for prices to move higher here. But is the trend up? Well, clearly not. The trend is clearly still down, as you see that blue line remaining below the actual moving average, and shares off about 34% in the past 42 trading days. This is the stuff that is again not few and far between. Right? There’s a lot of really, you know, entire sectors that look quite weak, and you’re seeing a lot of charts like Kohl’s here where the markets are in a downtrend. You don’t want to get involved as a Trader, and it may be pretty disastrous here, as you see again shares just slipping day after day after day and things potentially getting more aggressive here with, again, dollar advances, volatility coming into the market.
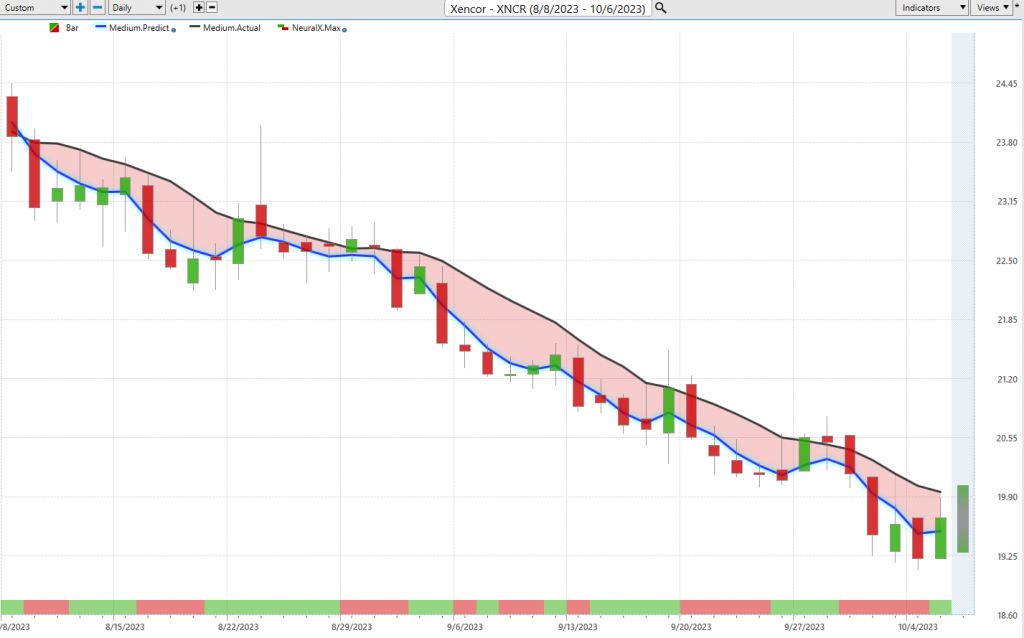
Here, shares of Xencor ($XNCR).
Xencor ($XNCR) was actually a bearish opportunity we looked at really a couple of months ago, so really, you know, sort of a midpoint probably in this chart. But has anything shifted here? Right? So, with that general market weakness we’ve got a biotech stock here that really just cannot get off the mat. And you see here how you’ll get these periods where the neural index gets bullish, you get these little sideways portions of price trading. But the momentum picks up again, and the trend is very clearly to the downside. So, as we look at all of these predicted highs and lows, even as volatility really increases through here, it’s indicating again, expect that predicted range to move higher. But is the trend up? Well, clearly not. You’d want to short, take profits on shorts, and again, you see how these predictive levels do a great job if you’re trying to get excellent entries to short but also to take profit on the lower end. Right? So you constantly come down to these predicted lows. You usually see a little bit of a bounce in price, and you can reset that position and again, manage the trade most effectively here.
So, shares of Xencor again not having a good couple of months, you’re off 20% just in the past 41 trading days. Again, just 500 shares, it’s about a $2,200 move. So these are not subtle or small little moves that we’re seeing play out here.
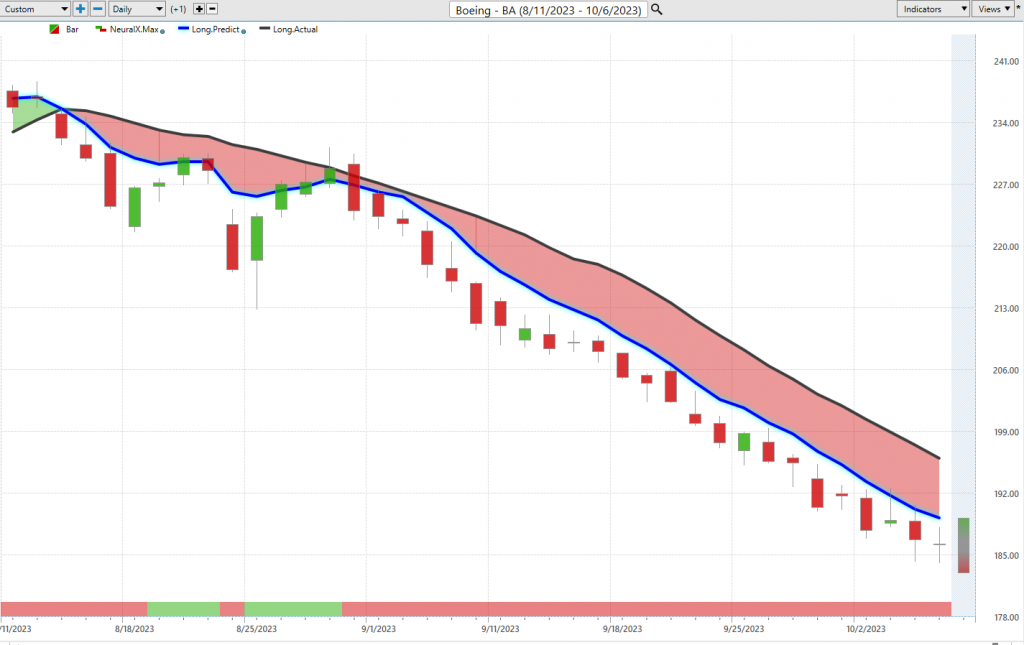
Here’s a big stock here with Boeing ($BA). So, we keep bringing this through week after week, and a perfect example of how these predictive indicators do a great job of getting you ahead of what’s going to occur next.
So here we see that Blue Line crossing below the black line, and look at your neural index here. We keep coming back to this week after week and going there is literally nothing in the way of the neural index getting bullish. And there’s not even, I mean, you’ve got barely one upday out of this whole grouping here. So another two weeks where Vantage Point keeps forecasting that Boeing’s going to keep sliding lower, and sure enough, we’ve seen some pretty aggressive weakness here. Shares off about 17% in the past 24 trading days. Again, the past two weeks where this neural index has stayed bearish, you’re down about another 6-7%, and this just looks pretty dreadful. Right? These things can accelerate, and you do not want to be on the wrong side of this.
Lastly, here, just to round things out, again, this generalized weakness we’ve seen again like the S&P, here’s McCormick ($MKC). So even Consumer Staples here, you got this Blue Line crossing below the black line, really at the beginning of September, a little bit of sideways price action. You know, great example of this combination of these indicators. Look, the trend is down, but that neural index gets bullish. And what happens? Well, now you’re running sideways, neural index gets bearish, and whole momentum picks up to the downside. And here we have actually earnings and volatility, but clearly Direction down. You only want to short, take profits on shorts, you know, whether it’s on the individual stock, we see it on the macro side, we see dollar going up, and this is where Vantage Point does a huge benefit for Traders.
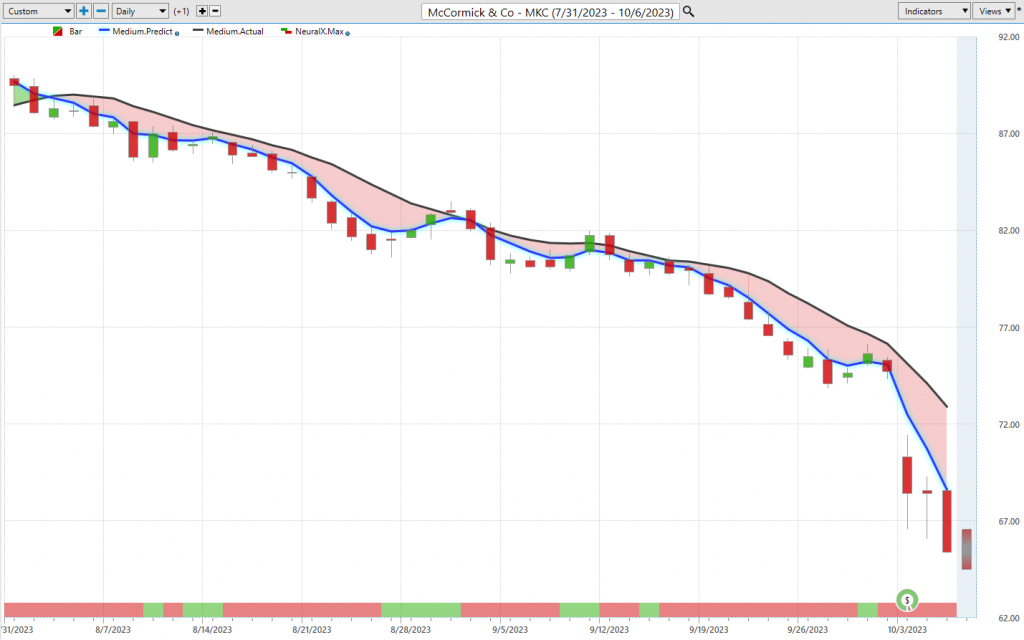
As behind the scenes, well, specifically McCormick and Company is known to be driven and influenced by prices of other assets. Maybe that is dollar ETF, S&P, other consumer state stocks. But what’s happening here is all of those global market relationships are weighing on this stock. And as the trend goes lower, and that predicted moving average starts to skew away from the actual, and that neural index gets bearish, well, that’s where all those global market relationships are weighing on the asset. And it’s likely that, you know, a trend-wise, we’re going to get that move in the direction that things have been persisting in. So, again, be very careful here with the stocks you’re getting involved in unless you know you’re shorting and taking profits on those shorts, maybe you’re trading currencies, some really nice opportunities there.
But you need to be very careful and be aware of this volatility and have the right tools to make those better trading decisions, whether it’s a bullish environment, bearish environment, there’s really money to be made on both sides of this.
So, once again, this has been our hot stocks outlook for October 6, 2023. Thank you all for watching. Best of luck and bye for now.


