Hot Stocks Outlook for the Week of
September 20, 2019
The Hot Stocks Outlook uses VantagePoint’s market forecasts that are up to 87.4% accurate, demonstrating how traders can improve their timing and direction. In this week’s video, VantagePoint Software reviews forecasts for Southwest Airlines(LUV), Advanced Emissions Solutions(ADES), Seagate Technology(STX), and Briggs & Stratton(BGG).
This Week’s Hot Stocks Outlook
Good afternoon traders, and welcome back to the Hot Stocks Outlook for September 20th, 2019. Hope you all are having an excellent week out there in the financial markets, and as always, plenty to cover in this week’s outlook. We’re going to be taking a look at some of the additional features found within the VantagePoint software today. But to get started, we’ll take a look at shares of Southwest Airlines. We’ve got Advanced Emissions Solutions, Seagate Technology, which we took a look last week, and also Briggs and Stratton here.
Southwest Airlines(LUV)
So starting here with Southwest Airlines, what we have here is daily price actions. Each one of these candles represents a full and complete trading day, and what we have is a few indicators right up against that price action. Now, you’ll see that there’s a black line and also a blue line against those daily candles. Now, the black line that you see on the chart, that is a regular, or what we would call the actual simple moving average. So very common technical indicator just looks at past prices, adds them all together, divide by that number, and you really smooth out that data of where past prices have been in a given asset. But of course as traders, we need to know where are prices moving going forward?
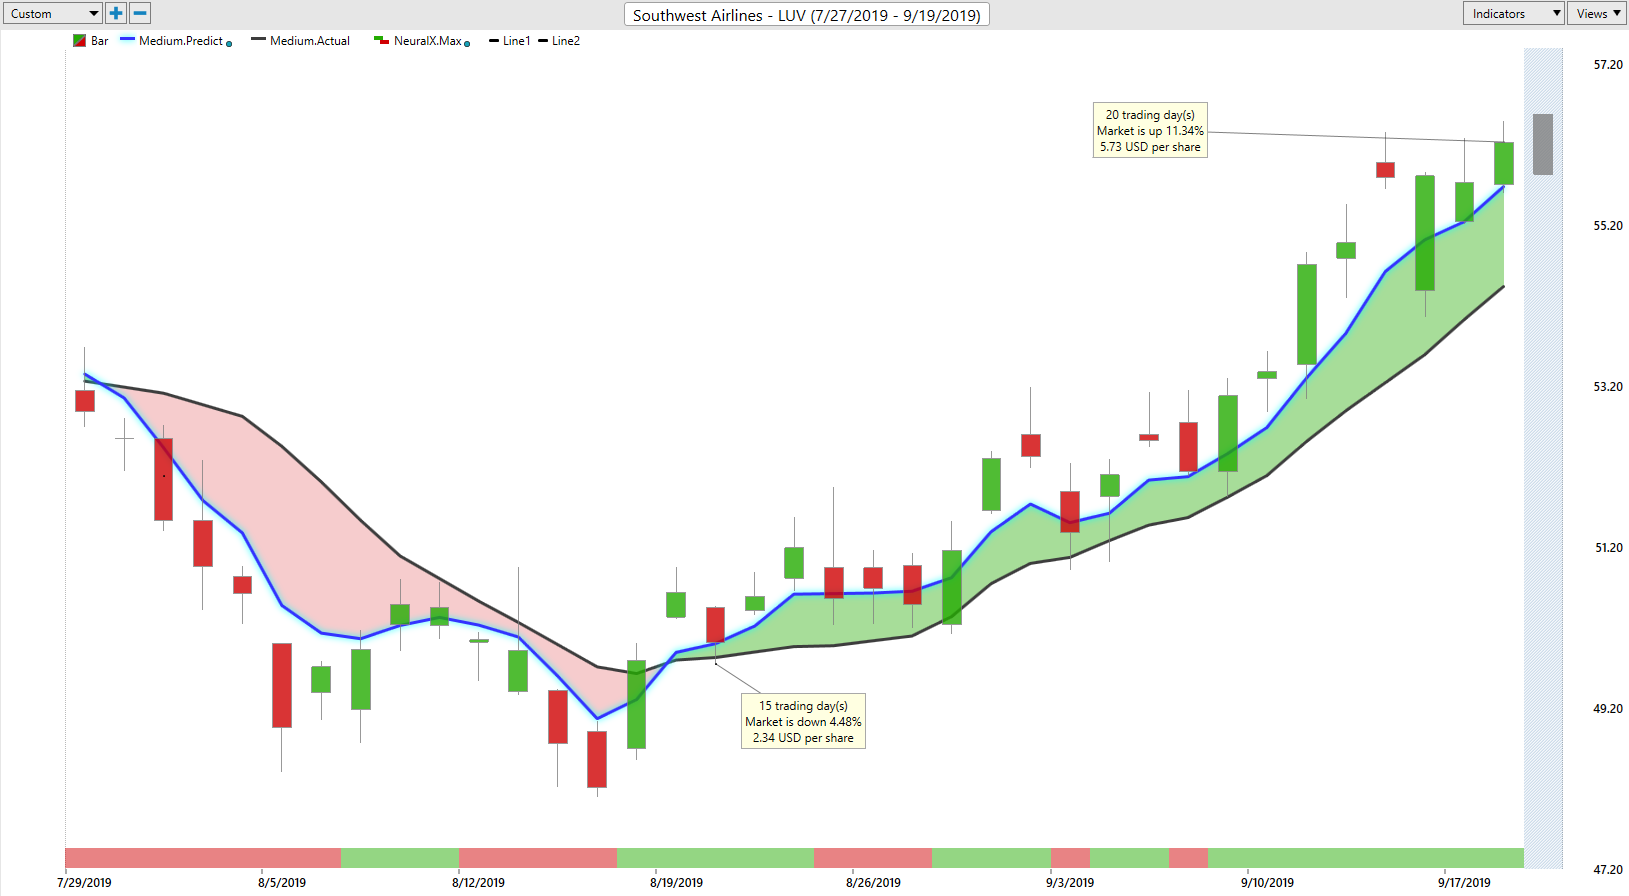
So what we want to do is actually compare that black value, or that simple moving average, to this blue value that you see on the chart. And for that value to be generated, VantagePoint is performing what’s called intermarket analysis. It’s actually using the technology of neural networks, a type of artificial intelligence, to understand how intermarkets, or things like other related stocks, ETF groups, crude oil, the dollar index, interest rates, how all those other markets are affecting and influencing the future prices of Southwest Airline. And all that information is used to actually generate future prices that are then used and incorporated into the value of this moving average, turning it from a lagging indicator into a forward-looking predicted moving average. So whenever that blue line crosses above the black line, it’s suggesting average prices are expected to start moving higher, and you’d therefore want to get long in the market.
Now, in addition to that predicted moving average, there’s other indicators here that are also derived via that neural network process, most notably being the predicted neural index at the very bottom of the chart here. , is an extremely accurate 48-hour indicator, so it’s only looking ahead 48 hours or two candles at a time, and letting you know about short-term strength or weakness in the market. And lastly, again, another one of these indicators are going to derive from this technology of a predicted high and low. So actually providing intraday predicted high and low levels that you can go ahead and take action from, understand where your limits, where your profit targets should be, so that you can manage that position effectively.
Now, taking a closer look here at Southwest Airline, we see, well what happens? We get that blue line crossing above the black line, neural index up at a one, and of course this is telling us, look, the market’s expected to move higher, use tools like your predicted neural index to get that view of the next 48 hours of strength or weakness, but also the predicted highs and lows. And so we can actually go back and see how accurate each one of these predicted highs and lows are against the actual day it was forecasting, and you see just how effective these tools can be at helping you get a really great intraday price, not chasing things down, but still getting involved in that overall opportunity. So you see you have these days where, really nice entry here, you get that move higher, but you don’t want to be chasing this market. Here you see you get this pullback, really nice entry, and immediately moving higher once again.
So really great opportunities opening up to the bullish side of the market, really all throughout equities here. But taking a look at this opportunity specifically, we’ve got shares of Southwest up over 12% just in the past 21 trading days, and this works exactly the same. So whether we’re looking at Southwest Airlines or Monsanto stock, or Advanced Emissions Solutions, which we’ll take a look at now, here, the same thing, right? We get this blue line or that predicted moving average crossing above the actual moving average telling us, look, the trend is up, look to go ahead and get involved, obviously to the upside, and use the help of those predicted levels, right? Those predicted highs and lows coming in and saying, okay, well these are great intraday levels to get involved in the market. Even see here the neural index goes down to a zero, predicted highs and lows slant down, say hey, expect a little bit of weakness here, but the overall trend very much to the upside. See that neural index corrects and market breaks out, as all that short-term strength and the trend really working in your favor there.
Advanced Emissions Solutions(ADES)
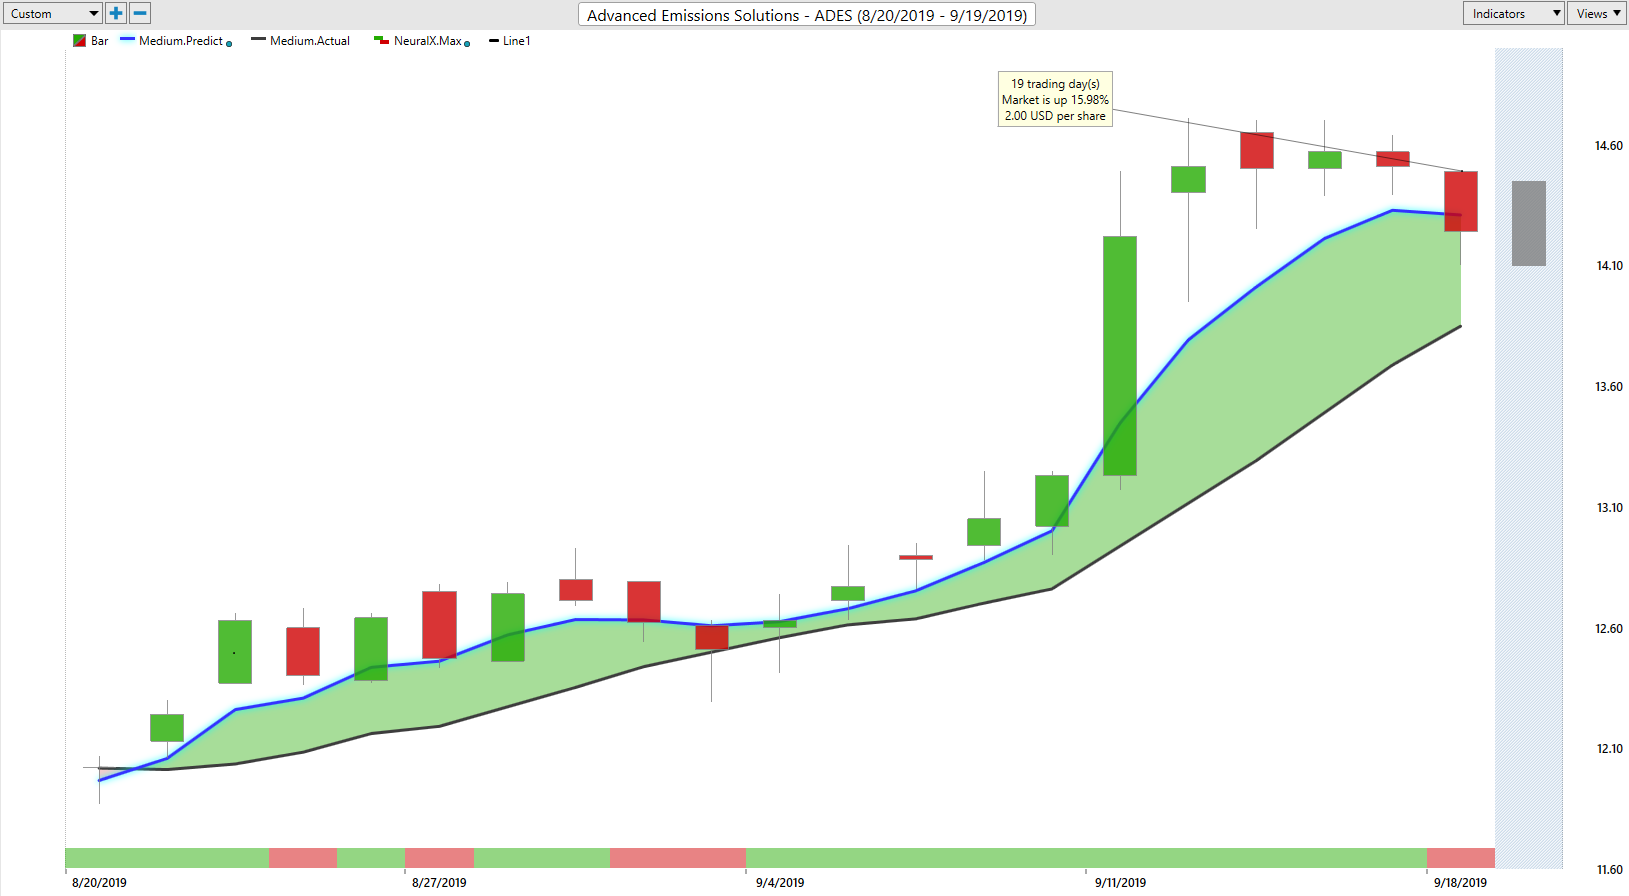
So Advanced Emissions Solutions here, a really nice opportunity to the bullish side of the market here. there are up over 15% just in the past 19 trading days. So what we’re going to do here in a moment is show you how you can identify all of these fresh opportunities, right? So when those crossovers come through and are highlighting that there’s a new trade here and a new trend reversal, you can get involved in those. So Seagate Technologies, and wanted to bring this opportunity in from last week, where… How these things work as far as a trade management tool, so if you go ahead and are long or short a particular asset, you want to know, “Okay, well is this trend continuing? Should I add to my existing position?”
Seagate Technology(STX)
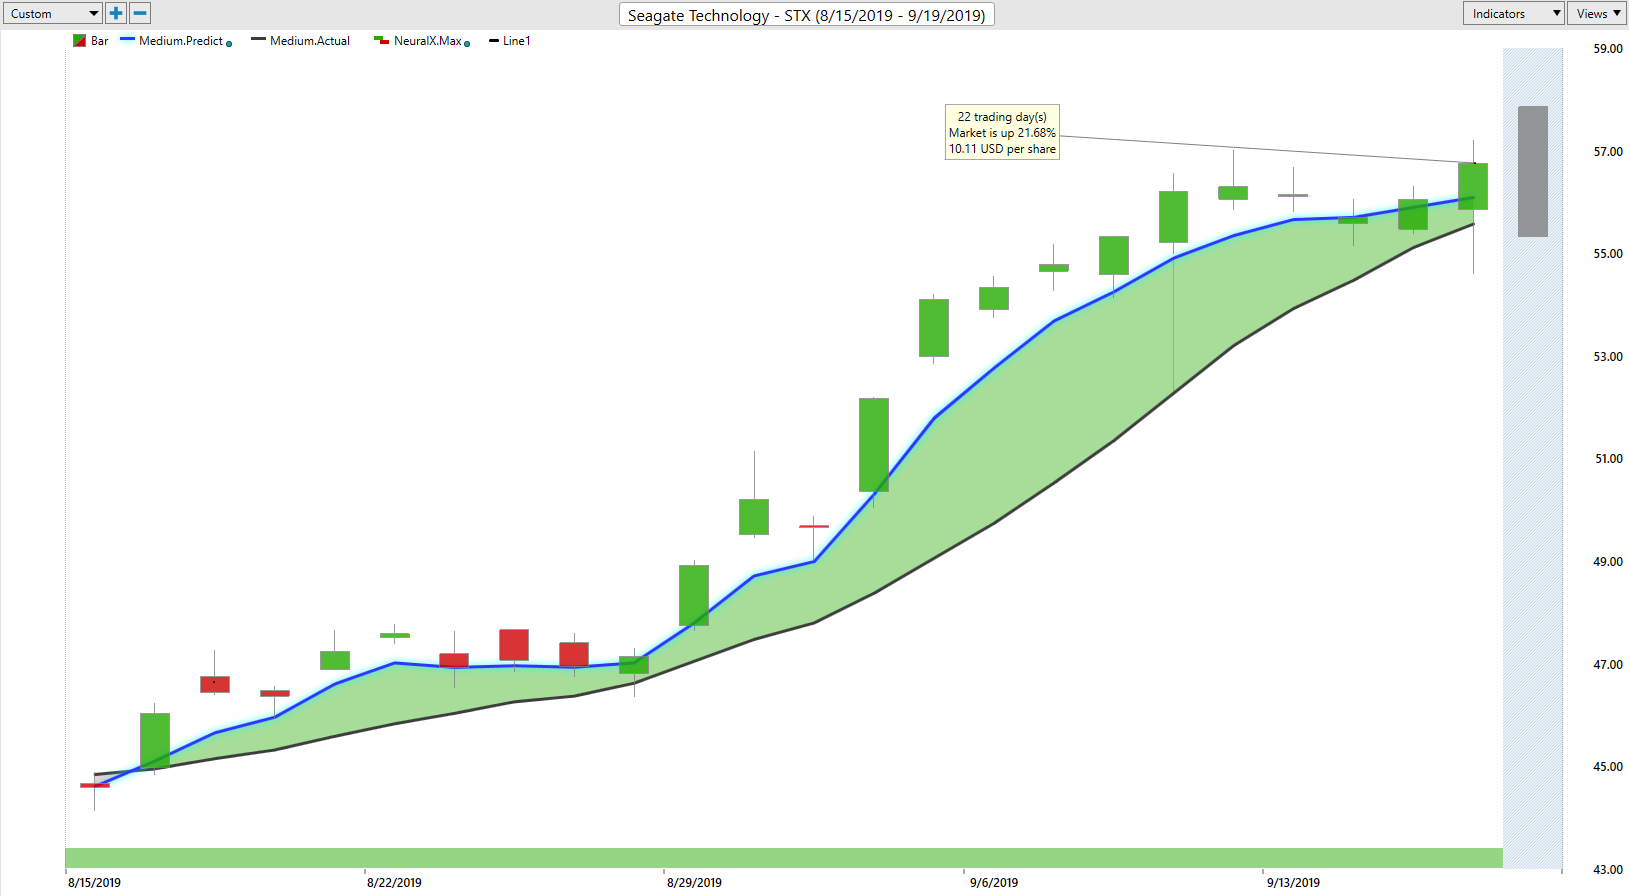
We took a look at this last week, just wanted to go ahead and update these forecasts, where you see that overall, the trend, obviously a very nice move here in Seagate Technologies, and we see some really great opportunities early on towards those predicted lows to go ahead and take a position before we got this huge move higher, shares overall up over 23% to the upside in just the past month, but more recently here again, how these tools work on a day-to-day basis. So if you’re long Seagate technology, you can see, well, these are great opportunities to actually be adding to your position. And you see we get about another 2 or 3% rally there this week with no weakness from the neural index at all. So letting you know that those subsequent 48 hour periods, expect some strength and a continuation of that trend.
Briggs & Stratton(BGG)
Lastly here, we’ll go ahead and end on shares of Briggs and Stratton. Before we go ahead and show you that IntelliScan feature, which we’ll get to, but you want to determine, “Okay, well is a trend continuing, like Seagate Technology, or are things reversing?”
So here are shares of Briggs and Stratton. We saw so much of that weakness coming in August, crossovers to the downside, neural index bearish. You see, we sort of level out here with the neural index, but once that neural index gets weak, once again, you see just a really dangerous situation as the market gapped lower. But you can see how things are changing. So early on getting this 48 hours, expect that strength coming into the market, crossover to the upside so that you can cover that position.
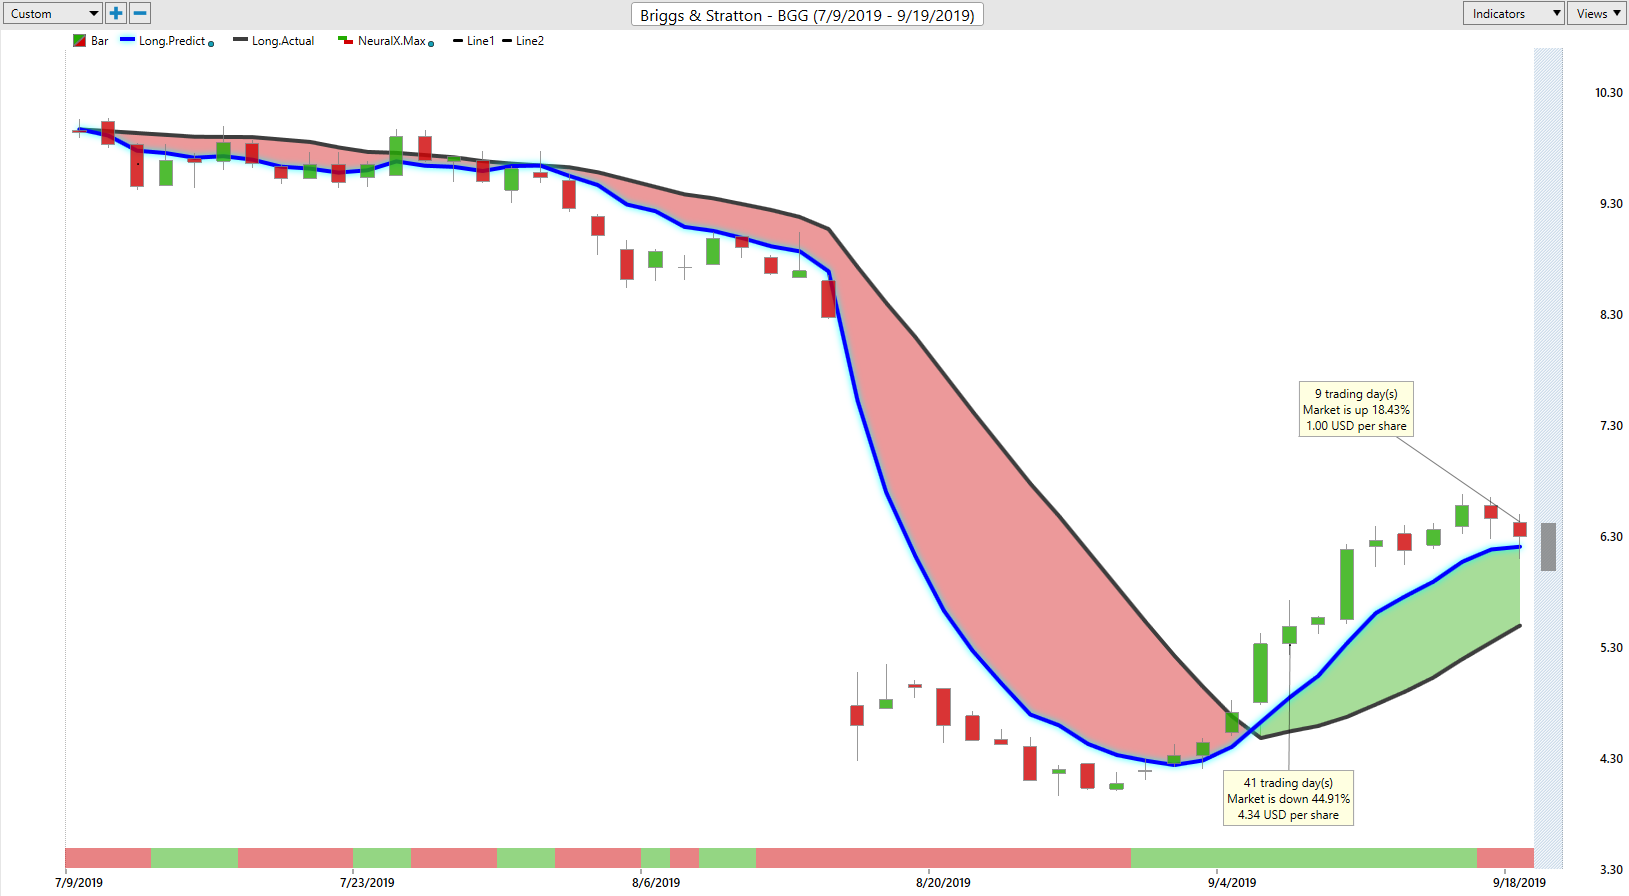
So certainly in shares if things like Seagate Technologies, if that blue line crosses below the black line, you’re going to understand, hey, don’t go ahead and hold those short positions anymore. The market trend is actually to the upside, and we see this market is up over 40% just in the past 11 trading days. So again, a lot of that strength coming in September, and you’ve seen a lot of these shares recover. You want to go ahead and cover those shorts and subsequently go ahead and get long the market, take advantage of this upside that we’re seeing. Now, a lot of traders ask, “How am I going to identify these trading opportunities?” And there’s a really great feature incorporated in the software here called the IntelliScan. We can show you exactly how that works.
So if I go ahead and open up this IntelliScan, we can just start a new one. We’ll take a look at our market tree here, and what we can do is actually add all of these stocks into the market tree. Really if we trade futures or the Forex market or ETFs, whatever you want to scan for and identify new trades, you can go ahead and scan for these bullish or bearish conditions. So if I go ahead and drag all of these U.S. stocks, which is literally over a thousand stocks, hundreds and hundreds of different markets from different sectors, we can go ahead, and you see this very straightforward filter that we have to identify fresh crossovers. So in the case of Briggs and Stratton, that blue line crossing above the black line, that neural index up at a one leading this 40% rally in the share price, we can go ahead and set these conditions here. So if I go ahead and look at the medium-term crossover, we can set this to a value of one, looking for those fresh crossovers in the marketplace.
If we want to look for bullish opportunities, we can set this crossover to the upside. And of course, we want to make sure that neural index is also matching the direction of that predicted moving average crossover. So we’ve got that short term strength in our favor, and there are some other tools that we can incorporate here as far as a shorter-term trend here. So if we want to go ahead and we can set what’s called these predictive differences, we can move those to the upside, and it really narrows down. You see we had 1200 markets, we’re down to only 25, and we can then go through this list and identify areas where we say, “Okay, well there’s a trading opportunity here.” We can open up these charts and identify, “Okay, well you know, what’s this opportunity look like?”
And so we’re going to see things like if we look at, in this case, we’ve got Meredith Corporation, I think we actually looked at this in August as well when we saw, again, all that weakness coming through, sort of similar to Briggs and Stratton here, huge gap down in the marketplace. But we see now what is the software generating? Well, you see that green being created there, that blue line crossing above the black line neural index, that strength indicator over the next 48 hours, letting you know that the conditions have changed. So in the very same way that you have a stock like Briggs and Stratton, which had previously been in a huge downtrend, you want to understand, “Okay, well the environment’s changed. Let’s make sure my behavior and how I’m trading that particular asset changes, and make the most of that opportunity.”
So regardless of whether you’re currently long of stocks, if you’re long something like Seagate and trying to determine, “Okay, well intraday, what level should I be looking to add to my position at?” Or, if you’re a longer-term trend trader and want to determine, “Okay, has that trend reversed and I should go ahead and reverse course in whatever type of trade that I’m taking?” All of these tools are going to really deliver that information to you quite effectively, so you’re not going to be chasing these things down on a one-to-one basis, but really delivered with some of these new opportunities where you can go ahead and look to trade your trading approach on the market. So really great opportunities, again, to the upside over the past couple of weeks we saw, really August, a lot of weakness in September, a lot of the strength coming back in and opening up really tremendous trading opportunities really all throughout the different markets.
But once again, this has been our hot stocks outlook for September 20th, 2019. Thank you all for watching. Best of luck, and bye for now.