Register for a Free Live Training
Hot Stocks Outlook uses VantagePoint’s market forecasts that are up to 87.4% accurate, demonstrating how traders can improve their timing and direction. In this week’s video, VantagePoint Software reviews forecasts for Iris Energy ($IREN), M/I Homes ($MHO), Arrowhead Pharmaceuticals ($ARWR), Opendoor Technologies ($OPEN), Lockheed Martin ($LMT)
VantagePoint A.I. Hot Stocks Outlook for September 12, 2025
Hello again, traders, and welcome back to the Hot Stocks Outlook for September 12, 2025. I hope you all have had an excellent week out there in the financial markets. And, as always, we’re here to take a look at the most recent Vantage Point AI predictive forecast.
So, if you haven’t already, be sure to go ahead and click the link down in the description below, and you can get signed up for a live demonstration and learn all the specifics about how these predictive indicators and technologies are helping traders navigate and make much better trading decisions out in the marketplace.
Uh, now we’ll go ahead and revisit many of the opportunities we’ve looked at in previous weeks because we’ve had some huge moves—uh, specifically here in Opendoor. Uh, the housing market still doing well and biotech stocks actually seeing a nice uplift here. But we’ll go ahead and bring in something new and start with Iris Energy.
Iris Energy ($IREN)
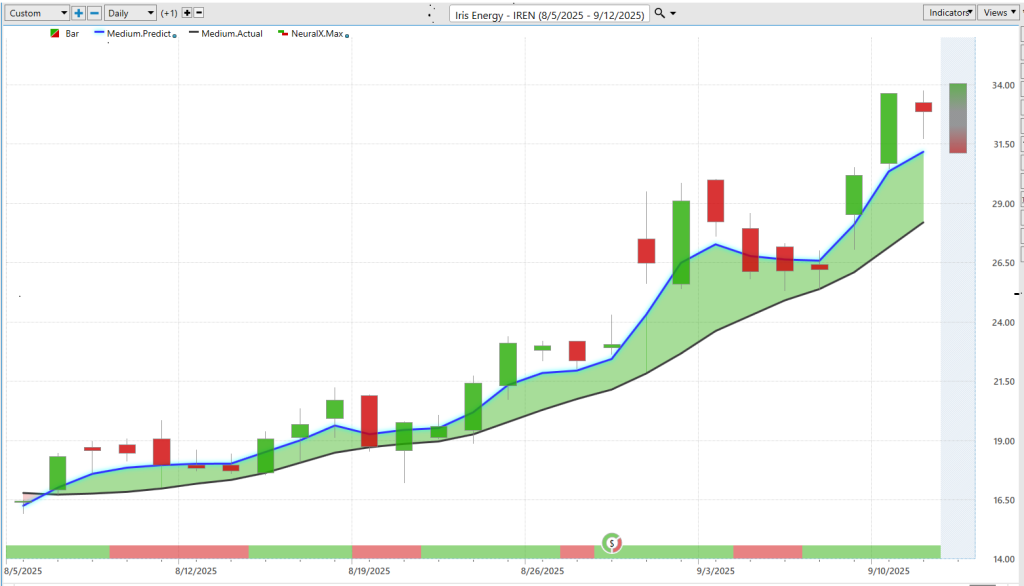
Uh, and this is again Iris Energy ($IREN), always a really good example of how all of these predictive indicators and tools work together and really round out this predictive forecast that Vantage Point provides.
Uh, and so here we see with Iris Energy, what we have here is daily price action. So each one of these bars that you see is going to represent a full and complete trading day. Uh, and it’s right up against that daily price action that you’re going to see that there’s a black line and also a blue line value. So what the black line is is a simple moving average. So this is a very common technical analysis indicator. Uh, we refer to this as the actual simple moving average. Uh, and what this does is simply look back at the previous 10 closed prices, add those all together, and then divide by that number. And it’s a way you can smooth out the price data and just get a sense of where the overall market has been.
And we use past tense because it’s all just reconfiguring what’s already occurred. It has no predictive capability. Uh, and it’s really just summarizing what’s already happened. Uh, and so what Vantage Point traders are able to do is identify the situation where this blue line, or what we refer to as the proprietary Vantage Point predicted moving average, for that to move above price. And so whenever we see that blue line cross above the black line, this is where Vantage Point’s technology and artificial neural networks are coming into play.
Uh, and they’re really based off this concept of what’s called intermarket analysis. And so what that means is that, rather than just looking at past prices like a simple moving average and really all of traditional technical analysis, Vantage Point tools are able to analyze other known markets that drive and influence future prices. So when we look at something like Iris Energy, this can be things like other individual stocks within the market. Now, this, you know, has a lot around AI and data centers and even Bitcoin mining and all these sorts of things.
Um, so this looks at individual stocks within that space. It’s even going to look at ETF groups that sort of gobble up a large number of shares in the market. Uh, but this goes all the way down the line to things like currencies, like the value of the US dollar, uh, global interest rates, and bond prices, uh, and also things like certain commodities where applicable. So this is especially important when you’re looking at gold mining stocks or oil companies.
And so it really takes this global approach, taking dozens of markets into its calculation, then using the data from those markets to generate future price predictions. And so this is what allows traders to get a really early warning sign to when we’re seeing trend shifts in the market and where prices are likely to move. So whenever that blue line crosses above the black line, what’s suggesting that average prices are going to start moving higher, traders would want to look to take a long or bullish position, maybe trade options as far as call contracts.
There’s a lot of different strategies and instruments that one can use to really express those trading ideas. Um, but we see here that since that signal came through, we’ve had an 89% rally here in the last 26 trading days. And we see that trend still very much bullish as far as that blue line remaining above the black line.
Now, that’s not the entirety of the forecast. There’s other tools that really even get tighter and more specific as far as what’s expected to happen next. And so, if you look at the very bottom of the chart, you’ll see this bar. It goes from green to red and back to green. And this gets updated every single trading day for the trader, but it’s solving a different problem than the overall trend direction. This is looking at short-term strength or weakness over the next 48-hour window. So you can think of that as really just a couple of trading days, and it helps traders anticipate some of these sideways movements and consolidations in the market.
You really combine that with the overall trend. And so what we see here is, when that neural index goes bearish, we get sideways price action for these subsequent candles. But notice that the blue line is still very much above the black line. Happens again here. You get this little deeper wick as far as prices going lower. Uh, here we come into earnings, and then here it happens again. We get another situation where the market retraces for a couple days before continuing on pretty aggressively with that trend.
And so this is what helps traders again navigate the markets, know what to expect, and make sure they get the most out of that individual trading opportunity.
Uh, and so lastly, we combine this all with the daily intraday range that’s provided—daily predicted high and predicted low. And all these tools are using that neural network technology and using intermarket analysis to generate these highly accurate predictions. But with artificial intelligence, you can tune it to solve these different problems.
Uh, and so what we do each week is take a look back at these opportunities and say, okay, well, how close were these predicted highs and lows to the actual market data that then is going to fill in? And we’ll see on Friday what kind of price action we get here against those actual predictions. And you see how this all works together—early recognizing the uptrend and having these levels a day ahead of time, right? All this data comes in at 6 p.m. the night before, letting you know, hey, tomorrow’s predicted low, this is where we want to look for prices to move, uh, where we can accept a position.
Even here, you would have gotten filled on the open, prices immediately going higher. Uh, and even just this last week, this would have been Monday going into the beginning of the week, you see a very strong move coming off of that predicted low, and then continuing on in this rally. So, really just this week, you’ve got a 30% move in just the past four trading days.
Opendoor Technologies ($OPEN)
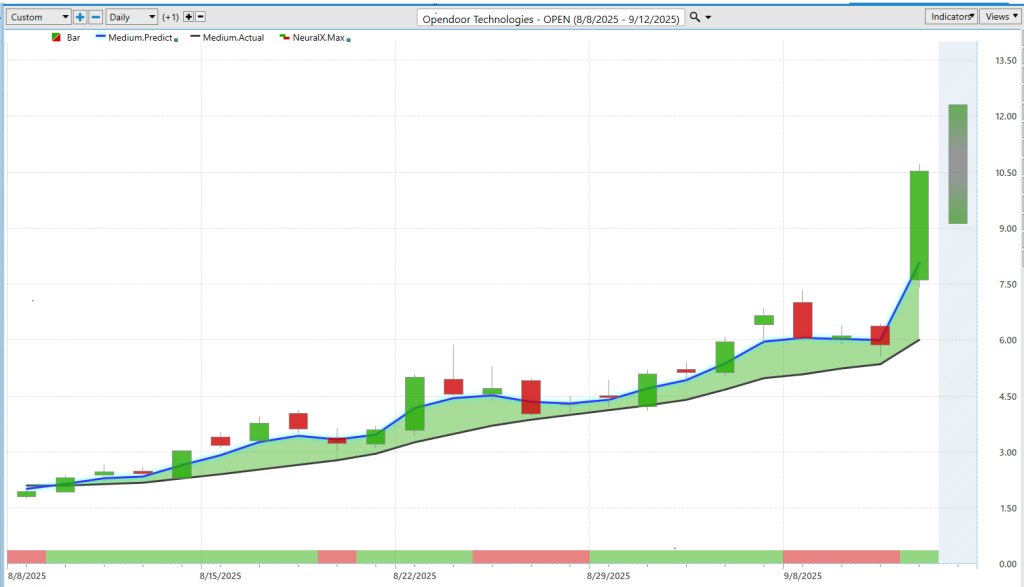
Now next we’ll go over to Opendoor Technologies ($OPEN). So this was a stock we looked at last week, and there’s been a lot of really excitement—sort of the meme stock situations coming back.
And so what we see here with Opendoor is this blue line crossing above the black line. Uh, we looked at this again last week. So what would be the last four candles here when we looked at this, and this is a great example of how these opportunities update and how the forecast updates and helps the trader adapt to those changing market conditions.
And so what we see here is a neural index that’s bearish, warning again of that short-term weakness in the market. But the trend, that blue line, still very much above the black line. And so when we look at these predicted highs and lows, well, just over the last trading day here, moving down to that predicted low and seeing this trend really explode to the upside—a 78% move here in just two trading days.
And really, from the start of this move, where we first hit these predicted lows after that original crossover, now up 357%. So a very exciting move. Certain option traders probably made a lot of money here by getting ahead of this opportunity.
Lockheed Martin ($LMT)
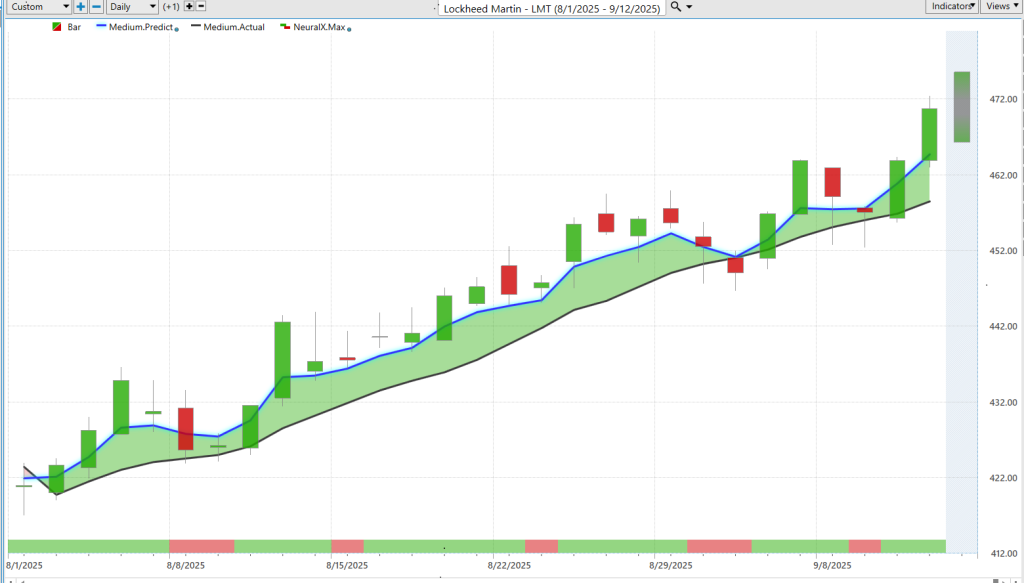
Now, uh, here’s Lockheed Martin ($LMT). So another situation here where we take the exact same logic, and whether we’re applying it to a really cheap penny stock that’s moving with a lot of volatility or a slower-moving dividend-paying stock, uh, it really is all done the exact same way.
So you see here with Lockheed Martin, see this blue line crossing above the black line. Uh, neural index will go bearish here at times, but for the most part staying very bullish and the trend remaining very bullish. Uh, and so we can again examine those predicted highs and lows, and we see how this works.
So, even when you’re getting these sort of sharp consolidations, you know, even before this next trading day, it’s letting you know—expect the range to come down here and really be ahead of that shift in very short-term market direction. Uh, we see we come down to this predicted low, hitting more predicted lows, predicted lows, predicted lows. You see how these wicks just come right back into the range, and then that overall trend resumes to the bullish side.
So, uh, interesting opportunity here in Lockheed Martin, overall up about 11% here over the past 27 trading days.
M/I Homes ($MHO)
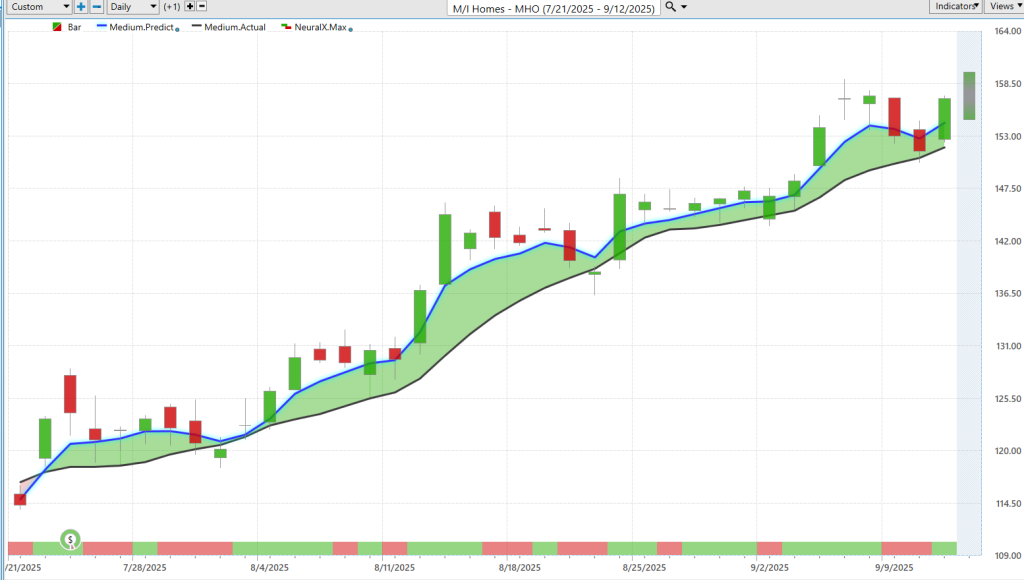
Now, uh, what Vantage Point is really great at is actually identifying, with the help of its Intelliscan, where these fresh shifts are occurring in the market. So, uh, homebuilders have really been a theme here for the past couple of months. And we can see here in M/I Homes ($MHO) what’s interesting about this opportunity is, you know, some of these stocks are a little bit less liquid. They gap around.
On this one specifically, it sort of gaps around each time, you know, every morning. Uh, but that offers up some excellent opportunity to take advantage of those buyers and sellers in the marketplace. And so we see how this works. And even going back to these earlier opportunities, you see, you know, each morning you get this little bit of a gap, but moving pretty quickly to these predicted lows. And that’s where prices get snapped up.
And so this is where traders can really utilize these tools in a very wide number of markets—maybe expand the amount of markets that you are comfortable trading in, because you have these effective tools to make sure that you’re getting the best price possible, depending on what sort of trade that you’re doing here.
So, here we see M/I Homes with a very strong trend. We’ve also seen, you know, D.R. Horton and the other homebuilders performing really well here—about a 32% rally here in the last 37 trading days.
Arrowhead Pharmaceuticals ($ARWR)
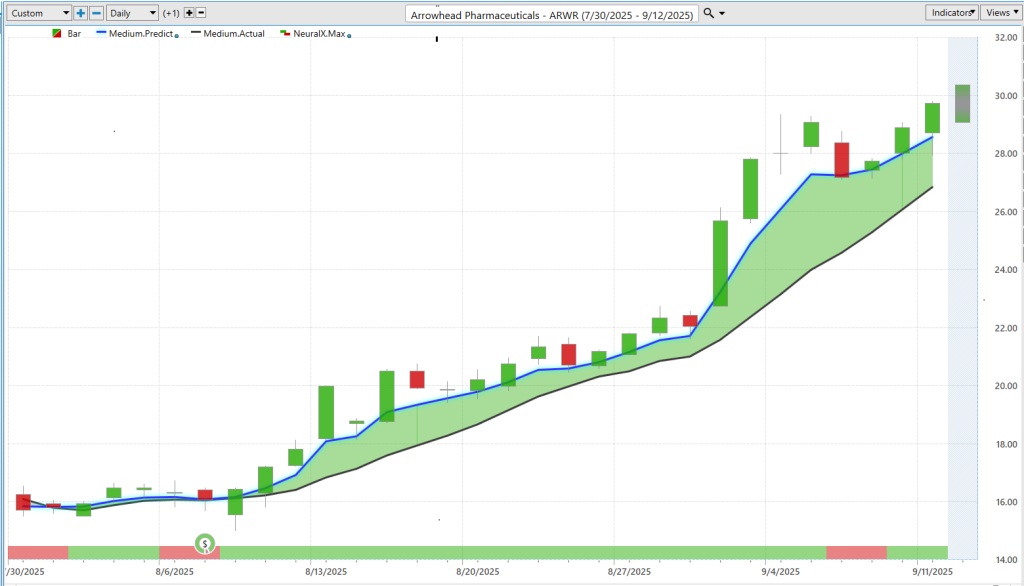
And lastly, we’ll end here with Arrowhead Pharmaceuticals ($ARWR). So again, the healthcare stocks and a lot of pharmaceutical stocks doing very well. Uh, we’ve seen United Healthcare just continue on with its rally this week after a, for the longer term, you know, about 12–13 days or so where we sort of ran sideways, nothing much happening.
Starting to see stocks and shares pick up once again. Uh, but here in Arrowhead, we again see how things have updated. So, week to week, we keep bringing this through. And so now we can say, okay, well, you know what’s happened over the last four trading days here, but as we look back at the accuracy of these predictions, you’ve got a very solid roadmap to make these trading decisions.
And really know, hey, where do I want to participate? You know, in days like this, you might want to hold off until, yeah, we move to that predicted low, and you might not have to risk as much to get involved in the move. And you see, that’s really where we see things accelerate—sort of like in Iris Energy and Opendoor here—a big acceleration coming off of that predicted low level.
And here you see, going into this week, how this works out. We didn’t hit this predicted low. We’ve got this sort of range expanding, but the trend is up. And so, sure enough, even yesterday here, moving down to the predicted low, moving to new highs, and the overall trend still very much to the bullish side here.
So, as we take a look at the entirety of the move here, from where that forecast started to become bullish, an 86% rally in the past 29 trading days. So, all around the market, some really exciting situations where, you know, you just catch on to one of these things with a small position size, and, you know, it can really drive some impressive gains in your equity within the accounts.
You see, just about a 500-share position here on a real cheap stock—it’s up about $7,000 on a move here in just the past 29 trading days. A little bit over a month on the calendar.
So, uh, we’ll go ahead and leave it there for today, though. So, uh, once again, this has been the Hot Stocks Outlook for September 12, 2025. Thank you all for watching. Best of luck out there, and bye for now.