


Register for a Free Live Training
Hot Stocks Outlook uses VantagePoint’s market forecasts that are up to 87.4% accurate, demonstrating how traders can improve their timing and direction. In this week’s video, VantagePoint Software reviews forecasts for CleanSpark ($CLSK), Palo Alto Networks ($PANW), Western Digital Corporation($WDC), Lucid Group($LCID), Crowdstrike ($CRWD)
VantagePoint A.I. Hot Stocks Outlook for September 19, 2025
Hello again traders, and welcome back to the hot stocks outlook for September 19th, 2025. Hope you all have had an excellent week out there in the financial markets. And, as always, we’re here to take a look at the most recent Vantage Point AI predictive forecast. So, if you haven’t already, be sure to go ahead and click on the link down in the description below and get signed up for a live demonstration, and learn all the specifics about how these predictive indicators and technologies are helping traders make much better trading decisions out in the marketplace.
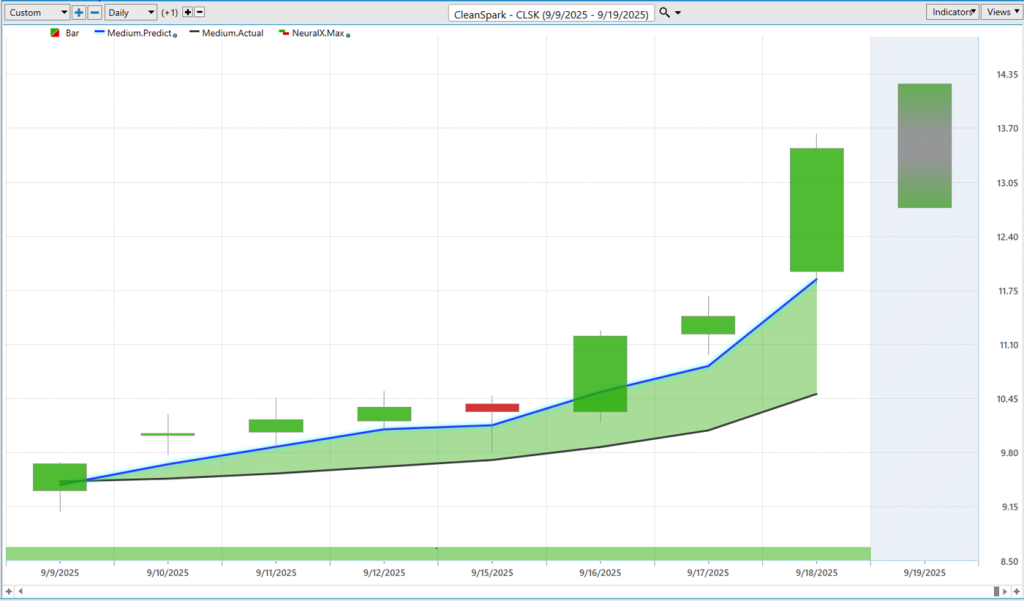
Uh, now we’ll go ahead and start out with shares of CleanSpark. This is a really good example of how all of these tools work together, uh, to really round out that predictive forecast. And so what we’re looking at here is daily bars and candles. So each one of these candles will represent a full and complete trading day. And, right up against all that price data, you’ll notice that there is a black line and also a blue line value.
So, the black line that you’re seeing there is actually a simple moving average. This is a very common technical indicator. Uh, in this instance, it’s a 10-period. So, it’ll look at the previous 10 closes, add those all together, and then divide by that number. Uh, and so what that acts as is a baseline to let us know where market prices have been, but it really has no predictive power. Really, it just smooths out the price action and lets us know, again, where prices have already been.
And, of course, traders want to know, “Where is price headed next?” And so what Vantage Point traders are able to do is compare what we might call that actual or lagging moving average to the Vantage Point proprietary predicted moving average. And for this value to get plotted and calculated on the chart every evening, well, this is where that technology of artificial neural networks comes into play. And they’re performing what we would call intermarket analysis.
And so what that means is that, rather than just looking at past prices, Vantage Point’s technology is understanding how other markets are known to drive and influence the future price of this asset. And so that can be things like individual stocks or ETFs. Uh, that can be even things like cryptocurrencies, or global interest rates, or even global currencies, uh, and even, particularly, commodities where applicable—whether it’s a gold mining stock or oil company.
Um, so it takes all this into account to produce these highly accurate predictions about where price is headed next. And so the overall trend, whenever we see that blue line cross above the black line, that’s Vantage Point suggesting, “Look, prices are going to start moving higher. Traders may want to look to take a long position.”
Uh, we see how, over the past 7 days, market’s up over 35% here in CleanSpark. But that’s not the entirety of the predictive tools here. We also have the Vantage Point predicted neural index at the bottom of the chart. And this solves a different problem for traders. You see this bar that, in this instance, it’s green the entire time. And it can flip from green down to red, and it’s always looking ahead 48 hours. So it’s utilizing that neural network technology to forecast short-term strength or weakness over that 48-hour window.
Uh, and so that’s what allows traders to really be prepared for short-term dips in the marketplace. Uh, and lastly, you’re given a predicted high and predicted low range. So you even have intraday levels where the market is expected to trade.
Uh, and each week, what we do is we look back at all of those predictions and say, “Okay, well, how accurate are all of those predictions against the actual market data?” Uh, and you see how this works is, once this trend comes through, it’s telling you: expect the market to trade down towards these predicted lows. Uh, we see here on Monday the market scoots down to that level, and then we really get a very strong move higher, uh, through this week here.
So, very exciting move there in shares of CleanSpark. Again, about a 35% rally, uh, just over really the past week here. I mean, if we look from these predicted lows, really the past, you know, four trading days, you’re up about 35%.
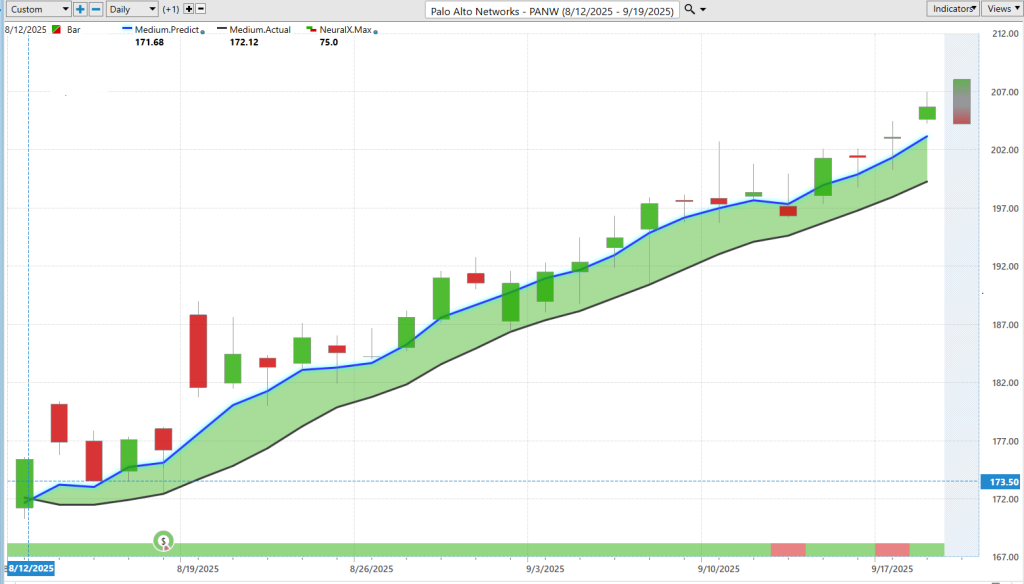
Uh, also, Palo Alto Networks. So, another good example of how all of these tools work together, uh, and how these predictive indicators really skew to the bullish side when we’re expecting short-term price strength. Uh, so, here we see with Palo Alto Networks, you get a blue line crossing above the black line.
We get not a lot of news around earnings—that’s something traders always want to, uh, you know, add into your overall analysis of when that volatility around earnings is going to hit. But every time we look around earnings, we really take a look at, even after that volatility comes in, we can look and see how accurate are those predictions at getting back on track and allowing traders to manage the opportunity.
Uh, and you see how this works here, right? You see it moving down towards these daily predicted lows, the market continuing to trend higher, and that blue line remaining above the black line, suggesting the overall trend’s bullish here. You want to keep exploiting the bullish side of the market in this case. Uh, and a very nice opportunity here. So, we see overall a very strong move—about 17–18% here, uh, just in the past month of trading.
Western Digital Corporation($WDC)
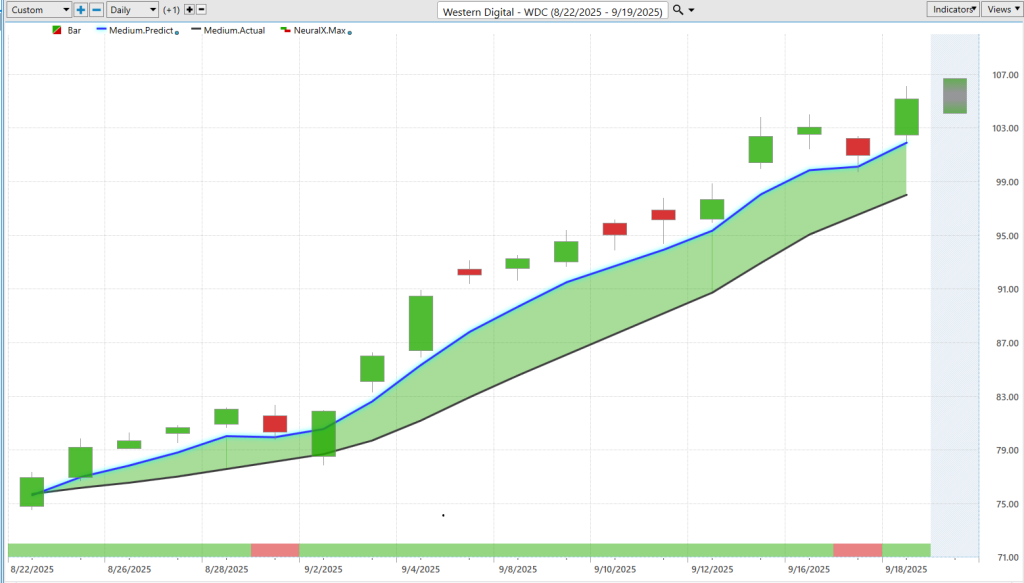
Uh, we also have Western Digital. So, a tech stock here—blue line crossing above the black line. You’ll see you get these periods where the neural index might go bearish. You see, we get a gap down the next trading day, but there’s a lot of separation between that blue line value and the actual moving average. Uh, and that allows traders to, again, keep exploiting the bullish side of the market.
Again, we can see how these predicted levels work to allow traders to navigate the opportunity, uh, add to positions potentially with those profits. Uh, and overall here, seeing a very nice sustained move here, uh, of about 35% now just in the past 18 trading days.
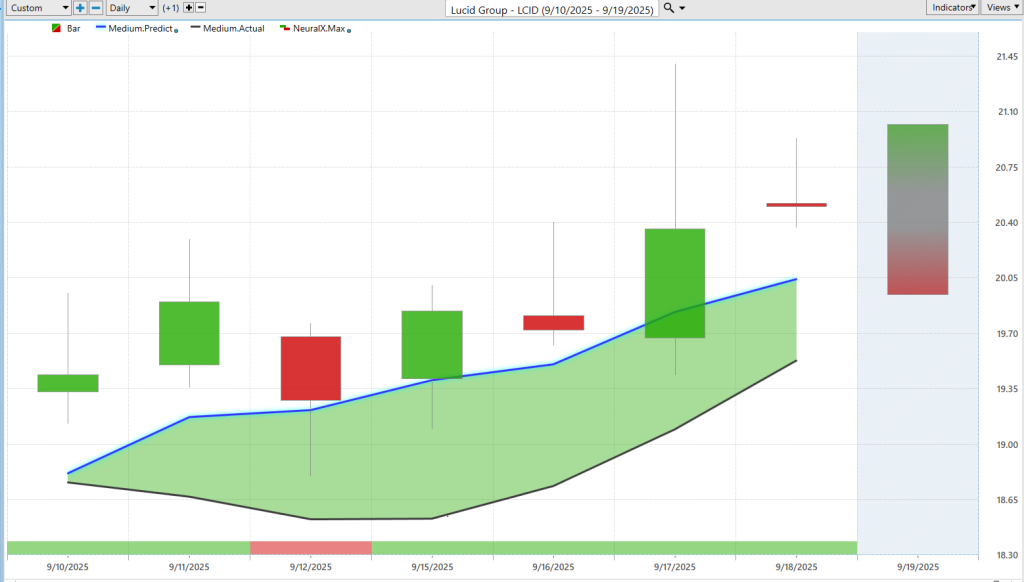
Uh, more recently here, Lucid Group. So again, just a, you know, cheaper price stock here. Uh, but seeing that blue line cross above the black line this week, seeing the opportunity and a lot of separation between, again, that prediction of the moving average and the actual moving average. And, of course, that allows traders to say, “Okay, well, where are those daily predicted levels coming in and offering up opportunity?”
You see how this works: moving down to the predicted low. See, sometimes you’ll get these previous predicted low levels being hit, uh, and the market very aggressively moving higher into these predicted highs as the overall trend remains to the bullish side. So, uh, we take a look at so far—I think this was up a little bit more today here. Uh, but overall here, about, you know, 9–10% just in the past five trading days, um, in Lucid Group.
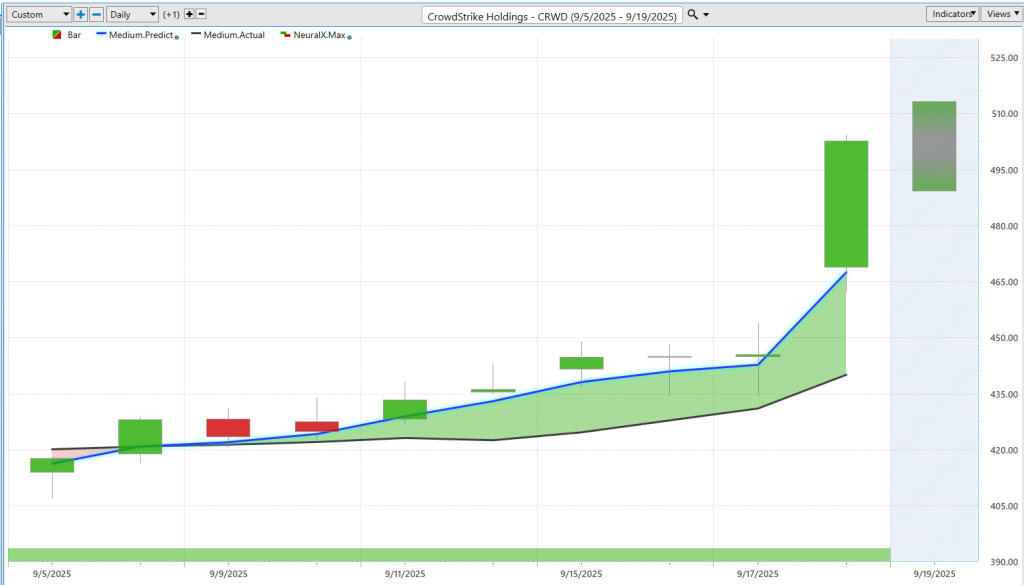
And lastly, take a look at CrowdStrike. Uh, very straightforward here. And that’s really the point: regardless of, you know, what your trading style is, you’ve got a very straightforward forecast with the overall trend direction, short-term strength or weakness, and then, of course, those predicted highs and predicted lows.
Uh, here we see in CrowdStrike, very similar situation—getting a fresh crossover, uh, neural index remaining very bullish for the duration of this entire opportunity, uh, and offering again multiple opportunities to, you know, express a position before we get that really strong movement higher in prices. And we can see even here, just over the past couple days from those predicted lows, market’s up about 15% here, uh, just over the week here.
So, we’ll go ahead and leave it there for today. Once again, this has been the hot stocks outlook for September 19th, 2025. Thank you all for watching. Best of luck out there, and bye for now.


