


Register for a Free Live Training
Hot Stocks Outlook uses VantagePoint’s market forecasts that are up to 87.4% accurate, demonstrating how traders can improve their timing and direction. In this week’s video, VantagePoint Software reviews forecasts for GAP ($GAP), M/I Homes ($MHO), Arrowhead Pharmaceuticals ($ARWR), Humana ($HUM), Opendoor Technologies ($OPEN), Barrick Mining ($B)
VantagePoint A.I. Hot Stocks Outlook for September 5, 2025
Hello again, traders, and welcome back to the hot stocks outlook for September 5th, 2025. I hope you all have had an excellent week out there in the financial markets. And as always, we’re here to take a look at the most recent Vantage Point AI predictive forecast.
So, if you haven’t already, be sure to go ahead and click the link down in the description below. You can get yourself signed up for a live demonstration and learn all the specifics about how these predictive indicators and technologies are helping traders to make better trading decisions when out in the marketplace.
Now, we’ll go ahead and start out with shares of GAP. We’ll actually revisit a few stocks we’ve looked at over previous weeks really to highlight how these forecasts update every single trading day and help traders adapt to those changing market conditions.
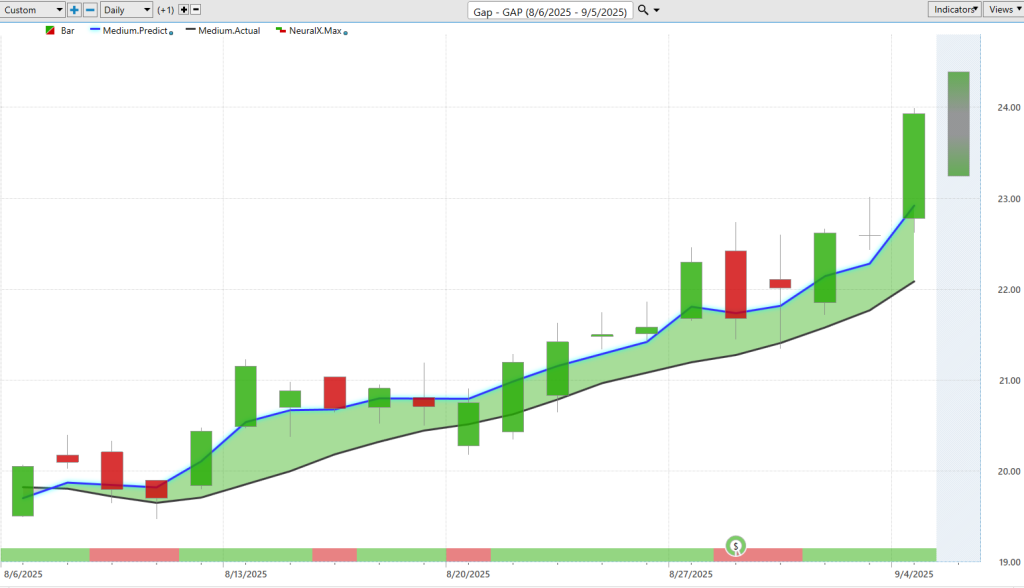
So, we’ll start out here with shares of GAP, which recently had earnings. And what we’re seeing here is daily price action, right? Each candle on the screen here represents a full and complete trading day.
The first thing you’re going to notice is that right up against all of those daily bars and candles there, you’re going to see a black line and also a blue line value. The black line that you see there is actually a simple moving average—a very common technical analysis indicator. In this case, it would be a 10-period simple moving average. That means it looks at the previous 10 close prices, adds them all together, and then divides by that number. What that does is smooth out the existing price action.
Vantage Point traders are able to compare that value to this proprietary predicted moving average. For this number, which we can think of as a price, to get calculated and plotted and placed against the chart—this is where the technology of artificial neural networks comes into play. They’re performing what we would call intermarket analysis.
Rather than just looking at past prices like a simple moving average would, Vantage Point’s neural network technology is looking at other market relationships that are known to drive and influence future price. This is really where AI has a huge leg up: taking in huge amounts of data, analyzing that data, and producing accurate predictions.
This can be dozens of markets—it can be other individual stocks, ETF groups, potentially here in the retail space pertaining to GAP and other retail stores. But this goes all the way down the line globally, taking into account things like the value of global currencies like the US dollar, global interest rates, and even global commodities where it’s applicable.
For example, when we look at Barrick Mining, a gold mining stock, gold prices being very bullish gets factored into these predictions on where prices are headed next. Whenever we see this blue line cross above the black line, it’s suggesting that average prices should start moving higher and traders may want to look to express a bullish position—whether that’s through trading the shares, buying call options, whatever your strategy or instrument you like to use.
Since that blue line has crossed above the black line and remained above, the market here is up 19% in just the past 20 trading days. You see just 500 shares there would be up about $1,900 as far as a single position. But that’s not the entirety of these predictive indicators and forecasts.
At the very bottom of the chart, you see this bar that goes from green to red and back to green. This gets updated every single evening for traders and it’s forecasting short-term strength or weakness in the market—really looking two days ahead or 48 hours. So, within the uptrend, it’s warning traders of short-term and temporary weakness, potentially dips that, depending on your strategy, you may want to be a buyer on.
Lastly, we always look at the Vantage Point predicted high and low. This gets really exciting for intraday and day traders, providing levels you can be informed of before the next trading day. You really have this whole forecast: the overall trend, short-term strength or weakness, and where prices are likely to move on the low or high end.
We can take a look back at all of these predictions against the actual market data. We can run scans to identify fresh crossovers and where we should be looking intraday as far as price is concerned to accumulate a position.
You see how this works—you get a down day closing very close to that predicted low, and the updated forecasts let you know we’re going to slide a little bit lower. Expect that lower low over the next 48 hours. But the overall trend is bullish. Volatility kicks in, the market starts moving higher, and the indicator and tools here do an excellent job of getting back on track.
Around earnings, you’re going to see a little bit more noise. That’s something a trader can factor into their overall analysis. But you see about a half dozen entries here within this 20% uplift in shares.
Now I wanted to go ahead and revisit many of the markets that we’ve highlighted on previous hot stocks outlooks videos because once you’re in a position, one of the most important things is managing that opportunity, potentially adding to a position. That’s where you can really get some nice performance if you’re able to minimize the risk and add to an opportunity in a very strategic and controlled way.
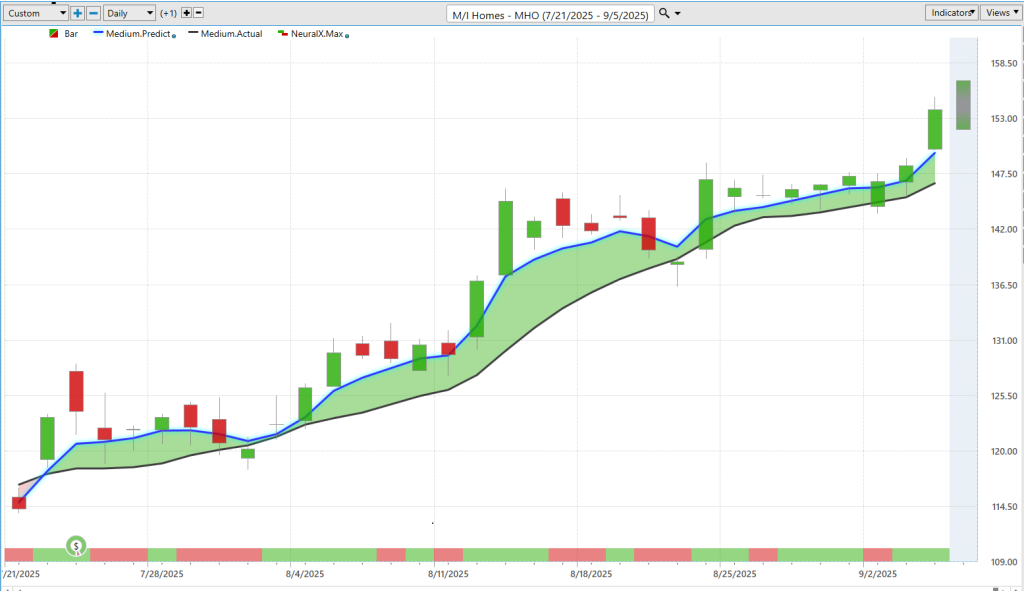
Here we see M/I Homes, and notice that throughout the home-building space there’s been a lot of bullishness. There’s Lennar, Dr. Horton—Vantage Point produces forecasts for all of these publicly traded building companies.
We looked at M/I Homes a little while ago and highlighted that we had some gappy price action. It’s a somewhat illiquid stock. It sort of gaps up every morning or every evening going into the next trading day.
We get this blue line crossing above the black line. We get through earnings. Neural index is bearish—you may get some sideways price action—but you never get that cross below. Over the past few weeks, pretty much since the last time we highlighted this chart, you see how these tools work moving down towards these predicted lows.
Three excellent entries—four actually—in the past few weeks. The market is really starting to accelerate to the bullish side. We’ve got about a 27% move here over the past 31 trading days, and about a 7% uplift in just the past five trading days.
Arrowhead Pharmaceuticals ($ARWR)
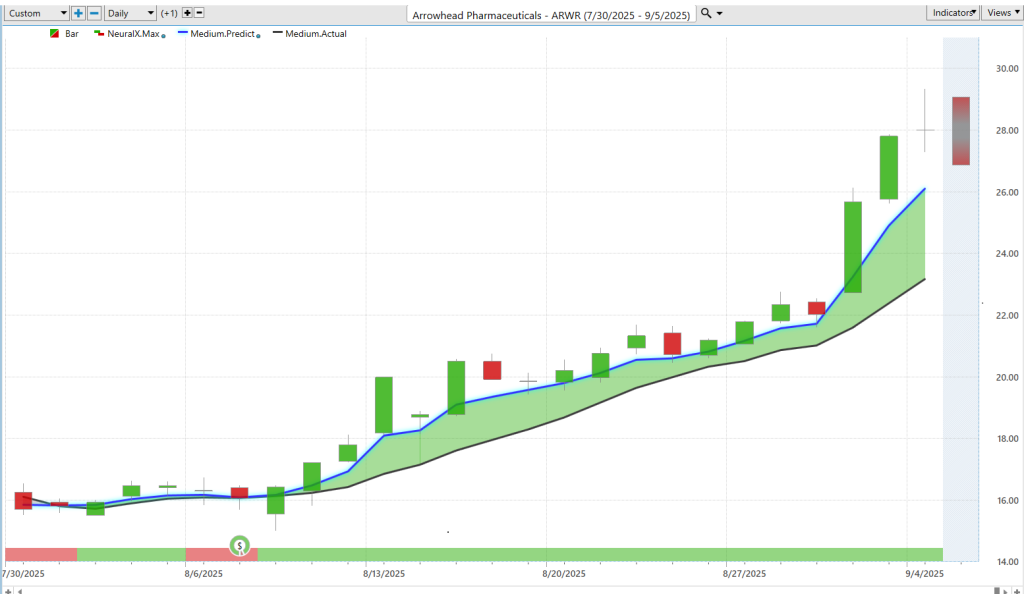
Here’s Arrowhead Pharmaceuticals. We keep coming back to healthcare pharmaceutical stocks, and Arrowhead specifically is seeing that blue line crossing above the black line.
You get a little bit of noise around the earnings report, but look at this forecast every single day since the last hot stocks outlook—or even a couple hot stocks outlooks ago. Neural index very bullish here.
Looking at those Vantage Point predicted highs and lows, you really see how this works. You’re not going to hit these levels every single day, but when you have orders waiting at those price levels, you see the market move lower and then really accelerate—from $22 a share up to $28 in pretty short order.
Just this week alone, that’s about a 33% rally. Since this move got started, we’re up about 82% in just the past 24 trading days. Even just a 500-share position down at $16 a share is about a $6,500 move.
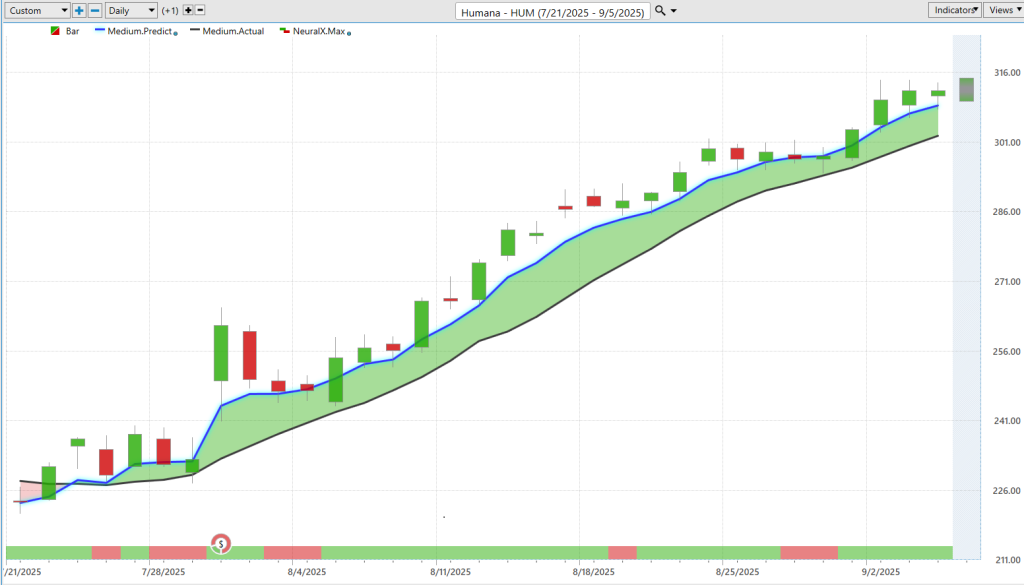
Now a slower-moving healthcare stock: some of these large insurance providers. We saw United Healthcare had a big uplift. We’ve been highlighting Humana week after week because we’ve really been further along here.
We’ve seen this uptrend for a while now. Looking at the recent Vantage Point predicted highs and lows, sometimes you’ll just get sideways price action. That’s what Vantage Point warns you of: look down towards this level to accumulate a position.
Coming into this week, Monday through Thursday, the market moved from about $300 to about $315 in short order. Over the past week, we’ve got another 5% rally in shares of Humana in just the past six trading days.
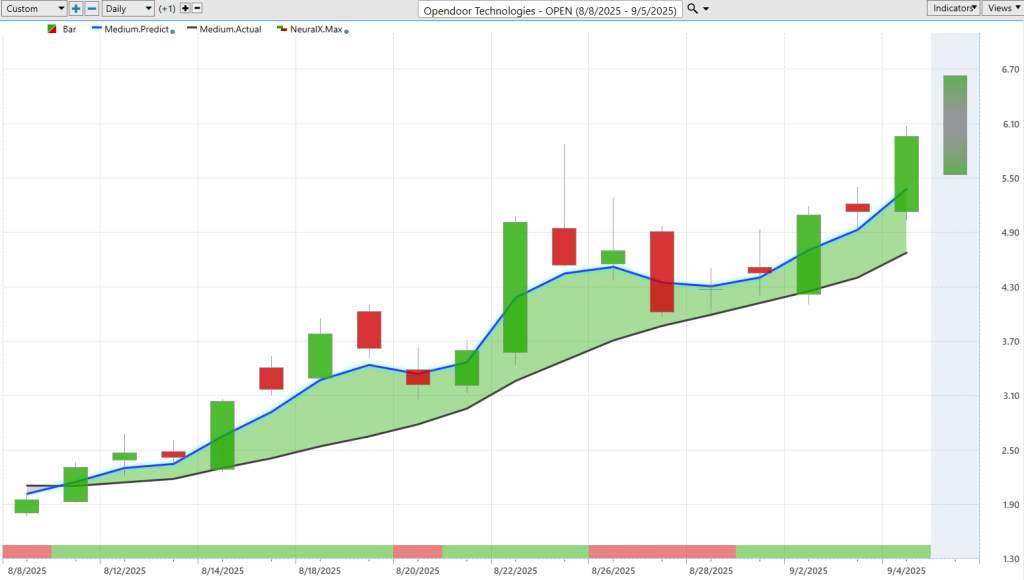
Now we’re seeing somewhat of a meme stock: Opendoor Technologies. It’s gotten a lot of attention, beaten down to low prices. A great example of even a highly volatile stock.
This stock moved from $2 up to $6. Overall, this is probably one of the biggest movers—150% in the past 17 trading days.
Even this week, just in three trading days, shares are up 43%. Looking closely, the predicted low was 4.16, and the market got down to 4.11. If you could bear about a 5-cent move against you, you could catch that 43% uplift.
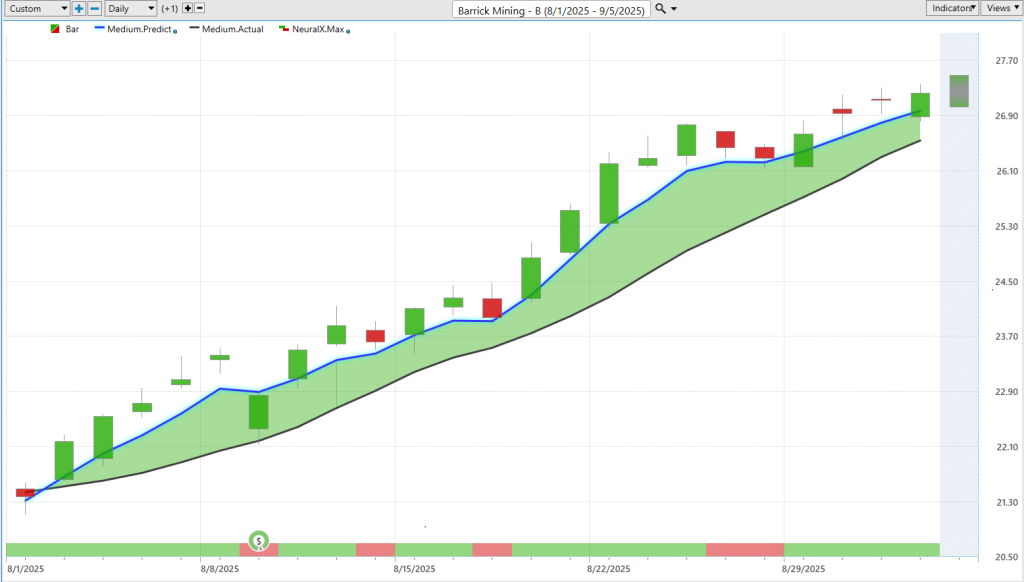
Lastly, let’s look at Barrick Mining in the commodity space. Sometimes, especially with gold stocks, commodities really get factored into the equation.
After about five days from the blue line crossing above the black line, we get that earnings report. Notice how we never moved down to the predicted lows while drifting into earnings. Then, after earnings, the market comes right back into that predicted level and resumes the uptrend.
Week after week, once earnings come through, the software adapts and says: “Okay, what’s going on with those intermarket relationships? Let’s make sure we produce forecasts so the trader can continue to navigate.”
Even just yesterday, we saw three, four, five, six entries since earnings in this gold mining stock. It’s been bullish across the board. Tools like the Vantage Point Intelliscan scan with these predictive indicators and quickly skew to the bullish side, giving an early warning sign that something’s going on in this sector.
Here, we see a very impressive move—about 23% in 22 trading days.
So, we’ll go ahead and leave it there for today. Once again, this has been the Hot Stocks Outlook for September 5th, 2025. Thank you all for watching. Best of luck out there, and bye for now.


