[fusion_builder_container type=”flex” hundred_percent=”no” hundred_percent_height=”no” hundred_percent_height_scroll=”no” align_content=”stretch” flex_align_items=”flex-start” flex_justify_content=”flex-start” hundred_percent_height_center_content=”yes” equal_height_columns=”no” container_tag=”div” hide_on_mobile=”small-visibility,medium-visibility,large-visibility” status=”published” border_style=”solid” box_shadow=”no” box_shadow_blur=”0″ box_shadow_spread=”0″ gradient_start_position=”0″ gradient_end_position=”100″ gradient_type=”linear” radial_direction=”center center” linear_angle=”180″ background_position=”center center” background_repeat=”no-repeat” fade=”no” background_parallax=”none” enable_mobile=”no” parallax_speed=”0.3″ background_blend_mode=”none” video_aspect_ratio=”16:9″ video_loop=”yes” video_mute=”yes” absolute=”off” absolute_devices=”small,medium,large” sticky=”off” sticky_devices=”small-visibility,medium-visibility,large-visibility” sticky_transition_offset=”0″ scroll_offset=”0″ animation_direction=”left” animation_speed=”0.3″ filter_hue=”0″ filter_saturation=”100″ filter_brightness=”100″ filter_contrast=”100″ filter_invert=”0″ filter_sepia=”0″ filter_opacity=”100″ filter_blur=”0″ filter_hue_hover=”0″ filter_saturation_hover=”100″ filter_brightness_hover=”100″ filter_contrast_hover=”100″ filter_invert_hover=”0″ filter_sepia_hover=”0″ filter_opacity_hover=”100″ filter_blur_hover=”0″ background_color=”#”][fusion_builder_row][fusion_builder_column type=”1_1″ layout=”3_4″ align_self=”auto” content_layout=”column” align_content=”flex-start” content_wrap=”wrap” spacing=”” center_content=”no” link=”” target=”_self” min_height=”” hide_on_mobile=”small-visibility,medium-visibility,large-visibility” sticky_display=”normal,sticky” class=”” id=”” type_medium=”” type_small=”” order_medium=”0″ order_small=”0″ dimension_spacing_medium=”” dimension_spacing_small=”” dimension_spacing=”” dimension_margin_medium=”” dimension_margin_small=”” margin_top=”” margin_bottom=”” padding_medium=”” padding_small=”” padding_top=”” padding_right=”” padding_bottom=”” padding_left=”” hover_type=”none” border_sizes=”” border_color=”” border_style=”solid” border_radius=”” box_shadow=”no” dimension_box_shadow=”” box_shadow_blur=”0″ box_shadow_spread=”0″ box_shadow_color=”” box_shadow_style=”” background_type=”single” gradient_start_color=”” gradient_end_color=”” gradient_start_position=”0″ gradient_end_position=”100″ gradient_type=”linear” radial_direction=”center center” linear_angle=”180″ background_color=”” background_image=”” background_image_id=”” background_position=”left top” background_repeat=”no-repeat” background_blend_mode=”none” animation_type=”” animation_direction=”left” animation_speed=”0.3″ animation_offset=”” filter_type=”regular” filter_hue=”0″ filter_saturation=”100″ filter_brightness=”100″ filter_contrast=”100″ filter_invert=”0″ filter_sepia=”0″ filter_opacity=”100″ filter_blur=”0″ filter_hue_hover=”0″ filter_saturation_hover=”100″ filter_brightness_hover=”100″ filter_contrast_hover=”100″ filter_invert_hover=”0″ filter_sepia_hover=”0″ filter_opacity_hover=”100″ filter_blur_hover=”0″ last=”true” border_position=”all” element_content=”” first=”true” spacing_right=””][fusion_text columns=”1″ column_min_width=”” column_spacing=”” rule_style=”default” rule_size=”” rule_color=”” content_alignment_medium=”” content_alignment_small=”” content_alignment=”” hide_on_mobile=”small-visibility,medium-visibility,large-visibility” sticky_display=”normal,sticky” class=”” id=”” font_size=”” fusion_font_family_text_font=”” fusion_font_variant_text_font=”” line_height=”” letter_spacing=”” text_color=”” animation_type=”” animation_direction=”left” animation_speed=”0.3″ animation_offset=””]
Cincinnati Financial (CINF)
This week’s stock analysis is Cincinnati Financial (CINF).
Cincinnati Financial Corporation, together with its subsidiary, provides property casualty insurance products in the United States. The company operates in five segments: Commercial Lines Insurance, Personal Lines Insurance, Excess and Surplus Lines Insurance, Life Insurance, and Investments. It was founded in 1950 and is headquartered in Fairfield, Ohio.
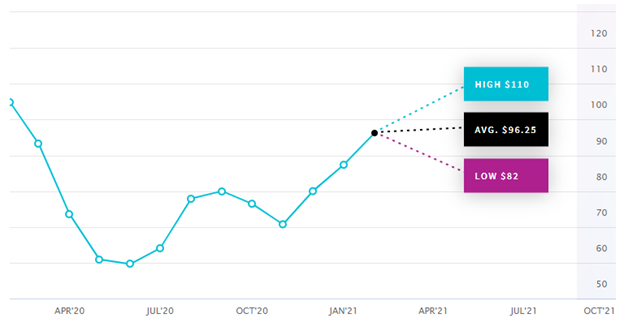
Based on 4 analysts offering 12-month price targets for Cincinnati Financial in the last 3 months. The average price target is $96.25 with a high forecast of $110.00 and a low forecast of $82.00. The average price target represents a -3.87% decrease from the last price of $100.13. CINF is widely held in many popular hedge funds portfolios. Cincinnati Financial Corp’s market capitalization of $16,295,902,295. Currently it is trading at 13.4 times earnings which is still attractive in the insurance niche.
In the year-to-date period, Cincinnati Financial has gained 15.7% compared to the S&P 500 composite which has only risen 3.5%.
One of the powerful attractions of Cincinnati Financial is that it has a very long history of stable performance and a great history of increasing dividend payments every year.
On average investors in CINF can expect to receive anywhere between a 2% to 4% dividend yield every year. Looking at this in the context of the current yields offered by t-bills, and t-bonds this is very attractive. The CINF dividend even increased through the 2008-09 Great Recession.
Over the last 52 weeks CINF has traded as high as 102.84 and as low as 46.07. This means provides us with an annual trading range of $56.80. When we divide this metric by 52 weeks we can determine that the average weekly trading range for CINF is roughly $1.09. We refer to these as the commonsense metrics which we use as baseline measurements of understanding normal value. When using artificial intelligence we look to amplify our returns based upon these baseline measurements.
Whenever we trade, we always pay attention to where we are in relation to the 52 week trading range. It is very common to see the 52 week high provide very strong resistance to the market until it is breached. Often when the 52 week high is breached we will see the stock price explode higher very quickly over a very short period of time.
The Vantagepoint A.I. Analysis
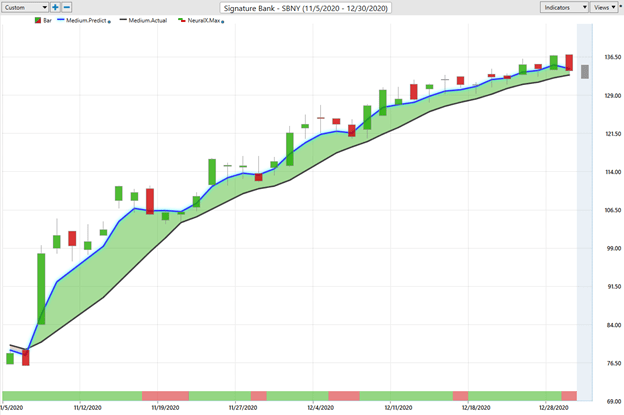
In studying the chart below pay close attention to the relationship between the black line and predictive blue line. The black line is just a simple 10 day moving average. It Is calculated by taking the closing prices of the last 10 days and dividing that sum by 10. All that the black line tells you is what has occurred. It tells you where prices have been.
The predictive blue line, on the other hand utilizes that Vantagepoint patented Neural Network and Intermarket Analysis to arrive at its value. It looks at the strongest price drivers of an asset through artificial intelligence and statistical correlations to determine its value.
Whenever we see the predictive blue line move above the black line we are presented with an entry opportunity. This is what occurred on February 4th, 2021 @ $87.34 per share.
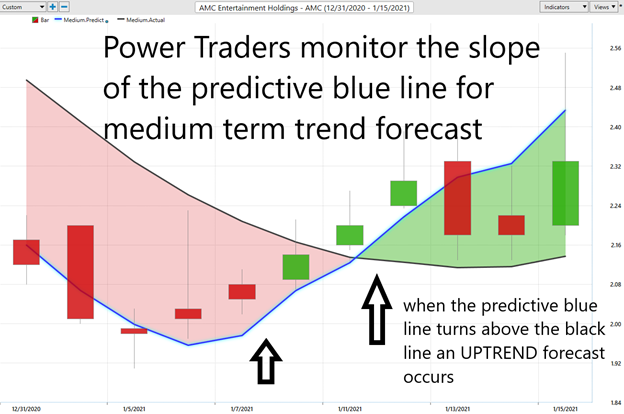
Power traders use the predictive blue line in helping to determine both the value zone as well as the trend direction.
Three weeks ago, on February 1st, 2021, The A.I. forecast on GT turned higher alerting Power Traders to a short-term trading opportunity.
[/fusion_text][fusion_imageframe image_id=”15288|full” max_width=”” sticky_max_width=”” style_type=”” blur=”” stylecolor=”” hover_type=”none” bordersize=”” bordercolor=”” borderradius=”” align_medium=”none” align_small=”none” align=”center” margin_top=”” margin_right=”” margin_bottom=”15″ margin_left=”” lightbox=”no” gallery_id=”” lightbox_image=”” lightbox_image_id=”” alt=”is CINF a good dividend stock?” link=”https://vantagepoint.clickfunnels.com/market-movement-webinar-opt-in?src=MMWebinar_Internal_Website_StockStudy_Direct” linktarget=”_self” hide_on_mobile=”small-visibility,medium-visibility,large-visibility” sticky_display=”normal,sticky” class=”” id=”” animation_type=”” animation_direction=”left” animation_speed=”0.3″ animation_offset=”” filter_hue=”0″ filter_saturation=”100″ filter_brightness=”100″ filter_contrast=”100″ filter_invert=”0″ filter_sepia=”0″ filter_opacity=”100″ filter_blur=”0″ filter_hue_hover=”0″ filter_saturation_hover=”100″ filter_brightness_hover=”100″ filter_contrast_hover=”100″ filter_invert_hover=”0″ filter_sepia_hover=”0″ filter_opacity_hover=”100″ filter_blur_hover=”0″]https://www.vantagepointsoftware.com/wp-content/uploads/2021/03/CINF-3.png[/fusion_imageframe][fusion_text columns=”1″ column_min_width=”” column_spacing=”” rule_style=”default” rule_size=”” rule_color=”” content_alignment_medium=”” content_alignment_small=”” content_alignment=”” hide_on_mobile=”small-visibility,medium-visibility,large-visibility” sticky_display=”normal,sticky” class=”” id=”” font_size=”” fusion_font_family_text_font=”” fusion_font_variant_text_font=”” line_height=”” letter_spacing=”” text_color=”” animation_type=”” animation_direction=”left” animation_speed=”0.3″ animation_offset=””]
Fine Tuning Entries with the Neural Net Indicator
At the bottom of the chart is the Neural Network Indicator which predicts future strength and/or weakness in the market. When the Neural Net Indicator is green it communicates strength. When the Neural Net is Red it is forecasting short-term weakness in the market.
We advocate that Power Traders cross-reference the chart with the predictive blue line and neural network indicator to create optimal entry and exit points.
Power Traders are always looking to apply both the neural network and A.I. to the markets to find statistically sound trading opportunities.
VantagePoint Software Daily Price Range Prediction
One of the powerful features in the Vantagepoint A.I. Software which Power Traders use on a daily basis is the Price Range prediction forecast.
This forecast is what permits Power Traders to truly fine tune their entries and exits into the market.
At 6;30pm after the market close the software updates and all of the price predictions change based upon what the machine learning, A.I., neural networks and intermarket analysis anticipate moving forward.
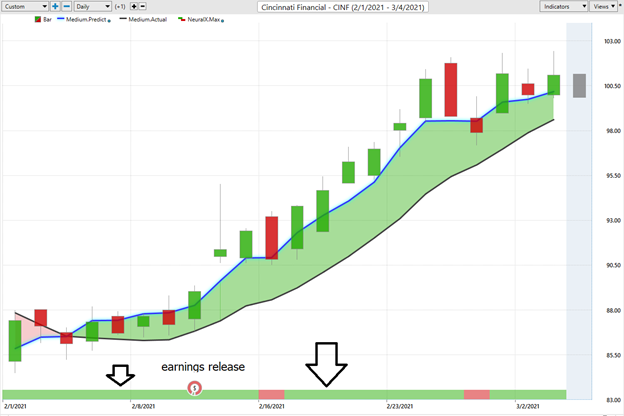
Here is the price chart of CINF during the most recent runup featuring the Daily Price Range forecast and the NeuralNet Indicator.
In summary, the trend turned up 5 days before an earnings release was reported. Prices have surged since that forecast and the trend remain firmly UP.
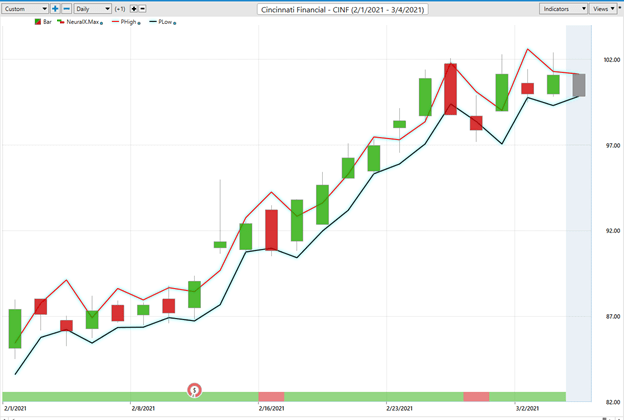
Power Traders use a price level below the predictive low price to place their protective sell stops in the market in case a sudden reversal was to occur. Observe how the predictive price low also provided numerous short term entry opportunities for traders to buy WKHS as it was trending higher.
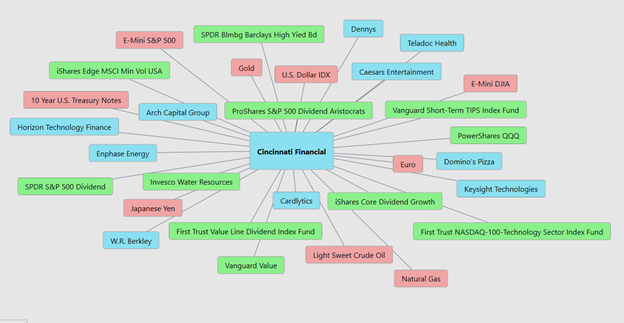
Intermarket Analysis
Investors and hedge funds like CINF because of the hefty dividend which they can expect every year. However, the challenge still remains for most investors where do you buy an attractive asset?
Studying the charts can always provide objective realities in terms of locating support and resistance levels which become very clear on a chart. But we live in a global marketplace. Everything is interconnected. The billion dollar question for traders is always “What are the key drivers of price for the underlying asset that I am trading?”
These intangibles are invisible to the naked eye yet are responsible for driving prices. These markets show very high statistical correlations.
Small changes in Interest rates, Crude Oil Prices, and the Volatility of the dollar amongst thousands of other variables affect the decisions companies must make to survive in these very challenging times. Trying to determine what these factors are is one of the huge problems facing investors and traders.
There is great value to be had in studying and understanding the key drivers of CINF price action. universe and the most statistically correlated assets. These factors are all displayed from a standpoint of statistical correlations which show the strongest interconnectedness of prices.
[/fusion_text][fusion_text columns=”1″ column_min_width=”” column_spacing=”” rule_style=”default” rule_size=”” rule_color=”” content_alignment_medium=”” content_alignment_small=”” content_alignment=”” hide_on_mobile=”small-visibility,medium-visibility,large-visibility” sticky_display=”normal,sticky” class=”” id=”” font_size=”” fusion_font_family_text_font=”” fusion_font_variant_text_font=”” line_height=”” letter_spacing=”” text_color=”” animation_type=”” animation_direction=”left” animation_speed=”0.3″ animation_offset=””]
CINF is fairly valued at the present time but the trend is firmly up. Power traders are in at lower prices and are placing their protective stops below the bottom of the predictive low channel.
Follow the A.I. trend analysis and practice good money management on all of your trades. CINF has proven over and over again to be a good candidate for short term swing trading opportunities. CINF deserves to be on your trading radar.
Let’s Be Careful Out There!
Remember, It’s Not Magic.
It’s Machine Learning.
Disclaimer: THERE IS A HIGH DEGREE OF RISK INVOLVED IN TRADING. IT IS NOT PRUDENT OR ADVISABLE TO MAKE TRADING DECISIONS THAT ARE BEYOND YOUR FINANCIAL MEANS OR INVOLVE TRADING CAPITAL THAT YOU ARE NOT WILLING AND CAPABLE OF LOSING.
VANTAGEPOINT’S MARKETING CAMPAIGNS, OF ANY KIND, DO NOT CONSTITUTE TRADING ADVICE OR AN ENDORSEMENT OR RECOMMENDATION BY VANTAGEPOINT AI OR ANY ASSOCIATED AFFILIATES OF ANY TRADING METHODS, PROGRAMS, SYSTEMS OR ROUTINES. VANTAGEPOINT’S PERSONNEL ARE NOT LICENSED BROKERS OR ADVISORS AND DO NOT OFFER TRADING ADVICE.
[/fusion_text][fusion_imageframe image_id=”15035|full” max_width=”” sticky_max_width=”” style_type=”” blur=”” stylecolor=”” hover_type=”none” bordersize=”” bordercolor=”” borderradius=”” align_medium=”none” align_small=”none” align=”center” lightbox=”no” gallery_id=”” lightbox_image=”” lightbox_image_id=”” alt=”Free Live Training | 2 Trading Strategies to Dominate 2021″ link=”https://vantagepoint.clickfunnels.com/market-movement-webinar-opt-in?src=MMWebinar_Internal_Website_StockStudy_Direct” linktarget=”_self” animation_type=”” animation_direction=”left” animation_speed=”0.3″ animation_offset=”” hide_on_mobile=”small-visibility,medium-visibility,large-visibility” sticky_display=”normal,sticky” class=”” id=”” filter_hue=”0″ filter_saturation=”100″ filter_brightness=”100″ filter_contrast=”100″ filter_invert=”0″ filter_sepia=”0″ filter_opacity=”100″ filter_blur=”0″ filter_hue_hover=”0″ filter_saturation_hover=”100″ filter_brightness_hover=”100″ filter_contrast_hover=”100″ filter_invert_hover=”0″ filter_sepia_hover=”0″ filter_opacity_hover=”100″ filter_blur_hover=”0″]https://www.vantagepointsoftware.com/wp-content/uploads/2021/02/3Tips_Webinar_Banner.jpg[/fusion_imageframe][fusion_text columns=”” column_min_width=”” column_spacing=”” rule_style=”default” rule_size=”” rule_color=”” font_size=”” line_height=”” letter_spacing=”” text_color=”” content_alignment_medium=”” content_alignment_small=”” content_alignment=”” animation_type=”” animation_direction=”left” animation_speed=”0.3″ animation_offset=”” hide_on_mobile=”small-visibility,medium-visibility,large-visibility” sticky_display=”normal,sticky” class=”” id=””][/fusion_text][fusion_text columns=”” column_min_width=”” column_spacing=”” rule_style=”default” rule_size=”” rule_color=”” font_size=”” line_height=”” letter_spacing=”” text_color=”” content_alignment_medium=”” content_alignment_small=”” content_alignment=”” animation_type=”” animation_direction=”left” animation_speed=”0.3″ animation_offset=”” hide_on_mobile=”small-visibility,medium-visibility,large-visibility” sticky_display=”normal,sticky” class=”” id=””][/fusion_text][fusion_text columns=”1″ column_min_width=”” column_spacing=”” rule_style=”default” rule_color=”” font_size=”” line_height=”” letter_spacing=”” text_color=”” content_alignment_medium=”” content_alignment_small=”” content_alignment=”” animation_type=”” animation_direction=”left” animation_speed=”0.3″ animation_offset=”” hide_on_mobile=”small-visibility,medium-visibility,large-visibility” sticky_display=”normal,sticky” class=”” id=”” fusion_font_variant_text_font=””][/fusion_text][/fusion_builder_column][/fusion_builder_row][/fusion_builder_container]