


[fusion_builder_container type=”flex” hundred_percent=”no” hundred_percent_height=”no” hundred_percent_height_scroll=”no” align_content=”stretch” flex_align_items=”flex-start” flex_justify_content=”flex-start” hundred_percent_height_center_content=”yes” equal_height_columns=”no” container_tag=”div” hide_on_mobile=”small-visibility,medium-visibility,large-visibility” status=”published” border_style=”solid” box_shadow=”no” box_shadow_blur=”0″ box_shadow_spread=”0″ gradient_start_position=”0″ gradient_end_position=”100″ gradient_type=”linear” radial_direction=”center center” linear_angle=”180″ background_position=”center center” background_repeat=”no-repeat” fade=”no” background_parallax=”none” enable_mobile=”no” parallax_speed=”0.3″ background_blend_mode=”none” video_aspect_ratio=”16:9″ video_loop=”yes” video_mute=”yes” absolute=”off” absolute_devices=”small,medium,large” sticky=”off” sticky_devices=”small-visibility,medium-visibility,large-visibility” sticky_transition_offset=”0″ scroll_offset=”0″ animation_direction=”left” animation_speed=”0.3″ filter_hue=”0″ filter_saturation=”100″ filter_brightness=”100″ filter_contrast=”100″ filter_invert=”0″ filter_sepia=”0″ filter_opacity=”100″ filter_blur=”0″ filter_hue_hover=”0″ filter_saturation_hover=”100″ filter_brightness_hover=”100″ filter_contrast_hover=”100″ filter_invert_hover=”0″ filter_sepia_hover=”0″ filter_opacity_hover=”100″ filter_blur_hover=”0″ background_color=”#”][fusion_builder_row][fusion_builder_column type=”1_1″ layout=”3_4″ align_self=”auto” content_layout=”column” align_content=”flex-start” content_wrap=”wrap” spacing=”” center_content=”no” link=”” target=”_self” min_height=”” hide_on_mobile=”small-visibility,medium-visibility,large-visibility” sticky_display=”normal,sticky” class=”” id=”” type_medium=”” type_small=”” order_medium=”0″ order_small=”0″ dimension_spacing_medium=”” dimension_spacing_small=”” dimension_spacing=”” dimension_margin_medium=”” dimension_margin_small=”” margin_top=”” margin_bottom=”” padding_medium=”” padding_small=”” padding_top=”” padding_right=”” padding_bottom=”” padding_left=”” hover_type=”none” border_sizes=”” border_color=”” border_style=”solid” border_radius=”” box_shadow=”no” dimension_box_shadow=”” box_shadow_blur=”0″ box_shadow_spread=”0″ box_shadow_color=”” box_shadow_style=”” background_type=”single” gradient_start_color=”” gradient_end_color=”” gradient_start_position=”0″ gradient_end_position=”100″ gradient_type=”linear” radial_direction=”center center” linear_angle=”180″ background_color=”” background_image=”” background_image_id=”” background_position=”left top” background_repeat=”no-repeat” background_blend_mode=”none” animation_type=”” animation_direction=”left” animation_speed=”0.3″ animation_offset=”” filter_type=”regular” filter_hue=”0″ filter_saturation=”100″ filter_brightness=”100″ filter_contrast=”100″ filter_invert=”0″ filter_sepia=”0″ filter_opacity=”100″ filter_blur=”0″ filter_hue_hover=”0″ filter_saturation_hover=”100″ filter_brightness_hover=”100″ filter_contrast_hover=”100″ filter_invert_hover=”0″ filter_sepia_hover=”0″ filter_opacity_hover=”100″ filter_blur_hover=”0″ last=”true” border_position=”all” element_content=”” first=”true” spacing_right=””][fusion_text columns=”1″ column_min_width=”” column_spacing=”” rule_style=”default” rule_size=”” rule_color=”” content_alignment_medium=”” content_alignment_small=”” content_alignment=”” hide_on_mobile=”small-visibility,medium-visibility,large-visibility” sticky_display=”normal,sticky” class=”” id=”” font_size=”” fusion_font_family_text_font=”” fusion_font_variant_text_font=”” line_height=”” letter_spacing=”” text_color=”” animation_type=”” animation_direction=”left” animation_speed=”0.3″ animation_offset=””]
Goodyear Tire & Rubber (GT)
This week’s stock analysis is Goodyear Tire & Rubber (GT).
The 8 analysts offering 12-month price forecasts for Goodyear Tire & Rubber Co have a median target of 16.50, with a high estimate of 21.00 and a low estimate of 11.00. The median estimate represents a -2.48% decrease from the last price of 16.92. (GT).
The company was founded in 1898 and is based in Akron, Ohio. Goodyear manufactures tires for automobiles, commercial trucks, light trucks, motorcycles, SUVs, race cars, airplanes, farm equipment and heavy earth-moving machinery. Though Goodyear had been manufacturing airships and balloons since the early 1900s, the first Goodyear advertising blimp flew in 1925. Today, it is one of the most recognizable advertising icons in America.
To say the automotive industry has been hard hit by the pandemic and economic lockdown would be a massive understatement. Throughout 2020, broad negative automotive news continued to weigh on suppliers such as Goodyear, especially considering many major automakers are also closing factories in North America for varied lengths of time. Global auto production declined by over 20% in 2020 and discretionary driving was also considerably reduced as people refrained from vacations, social gatherings and even commuting back and forth to work. All these factors dramatically lessened the demand for replacement tires.
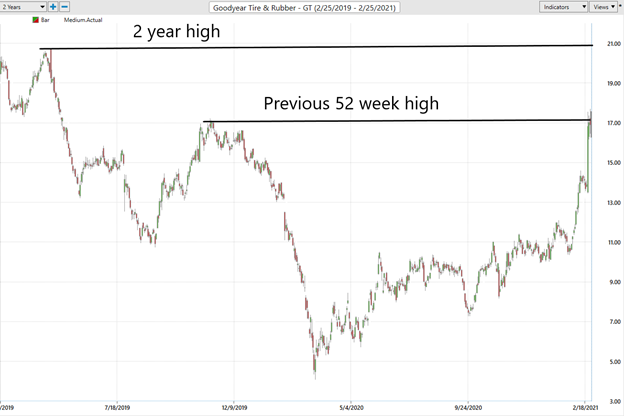
Goodyear Stock was pummeled by the pandemic and economic lockdown. It spent the better part of 2020 trading under $10 per share. Starting with the commonsense metrics over the last 52 week the high has been $17.69 and the low was $4.09. Its annual range $13.60 which amounts to an average trading range of .26 per week. These baseline metrics are values we look at to help define what ‘normal’ means in a particular stock that we are looking to trade.
Whenever a stock reaches its 52 week high or low we instinctively know that something “BIG” is occuring. These boundaries are very important markers of defining value. This does not mean we are automatically buyers when a 52 week low is established, nor does it mean when these boundaries are approached on a chart that we put the stock on our radar for further study.
As we have written about in previous Weekly Stock Studies, it is vital that you always monitor where a stock is trading in relation to its 52 week range.
The 52 week high normally acts as short term resistance. When it is breached it is very common for prices to move substantially higher very quickly.
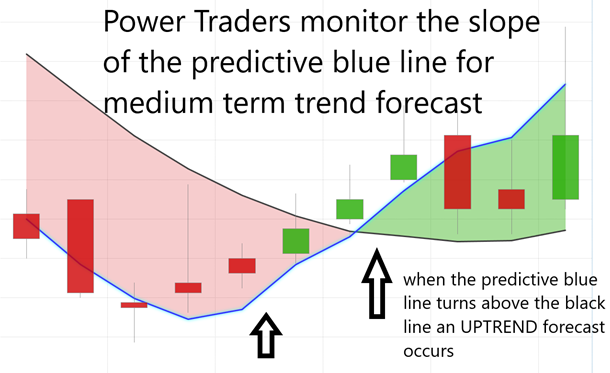
Throughout 2020 Vantagepoint Power Traders monitor the predictive blue line in the Vantagepoint Software to cross-reference trading opportunities in individual stocks.
Three weeks ago, on February 1st, 2021, The A.I. forecast on GT turned higher alerting Power Traders to a short-term trading opportunity.[/fusion_text][fusion_imageframe image_id=”15239|full” max_width=”” sticky_max_width=”” style_type=”” blur=”” stylecolor=”” hover_type=”none” bordersize=”” bordercolor=”” borderradius=”” align_medium=”none” align_small=”none” align=”center” margin_top=”” margin_right=”” margin_bottom=”15″ margin_left=”” lightbox=”no” gallery_id=”” lightbox_image=”” lightbox_image_id=”” alt=”” link=”https://vantagepoint.clickfunnels.com/market-movement-webinar-opt-in?src=MMWebinar_Internal_Website_StockStudy_Direct” linktarget=”_self” hide_on_mobile=”small-visibility,medium-visibility,large-visibility” sticky_display=”normal,sticky” class=”” id=”” animation_type=”” animation_direction=”left” animation_speed=”0.3″ animation_offset=”” filter_hue=”0″ filter_saturation=”100″ filter_brightness=”100″ filter_contrast=”100″ filter_invert=”0″ filter_sepia=”0″ filter_opacity=”100″ filter_blur=”0″ filter_hue_hover=”0″ filter_saturation_hover=”100″ filter_brightness_hover=”100″ filter_contrast_hover=”100″ filter_invert_hover=”0″ filter_sepia_hover=”0″ filter_opacity_hover=”100″ filter_blur_hover=”0″]https://www.vantagepointsoftware.com/wp-content/uploads/2021/02/GT-3.png[/fusion_imageframe][fusion_text columns=”1″ column_min_width=”” column_spacing=”” rule_style=”default” rule_size=”” rule_color=”” content_alignment_medium=”” content_alignment_small=”” content_alignment=”” hide_on_mobile=”small-visibility,medium-visibility,large-visibility” sticky_display=”normal,sticky” class=”” id=”” font_size=”” fusion_font_family_text_font=”” fusion_font_variant_text_font=”” line_height=”” letter_spacing=”” text_color=”” animation_type=”” animation_direction=”left” animation_speed=”0.3″ animation_offset=””]
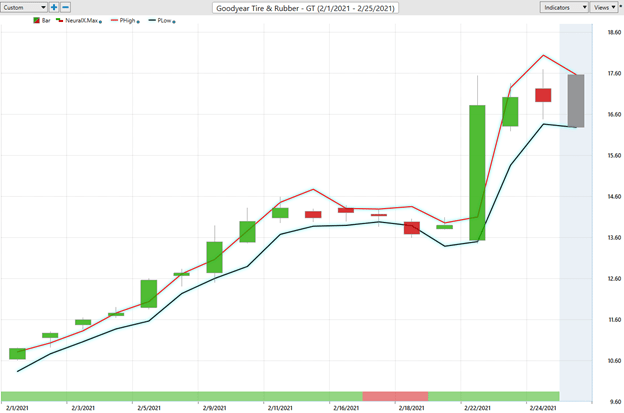
At the bottom of the chart is the Neural Network Indicator which predicts future strength and/or weakness in the market. When the Neural Net Indicator is green it communicates strength. When the Neural Net is Red it is forecasting short term weakness in the market.
Using the Vantagepoint A.I. Software traders were alerted that the ideal value zone on this uptrend was in trying to purchase GT at or below the predictive blue line on the chart. There were four trading sessions where traders could have purchased GT between the price of $11.85 and $14.00 per share. The most recent closing price as I write this is $16.90. A very nice gain in a very short period of time.
Power traders use the predictive blue line in helping to determine both the value zone as well as the trend direction. The slope of the blue line is a forecast of future trend direction. The color of the NeuralNet Index identifies short term strength or weakness in the market.
We advocate that Power Traders cross reference the chart with the predictive blue line and neural network indicator to create optimal entry and exit points.
Power Traders are always looking to apply both the neural network and A.I. to the markets to find statistically sound trading opportunities.
Vantagepoint Daily Price Forecast
Short term traders are also interested in fine tuning their entry and exit points by using the Vantagepoint Daily Price Range Forecast which is also available in the software. The forecast provides a predicted high price and predicted low price for the stock each and every trading day.
At 6:30pm after the market close the software updates and all of the price predictions change based upon what the machine learning, A.I., neural networks and intermarket analysis anticipate moving forward.
Here is the price chart of GT during the most recent runup featuring only the Daily Price Range forecast.
Traders use the Daily Price Range forecast to help determine protective stop loss placement as well. Cross referencing this power tool with the Neural Network Indicator and A.I. predictive blue line provides a myriad of very successful techniques for traders to utilize in deciding how to manage risk in the markets.
Intermarket Analysis
One of the powerful features of the Vantagepoint Software in the Intermarket Analysis. This analytical tool allows traders to see what the key drivers of an assets price are at the click of a button.
We live in a global marketplace. Everything is interconnected. Changes in one price level can have dramatic consequences as that information is digested in other areas of the world.
Trying to determine what these factors are is one of the huge problems facing investors and traders.
There is great value to be had in studying and understanding the key drivers of Goodyears price action. This graphic provides a microcosmic view of what factors are driving the Tire and Rubber universe and the most statistically correlated assets. These factors are all displayed from a standpoint of statistical interconnectedness of prices.
But the Intermarket are also invaluable in highlighting future buyout candidates in similar industries. This recently occurred in highlighting Cooper Tire & Rubber.
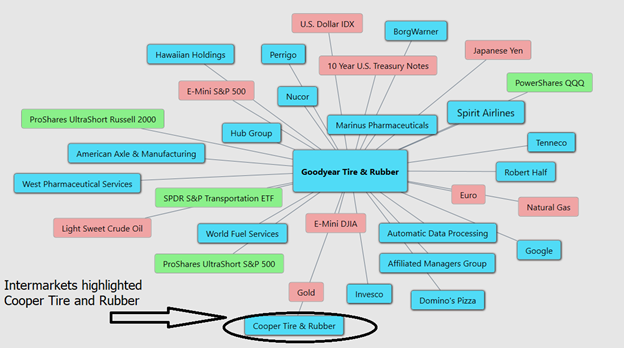
In this instance the artificial intelligence tracked the correlation before the merger/acquisition/buyout were announced.
Here are the key points of the deal that was announced between these two companies.
- Goodyear is paying about $2.8 billion for Cooper Tire, or $54.36 per share.
- Cooper Tire shareholders will receive a mix of cash and Goodyear stock: $41.75 in cash and 0.907 shares of Goodyear for each share of Cooper Tire.
Both Goodyear and Cooper Tire have risen sharply since the A.I. forecast of February 3rd communicated up opportunities in both markets.
[/fusion_text][fusion_text columns=”1″ column_min_width=”” column_spacing=”” rule_style=”default” rule_size=”” rule_color=”” content_alignment_medium=”” content_alignment_small=”” content_alignment=”” hide_on_mobile=”small-visibility,medium-visibility,large-visibility” sticky_display=”normal,sticky” class=”” id=”” font_size=”” fusion_font_family_text_font=”” fusion_font_variant_text_font=”” line_height=”” letter_spacing=”” text_color=”” animation_type=”” animation_direction=”left” animation_speed=”0.3″ animation_offset=””]
Cooper Tire & Rubber is UP 47.88% in 15 trading sessions.
Goodyear is UP 45.82% in the last 15 trading sessions.
The total is a 24% premium to Cooper’s closing price last Friday and gives the combined company a $2.5 billion enterprise value with pro forma 2019 sales of $17.5 billion.
Goodyear shareholders will own about 84% of the new company, and it expects to realize $165 million in savings over the next two years because of the deal.
We approach our analysis not from a valuation perspective but from a pure trader’s viewpoint. Currently the stock appears fairly valued as the recent merger is digested.
Our suggestion – Follow the A.I. trend analysis and practice good money management on all of your trades. Goodyear and Cooper Tire & Rubber has proven over and over again to be a good candidates for short term swing trading opportunities.
Let’s Be Careful Out There!
Remember, It’s Not Magic.
It’s Machine Learning.
Disclaimer: THERE IS A HIGH DEGREE OF RISK INVOLVED IN TRADING. IT IS NOT PRUDENT OR ADVISABLE TO MAKE TRADING DECISIONS THAT ARE BEYOND YOUR FINANCIAL MEANS OR INVOLVE TRADING CAPITAL THAT YOU ARE NOT WILLING AND CAPABLE OF LOSING.
VANTAGEPOINT’S MARKETING CAMPAIGNS, OF ANY KIND, DO NOT CONSTITUTE TRADING ADVICE OR AN ENDORSEMENT OR RECOMMENDATION BY VANTAGEPOINT AI OR ANY ASSOCIATED AFFILIATES OF ANY TRADING METHODS, PROGRAMS, SYSTEMS OR ROUTINES. VANTAGEPOINT’S PERSONNEL ARE NOT LICENSED BROKERS OR ADVISORS AND DO NOT OFFER TRADING ADVICE.
[/fusion_text][fusion_imageframe image_id=”15035|full” max_width=”” sticky_max_width=”” style_type=”” blur=”” stylecolor=”” hover_type=”none” bordersize=”” bordercolor=”” borderradius=”” align_medium=”none” align_small=”none” align=”center” lightbox=”no” gallery_id=”” lightbox_image=”” lightbox_image_id=”” alt=”Free Live Training | 2 Trading Strategies to Dominate 2021″ link=”https://vantagepoint.clickfunnels.com/market-movement-webinar-opt-in?src=MMWebinar_Internal_Website_StockStudy_Direct” linktarget=”_self” animation_type=”” animation_direction=”left” animation_speed=”0.3″ animation_offset=”” hide_on_mobile=”small-visibility,medium-visibility,large-visibility” sticky_display=”normal,sticky” class=”” id=”” filter_hue=”0″ filter_saturation=”100″ filter_brightness=”100″ filter_contrast=”100″ filter_invert=”0″ filter_sepia=”0″ filter_opacity=”100″ filter_blur=”0″ filter_hue_hover=”0″ filter_saturation_hover=”100″ filter_brightness_hover=”100″ filter_contrast_hover=”100″ filter_invert_hover=”0″ filter_sepia_hover=”0″ filter_opacity_hover=”100″ filter_blur_hover=”0″]https://www.vantagepointsoftware.com/wp-content/uploads/2021/02/3Tips_Webinar_Banner.jpg[/fusion_imageframe][fusion_text columns=”” column_min_width=”” column_spacing=”” rule_style=”default” rule_size=”” rule_color=”” font_size=”” line_height=”” letter_spacing=”” text_color=”” content_alignment_medium=”” content_alignment_small=”” content_alignment=”” animation_type=”” animation_direction=”left” animation_speed=”0.3″ animation_offset=”” hide_on_mobile=”small-visibility,medium-visibility,large-visibility” sticky_display=”normal,sticky” class=”” id=””][/fusion_text][fusion_text columns=”” column_min_width=”” column_spacing=”” rule_style=”default” rule_size=”” rule_color=”” font_size=”” line_height=”” letter_spacing=”” text_color=”” content_alignment_medium=”” content_alignment_small=”” content_alignment=”” animation_type=”” animation_direction=”left” animation_speed=”0.3″ animation_offset=”” hide_on_mobile=”small-visibility,medium-visibility,large-visibility” sticky_display=”normal,sticky” class=”” id=””][/fusion_text][fusion_text columns=”1″ column_min_width=”” column_spacing=”” rule_style=”default” rule_color=”” font_size=”” line_height=”” letter_spacing=”” text_color=”” content_alignment_medium=”” content_alignment_small=”” content_alignment=”” animation_type=”” animation_direction=”left” animation_speed=”0.3″ animation_offset=”” hide_on_mobile=”small-visibility,medium-visibility,large-visibility” sticky_display=”normal,sticky” class=”” id=”” fusion_font_variant_text_font=””][/fusion_text][/fusion_builder_column][/fusion_builder_row][/fusion_builder_container]


