


CUSTOMIZE MOVING AVERAGES FOR EARLIER TIMING SIGNALS
By Louis B. Mendelsohn
With the emergence of the global economy and advancements in information and telecommunications technologies (beginning in the mid-1980s and accelerating throughout the 1990s), the world’s financial markets have become globally interdependent and interconnected. These structural changes, unfolding over many years, were no secret. To the contrary, economic globalization and the melding of global financial markets had been widely reported in the financial media, particularly at times of acute global economic crisis that often erupted in one locale and spread from one time zone to another. Yet most individual traders failed to appreciate the implications that globalization would have on the domestic stocks or stock index markets that they trade. They have been slow to adapt their trading strategies accordingly.
Even those traders who did recognize that the emergent global economy had dramatically altered the way in which the world’s financial markets interact often drew a blank when asked how they take these intermarket effects into consideration in their own trading. The focus of technical analysis has continued to be limited to each individual market – maybe because it’s just easier to do it that way. But the price paid for taking the easy way out has been enormous.
Markets are not Isolated
Millions of new traders who were drawn into the markets during the late 1990s, with little awareness of market globalization, deceived themselves into thinking that, somehow, their own portfolios would be insulated from the external effects of related markets, global interest rate fluctuations, and currency devaluations. For these traders, simply following the prices of individual stocks or indexes (with little or no regard to what’s happening elsewhere) and buying on price dips seemed like a free ticket to financial freedom and early retirement.
If you hadn’t already learned lessons from recent stock market routs brought on by various global financial crises over the past decade, including the 1997 Asian currency collapse and the 1999 run up in oil prices and subsequent Fed over-tightening, the seemingly sudden onset of the bear market in early 2000, that burst the speculative dot-com and high tech bubbles, may have caught you off guard.
Analysis Methods Re-examined
Interestingly, many equities traders, still in a state of disbelief or denial, are reluctant to examine how the shortcomings of their analysis methods may have contributed to their failure to protect paper profits, which quickly turned into market losses. They find it easier to place blame elsewhere – on the Fed, 9/11, corporate scandals, lax regulation, the dot-com mania, and the general climate of greed that peaked with the Enron and WorldCom debacles.
Yet, other traders, having learned lessons from recent market routs and, as a result, more aware of the globally interconnected nature of the financial markets, saw the handwriting on the wall and moved to cash or bonds early-on. For these traders the “been there, done that” mentality kept the market euphoria in perspective. They wisely paid attention to the broader financial landscape involving interest rate-sensitive markets such as Treasuries, as well as the U.S. dollar, the euro currency and other influential markets such as crude oil and gold.
Broad Approach Is Required in Today’s Global Markets
Millions of short-term traders and long-term investors have been humbled by the recent carnage. Planned retirements were deferred and many recent retirees were forced to return to the workforce. Now, an entire generation of traders, particularly baby boomers with limited time horizons, will be hard pressed to rebuild their nest eggs following the financial devastation of the past three years. In order to be successful at navigating the global financial markets in the months and years ahead, these traders will need to study the mistakes made during this latest market rout and pay more serious attention to the global context in which the financial markets operate.
Many trend following trading strategies that focus on individual markets, such as the widely popular moving averages, worked well during the up-trending markets of the late 1990s. However, they revealed their Achilles’ heel in early 2000 as the U.S. equities markets began their precipitous decline. With considerable uncertainty and risk inherent in the world’s financial markets today, exacerbated by the threat of global terrorism and geopolitical crises, it is now more crucial than ever that technical analysis be broadened to take into consideration market globalization and the intermarket effects of related markets on one another. Parochial approaches that contributed to recent market losses need to be supplanted by a more comprehensive analytic framework.
The Markets Are Evolving; So Too Must Technical Analysis
Let’s use moving averages as an example to illustrate how intermarket analysis can be utilized in conjunction with a traditional single-market trading strategy. In this manner a comprehensive, proactive approach that is more responsive to impending changes in trend direction can be created.
First some background on moving averages. They are easy to compute and are used to determine the current trend direction of a market. For example, today’s five-day simple moving average of closes is calculated by adding up the most recent five days’ closing prices and dividing by 5. Simple enough. This same approach can be used to calculate moving averages of various lengths, such as the popular 200-day moving average, often used in conjunction with the Dow Jones Industrial Average to indicate its underlying trend direction.
Moving averages filter out the random “noise” in price data by “smoothing” or “averaging” out price fluctuations. However, because moving averages are based on past single-market price data up through and including the current period’s price, moving averages are known as a “lagging” technical indicator, which always trails after turning points in the market.
This means that entry and exit signals based on moving averages occur after the trend has already changed direction. While traders were able to record profits on paper using single-market trend-following indicators such as moving averages during the late 1990s, the experience of the last three years (involving the market crash followed by numerous bear market rallies turned traps) underscores the fact that realizing a market made a top or bottom a week ago doesn’t suffice. Even a several-day lag can be devastating.
Creating Leading Indicators From Lagging Indicators
Interestingly, popular single-market indicators such as moving averages can be modified to incorporate intermarket data and even constructed so that they become leading, rather than lagging, indicators. This can be accomplished in a number of ways, one of which is through a mathematical tool called “neural networks” that can be used to forecast moving averages based upon both single market and intermarket data.
For instance, to forecast the short-term trend direction of a stock index such as the Nasdaq-100 Index, both past market data on the Nasdaq-100 Index itself (including open, high, low, close, volume and open interest), and intermarket data from various related markets, are analyzed by the neural network. These related markets might include the Dow Jones Industrial Average, 30-year Treasury bonds, S&P 500 Index, U.S. Dollar Index, the Swiss Franc, the Euro, New York Stock Exchange Composite Index, Bridge/CRB Index, Dow Jones Utility Average, gold, and New York light crude oil, to name a few.
In this paradigm, a moving average is forecasted for a future date, then compared to today’s actual moving average which is calculated solely on past single-market prices. This approach is similar to a traditional moving average crossover strategy which compares calculated moving averages to one another. The distinction in this paradigm, which transforms this strategy from a lagging into a leading indicator, is that one of the moving averages is a forecast for a future date based substantially on intermarket data, not just calculated on recent single-market data.
Forecasted Moving Average Generates Market Signals
When the forecasted moving average for the future date is greater than today’s actual moving average, the market is expected to move higher over that time frame. Similarly, when the forecasted moving average is less than today’s actual moving average, the market is expected to move lower. The difference between the two moving averages from one day to the next (as they are updated each day) indicates the relative strength of the expected move over that time frame.
For example, a forecasted five-day simple moving average for two days from today is compared to today’s actual five-day moving average. If the forecasted moving average is less than today’s actual moving average, the market is expected to move lower. When the difference reaches a maximum negative value and starts to narrow (indicating that the downward trend is beginning to lose strength), this is an early warning that the market is poised to make a bottom and turn up soon.
Subsequently, when the forecasted average does, in fact, cross the actual moving average from below to above so that the difference between them now goes from negative to positive, this confirms that the market is expected to make a bottom and reverse direction, moving higher within the next two days.
Depending on a trader’s account size, risk propensity, trading style and objectives, he might tighten stops or close out a trade once the difference narrows by a minimum amount. More aggressive traders might even reverse positions, expecting that a crossover will occur in the next day or two. Other traders might wait for the crossover to occur before taking action.
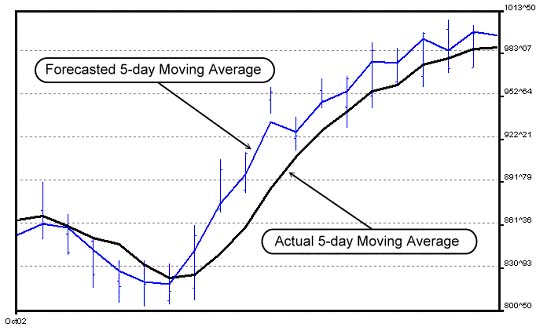
The chart below shows a crossover strategy comparing a forecasted five-day simple moving average for two days in the future with today’s actual five-day moving average for the Nasdaq-100 Index. Notice that the actual five-day moving average lags behind both the forecasted average and the market.
By utilizing leading indicators, such as the above-mentioned forecasted moving average crossover strategy, based on both single-market and intermarket data from globally related markets, early indications of imminent changes in trend direction can become apparent before they show up on traditional daily price charts or can be identified by popular single-market trend following indicators.
There Is No Financial Holy Grail
Admittedly, it is unrealistic to expect leading indicators utilizing intermarket analysis to predict the future trend direction of a market with 100-percent accuracy. The elusive Holy Grail is the financial market equivalent of a desert mirage. It doesn’t exist. This is another lesson that traders should have learned from the latest market rout. There is no secret to instant wealth in the financial markets, just a lot of research and hard work – and lessons learned.
In the future, as the global futures and equities markets become even more intertwined – e.g., futures contracts on individual stocks capture the attention of traders seeking increased leverage, and more traders incorporate intermarket analysis into their trading strategies – innovative leading indicators, such as the forecasted moving average crossover strategy briefly outlined in this article, will become part of every serious trader’s technical analysis arsenal. As the boundaries of technical analysis expand further to accommodate the increased complexity of the global financial markets, traders who continue to ignore these considerations will do so at their own peril.
—————————————————————
Louis Mendelsohn is president and chief executive officer of Market Technologies, Wesley Chapel, Florida, a trading software development firm founded in 1979, that specializes in developing trend forecasting software. Mendelsohn can be reached through his firm’s website atwww.ProfitTaker.com, or by e-mail at Louis@ProfitTaker.com.