


Using Artificial Intelligence to Analyze Intermarket Relationships
By Louis B. Mendelsohn

Anyone who has been around the financial markets for any length of time realizes that what happens in one market often has an effect on what happens in another. No individual market operates in a vacuum, especially in today’s global, 24-hour, electronically traded marketplace where it takes only moments for a market-moving event to influence prices in a number of related markets around the globe.
Yet, much of today’s market analysis continues to focus on the traditional single-market approach that has been around for many years. Although an increasing number of traders do rely on technical analysis focusing on price action on a chart, they tend to look only two ways – backward at historical prices in an attempt to gauge how that market will act moving forward. They really should add a third dimension – sideways to detect the impact that prices in other markets have on the price of the market they are trading.
Challenge: Quantifying
Although there has long been general awareness of intermarket relationships, the difficulty is in quantifying these relationships in terms that traders can use in making their decisions. The first challenge is determining which markets have the most influence on the market being traded. The second is determining the degree of influence these markets have on one another.
Some analysts like to perform correlation studies of two related markets, measuring the degree to which the prices of one market move in relation to the prices of the second market. Two markets are considered perfectly correlated if the price change of the second market can be forecasted precisely from the price change of the first market. A perfectly positive correlation occurs when both markets move in the same direction. A perfectly negative correlation occurs when the two markets move in opposite directions.
But this approach has its limitations because it compares prices of only one market to another and does not take into account the influence exerted by other markets on the target market. In the financial markets and especially the forex markets, a number of related markets need to be included in the analysis rather than assuming that there is a one-to-one cause-effect relationship between just two markets.
Nor do the correlation studies take into account the leads and lags that may exist in economic activity or other factors affecting markets such as forex. Their calculations are based only on the values at the moment and may not consider the longer-term consequences of central bank intervention or a policy change that takes some time to play itself out in the markets.
Solution: Artificial Intelligence
When you consider all of the many possible intermarket relationships – and all of them shifting and changing at the same time – you might wonder how you could possibly pick out patterns and relationships from such a mass of data. One solution is the use of artificial intelligence (neural networks) applied to price, volume and open interest data on each target market and various related markets.
Unlike the subjective approach of chart analysis, neural networks provide an objective way to identify and analyze the complex relationships that exist among various markets. They can reveal hidden patterns and correlations in these markets that the eye could never spot on a chart or through the use of traditional single-market indicators that tend to lag the markets.
A neural network is not a human brain, but it takes on some brain-like functions as it studies data, “learns” relationships within and between markets, recognizes patterns in past data and uses this information to make forecasts about the target market. The neural net is essentially a modeling tool that accepts a variety of data and processes information in a manner similar to the brain (see Figure 1).
Figure 1. Neural networks try and try again to find hidden patterns
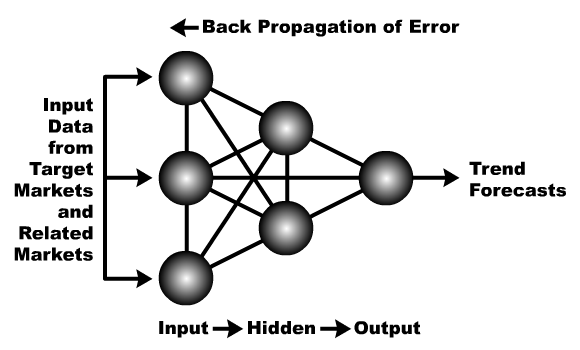
Source: VantagePoint Intermarket Analysis Software (www.TraderTech.com)
Neural nets were used in corporate decision-making, medical diagnostics and many other applications before I began applying them in financial forecasting in the late 1980s. Fortunately, traders do not need to know all of the intricate details that go into neural network analysis because expert developers and computer programmers do that work, but it is important to have some understanding of how the process works so you can develop confidence in the results.
Input layer
A critical first step in applying an artificial intelligence neural network analysis is data input. The forecasts you get out of a neural network will be only as good as the data you put into it. “Garbage in, garbage out” is a computer truism, and it certainly applies to neural networks.
Collecting, cleaning, selecting and preparing the data for analysis are all important. Neural networks are not limited to single-market data inputs nor are they limited solely to technical data inputs. The data can go far beyond just price or technical indicators but can include such items as volume and open interest for the target market as well as intermarket data from related markets. It can even use fundamental data or, in the case of looking at the effects of hurricanes on the markets – the “hurricaneomic” effect – it can even use past data on weather patterns.
With VantagePoint Trading Software, for example, the raw data inputs involved in forecasting moving averages for euro FX futures include the daily open, high, low, close, volume and open interest for euro FX plus the daily open, high, low, close, volume and open interest data for nine related markets:
- Australian dollar/U.S. dollar (AUD/USD)
- Australian dollar/Japanese yen (AUD/JPY)
- British pound
- Euro/Canadian dollar (EUR/CAD)
- Gold
- Nasdaq 100 Index
- British pound/Japanese yen (GBP/JPY)
- British pound/U.S. dollar (GBP/USD)
- Japanese yen
Programs are designed specifically for a particular target market, using five neural networks in a two-level hierarchy to forecast five different indicators for that market (see Figure 2).
Figure 2. Map of a Successful Neural Network Trading Program
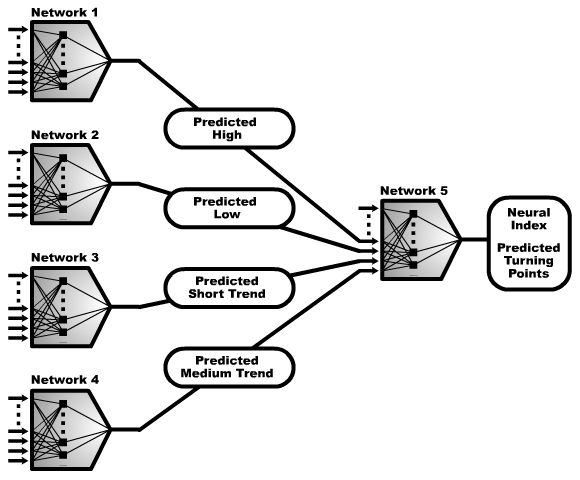
Source: VantagePoint Trading Software (www.TraderTech.com)
-
The first network forecasts tomorrow’s high to help set stops for entry and exit points.
-
The second network forecasts tomorrow’s low to help set stops for entry and exit points.
-
The third network forecasts a 5-day moving average of closes two days into the future to indicate the expected short-term trend direction within the next two days.
-
The fourth network forecasts a 10-day moving average of closes four days into the future to indicate the expected medium-term trend direction within the next four days.
-
The fifth network indicates whether the market is expected to change trend direction within the next two days, by making a top or a bottom.
The first four networks at the primary level of the network hierarchy make independent market forecasts of the high, low, short-term trend and medium-term trend. These predictions are then used as inputs into the fifth network, along with other intermarket data inputs, at the secondary level of the network hierarchy, to predict market turning points.
Once all of the raw input data has been selected, it is preprocessed or massaged using various algebraic and statistical methods of transformation which help to facilitate “learning” by the neural network. That means it is converted into a form that the learning algorithm in the next layer can best exploit to get the most accurate forecasts in the shortest amount of time.
Hidden layer
The hidden layer is the learning algorithm used for internal processing to store the “intelligence” gained during the learning process. There are a number of types of learning algorithms. The network recodes the input data into a form that captures hidden patterns and relationships in the data, allowing the network to come to general conclusions from previously learned facts and apply them to new inputs. As this learning continues, the network creates an internal mapping of the input data, discerning the underlying causal relationships that exist within the data. This is what allows the network to make highly accurate market forecasts.
Many different learning algorithms can be used to train a neural network in an attempt to minimize errors associated with the network’s forecasts, but some are slow and others are unstable.
Training a neural network is somewhat like human learning: repetition, repetition, repetition. The neural network learns from repeated exposures to the input data, and learned information is stored by the network in the form of a weight matrix. Changes in the weights occur as the network “learns.”
Similar to the human learning process, neural networks learn behaviors or patterns by being exposed to repeated examples of them. Then the neural networks generalize through the learning process to related but previously unseen behaviors or patterns. One popular network architecture for financial forecasting is known as a “feed-forward” network that trains through “back-propagation of error.”
Although a neural network-based trading program can accommodate and analyze vast amounts of data, one thing a programmer must avoid is “over-training,” which is analogous to “curve-fitting” or “over-optimization” in testing rule-based trading strategies. It takes considerable experimentation to determine the optimum number of neurons in the hidden layer and the number of hidden layers in a neural network.
If the hidden layer has too few neurons, it can’t map outputs from inputs correctly. If a network is presented with too many hidden layer neurons, it memorizes the patterns in the training data without developing the ability to generalize to new data and discover the underlying patterns and relationships. An over-trained network will perform well on the training data but poorly on out-of-sample test data and subsequently during real-time trading – just like an over-optimized rule-based system.
Output layer
The output layer is where the network’s forecasts are made. During training, the network makes its forecasts, errors are computed and “connection weights” between neurons are adjusted prior to the next training iteration. Connection weights are altered by an algorithm – the “learning law” including the back-propagation method – to minimize output errors. Lots of adjustments may be necessary at any point along the way to get the desired results.
Two types of real number outputs in financial analysis include price forecasts, such as the next day’s high and low, and forecasts of forward-shifted technical indicators, such as the 5-day moving average value for two days in the future. The network developer has to decide not only what output to forecast but also how far into the future to make the forecast.
Then comes extensive testing to verify the network’s ability to forecast accurately. Testing is performed by creating an independent test file of data not used during the training process. In the testing mode the neural network is given these new inputs and uses the representation that it had previously learned to generate its forecasts so the network can be evaluated under real-time conditions. This is analogous to “walk-forward” or “out-of-sample” testing of rule-based trading strategies. The developer can compare performance results from various networks and decide which network to use in the final application. Figure 3 shows the output of one such application.
Figure 3. Taking Neural Network Output to the Chart
As with other aspects of neural network and intermarket analysis research, there are a number of ways to evaluate performance of a neural network-based trading strategy. One thing you don’t want to do is tweak it by making human “adjustments” without going through the whole development cycle as such changes could undermine the accuracy and integrity of the network’s forecasts and results. That is one reason why traders are not given the option to make any change in parameters in some programs because an expert has already defined the best parameter choices after more exhaustive research than most traders could ever accomplish.
The result is a trading tool that is not only highly accurate but also very simple to use even by novice traders. Just like you don’t have to become an automotive engineer to drive your car, you don’t have to become a rocket scientist to apply the forecasting power of neural networks in trading the markets.
Obviously, no neural network nor any other trading tool is going to be 100% accurate at market forecasting. Unforeseen events and random price action will continue to produce uncertain markets. However, neural networks can help you get as close to accurate market forecasts as possible. They are an excellent mathematical tool for finding hidden patterns and relationships in seemingly disparate intermarket data and making highly accurate short-term market forecasts in a consistent, non-subjective, quantitative manner.
About the Author
Louis B. Mendelsohn is president and chief executive officer of Market Technologies, a trading software development firm founded in 1979, that specializes in the use of artificial intelligence, intermarket analysis and predicted moving averages to forecast short-term trend direction. His firm’s software, VantagePoint Trading Software, predicts market trends with up to 86% accuracy for stocks, futures, forex and etfs. Market Technologies’ website is www.tradertech.com and the phone numbers are 813-973-0496 or 800-732-5407.