


Let me level with you: most investors don’t pick stocks — they pick stories.
They get hooked on a flashy founder, a slick commercial, or some influencer hyping the “next big thing” on social media. And once they’re emotionally attached, forget it. They stop checking the scoreboard. They stop asking the one question that matters — “Is this actually making me money?” Paul Tudor Jones said it best: if you’re serious about growing wealth, you find the fastest horse in the race. Not the prettiest, not the most talked about — the one running circles around everything else. That’s what this article is about. Not hype. Not headlines. Just raw, unfiltered performance.
So, here’s the deal: I’ve lined up 14 of the biggest and most talked-about assets in the world and stripped away the noise. We’re talking about the Magnificent 7 — Apple, Microsoft, Amazon, Alphabet, Meta, Tesla, and Nvidia — plus the wildcard MicroStrategy ($MSTR), which is basically a Bitcoin proxy in a suit and tie. I threw in the heavyweight champ of crypto, Bitcoin, and the classic contenders, Gold and Silver. And just to keep everyone honest, we’ve got the big three indexes — S&P 500, Nasdaq, and the Dow Jones. We’re putting them all under the same spotlight and measuring what really counts: performance across multiple time frames. These are the most actively traded assets and by monitoring their performance our hope is to genuinely understand the larger macro trends functioning in the world.
This isn’t theory or opinion. It’s not some Ivy League thesis on why a stock should go up. It’s the hard data — what these assets have actually done across multiple time frames. Because when you’re trying to win the wealth game, you don’t want a bedtime story. You want results. This article is here to show you what the smart money sees, what the elite traders already know, and how you can start thinking like the pros who bet on the fastest horse — and win.
Let’s not sugarcoat it — the macro landscape has been one giant funhouse mirror. One month it’s inflation that’s too hot to handle, the next it’s recession alarm bells. Interest rates have been jerking markets around like a rodeo bull, with central bankers talking tough while Wall Street tries to guess when the next pivot’s coming. Throw in tariffs, geopolitical tensions, and sluggish global trade, and what you get is the economic version of white noise — loud, chaotic, and impossible to dance to. The headlines say one thing, the data says another, and your gut tells you something entirely different. No wonder most investors are paralyzed or throwing darts in the dark.
And that’s the trap. When things get messy, the media gets louder. Clickbait about crashes, bubbles, “once-in-a-generation buying opportunities” or “unprecedented risks” floods every screen. Traders get lured in by narrative — some charismatic CEO with a moonshot mission, or some doom prophet warning about the end of the dollar.
But here’s the truth: if you’re basing trades on headlines, you’re walking into the casino blindfolded. The market doesn’t pay you for stories. It pays you for performance. What’s moving, what’s trending, and what’s leaving the rest of the pack in the dust — that’s where the smart money goes.
The antidote to confusion is clarity, and clarity comes from results. Cold, hard, provable results. That’s why the smartest investors watch what the best-performing assets are doing over time. Not just day-to-day noise, but over months, years, even decades. It’s not always the assets that scream the loudest that make the biggest moves — it’s the ones quietly compounding and outpacing everything else. You want to see through the fog? Watch the tape. Monitor performance. Because that’s where the truth lives.
Let’s take a little walk down memory lane. Over the past five years, we’ve been hit with more economic curveballs than a Yankees bullpen. And every time, the talking heads lined up to tell us exactly what was going to happen. Spoiler alert: most of them got it dead wrong. Here are seven of the biggest macroeconomic firestorms — and how the experts completely fumbled the script.
- COVID-19 Shutdowns: When the pandemic hit, the consensus was simple: global markets would crater, stay dead for years, and we’d all be growing vegetables in the backyard. And for a few weeks, it felt like that. Then, somehow, stocks came roaring back. Tech exploded. Stay-at-home plays became rocket ships. The S&P 500 made all-time highs in the middle of a global lockdown. Few saw that coming — at least not the “experts.” Luckily, VantagePoint did.
- Unlimited Stimulus Spending: They told us printing trillions would “stabilize the economy” without serious consequences. No inflation, no problem. Just Modern Monetary Theory doing its thing. Free money for everyone. But reality doesn’t work like a classroom model. We got inflation — not the good kind — and now central banks are scrambling like frat boys trying to clean up before the parents get home.
- Currency Debasement: Hard money advocates screamed from the rooftops: “This is it! The dollar is toast!” Gold bugs loaded up. Bitcoin maxis declared fiat’s funeral. But the dollar… held firm. Why? Because in a world full of weak currencies, the dollar was still the least ugly contestant at the dance. That didn’t make it healthy, it just meant the rest were sicker.
- Inflation and the “Transitory” Lie: First it was “inflation isn’t real.” Then it was “okay, but it’s transitory.” Then it was “we may have underestimated things.” You think? The Fed went from shrugging off inflation to launching the fastest rate hike cycle in decades. Meanwhile, real people got crushed at the gas pump, the grocery store, and pretty much anywhere cash changed hands.
- Interest Rate Whiplash: Rates went from zero to wrecking ball in record time. The experts said it wouldn’t last — “they’ll pivot any minute.” But the pivot never came. Mortgage rates doubled. Credit card APRs turned into loan shark territory. And yet… the market kept grinding higher. That’s the paradox that still has the old guard scratching their heads.
- Recession Predictions: Every year since 2021, somebody’s been calling for a recession “in the next 6 months.” Recession watch became a cottage industry. And yet, here we are — weak growth in places, but no full-blown crash. It’s like Lucy pulling the football away from Charlie Brown. Again. And again.
- Tech Bubble 2.0: With A.I., cloud computing, and semiconductors surging, the chatter turned to “dot-com 2.0.” But instead of bursting, tech stocks like Nvidia and Microsoft went parabolic. Turns out, innovation backed by cash flow isn’t the same thing as Pets.com in 1999.
Bottom line? The world’s noisy. Analysts guess. Pundits pontificate. But the scoreboard doesn’t lie. Performance is the only truth that matters — and it’s the truth we’re decoding in the Smart Money Matrix.
Now if the first seven macro trainwrecks weren’t enough to shake your confidence, don’t worry, there’s more where that came from. The last five years have felt like one giant stress test for investors. And just when you think the dust is settling, the next plot twist hits harder than a Mike Tyson comeback. Take the supply chain disaster. For decades, everyone worshipped at the altar of “just-in-time” inventory. It was sleek, efficient, and profitable — until it collapsed like a house of cards during COVID. Suddenly, a missing $1 part could shut down a $50,000 car. That’s not just bad logistics — that’s systemic fragility masquerading as sophistication.
Then there’s the great unraveling of globalization. Tariffs, pandemics, and rising nationalism slammed the brakes on the “world is flat” playbook. Companies started yanking factories out of China and scrambling to rebuild supply chains closer to home. That shift costs money — and the inflation monster loves to feed on it. Add in central bank credibility falling off a cliff, and you’ve got a market trying to navigate without a compass. Powell and company told us inflation was “transitory,” then flipped like a pancake and hiked rates faster than we’ve seen in 40 years. No wonder people stopped trusting the script.
Meanwhile, retail investors staged a revolution — armed with smartphones, Reddit threads, and a “let’s burn it all down” attitude. Meme stocks, Dogecoin, FOMO-fueled moonshots — you name it, they traded it. And don’t forget the A.I. boom that turned Nvidia into a $2 trillion beast and made companies scramble to mention “machine learning” just to stay relevant. Through all this noise — housing markets freezing, the BRICS nations challenging the dollar, and the ESG investing bubble wobbling — it’s a miracle anyone knows which way is up. That’s why smart traders don’t anchor themselves to narratives. They anchor to numbers. To price action. To performance. Because when the entire world’s a carnival of confusion, the scoreboard doesn’t lie. It just tells you who’s winning.
Let me hit you with something the financial media almost never talks about: time frame matters — and it matters a lot. Looking at performance over just a week or a month is like trying to judge a movie by watching five seconds of random footage. It doesn’t tell the story. It doesn’t show the journey. You want to know if an asset is truly winning the global wealth race? You’ve got to zoom out. Because volatility isn’t just noise, it’s context. It’s the price of admission to wealth. And the only way to understand it is to look at how assets behave across multiple time frames — one year, five years, ten years, even fifty years.
Let’s take a little detour back to August 15, 1971, a date that should be etched into every serious investor’s mind. That’s when President Richard Nixon took the U.S. off the gold standard for good, effectively severing the dollar’s last tie to hard money. At that moment, gold was priced at $35 an ounce. Fast forward to today, and gold is pushing $3,500 an ounce. That’s not a typo. That’s a 100x return. Now here’s the kicker—over that same stretch, the Dow Jones Industrial Average, which supposedly tracks the elite blue-chip titans of American industry, hasn’t even come close to keeping pace with the yellow metal.
Think about that. Gold — an inert lump of metal that produces no cash flow, pays no dividend, and doesn’t do flashy earnings calls — has crushed the Dow when measured over the long haul. Why? Because fiat currency isn’t anchored to anything anymore. Since 1971, it’s been a free-for-all of money printing, deficit spending, and debt expansion. And if you’re measuring your wealth in dollars, you’re measuring it against a moving target that keeps shrinking. When you view performance across decades, the illusion of stability in stocks, cash, or even central bank credibility starts to crack. That’s why we build the Smart Money Matrix around multiple time frames — so you can cut through the noise and see the truth in the trend. Because that’s where smart money lives — not in stories, not in soundbites, but in performance that endures.

When I look at gold’s long-term performance relative to the Dow Jones Industrial Average, I find myself — quite honestly — scratching my head. Here we are, comparing a shiny piece of metal with no board of directors, no quarterly earnings calls, and no product pipeline… to thirty of the most powerful, best-capitalized companies in the world. And yet, over the long arc of history, gold has significantly outperformed them. That’s not a conspiracy theory. That’s not a narrative. That’s math. And it forces a very uncomfortable realization.
What we’re witnessing is the consequence of perpetual currency debasement. Since we severed the dollar’s tie to gold in 1971, the value of our currency has quietly — sometimes not so quietly — eroded. In that context, gold isn’t just some relic. It’s doing exactly what it’s designed to do: preserve purchasing power in a system that steadily leaks it. Whether you like that conclusion or not, the performance data lays it bare. There’s no editorial slant in the chart. There’s no political spin in the compound return.
And here’s the part that stings: there’s a great deal of smoke and mirrors at play. From the political class to the central bankers at the Fed, the public is fed a constant stream of confidence, the idea that the system is sound, the money is stable, the growth is real. But gold’s performance over the last five decades is a quiet, damning counterpoint. It tells a different story. A story the mainstream doesn’t want to tell, but the numbers won’t stop whispering.
What does it really mean when gold goes up 100x?
Did gold suddenly become some magical new asset that invented WiFi and brews your morning coffee? No. Gold is still just gold — same shiny rock it’s been for thousands of years. It didn’t change. You did. Or more accurately, your money did.
See, when gold shoots up from $35 to $3,500, it’s not that gold’s suddenly more “valuable.” It’s that the dollars we measure it in have been beaten with a baseball bat made of debt, deficits, and non-stop money printing. The truth is staring us right in the face — the currency has been debased, slowly and quietly, over the last 54 years, since Nixon slammed the gold window shut in 1971.
And while the Fed and the political elite flash their toothy smiles and talk about “price stability,” the money printer’s been going full throttle — blasting out paper so fast it’s a miracle the ink hasn’t run dry. That’s what you’re really seeing when gold goes 100x. It’s not a rise in value — it’s a fall in trust. A slow, steady collapse of the measuring stick itself. And the worst part? Most people don’t even notice it. But if you’re watching gold… you do.
The only potential caveat in this comparison — the one detail that could modestly shift the outcome — is dividends. When we look at the Dow Jones Industrial Average over the last 54 years, we’re typically measuring price appreciation alone, not total return. And to be fair, dividends do matter. They’ve historically played a substantial role in the total return of equities, particularly over long timeframes. But the question is: how much would they really move the needle?
Let’s break it down. The average dividend yield of the Dow has fluctuated over the decades — from as high as 5% in the 1970s to around 2% or lower in recent years. For the sake of estimation, let’s assume a long-term average dividend yield of about 3%. Compounded over 54 years, reinvested consistently, that adds up. Using a rough calculation, a 3% dividend yield reinvested annually would nearly double the nominal return of the Dow over that span.
But remember: gold has surged from $35 to over $3,500 an ounce in the same period — a 100x gain in raw price with no yield, no quarterly reports, and no managerial risk. It’s still a sobering comparison. Dividends help close the gap, but they don’t erase the bigger message: in a system built on ever-expanding debt and money supply, gold has held its ground — and then some.
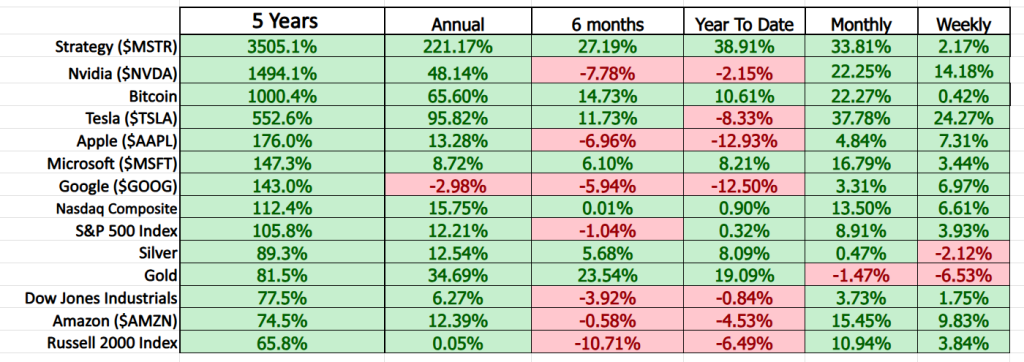
Here’s what I love to do — every quarter, like clockwork. I take the biggest, baddest assets on the planet and toss ‘em into one giant spreadsheet. No fluff. No spin. Just raw numbers lined up in cold, hard columns. Gold, Bitcoin, the Magnificent 7, the Dow, the S&P, even Silver if it’s trying to act relevant that month. I track their performance across every time frame that matters — year-to-date, 1-year, 6-months, Year to Date, 1 month and 1 week — and let the data spill its guts.
Because here’s the secret the talking heads never tell you: performance tells the truth. Not the press releases. Not the jawboning from the Fed. Not the headline that screams “Tech Collapse!” while Nvidia’s making new all-time highs. When you line up the assets and study how they actually move, you get a front-row seat to reality. And guess what? Reality ain’t found on CNBC — it’s found in price action.
By laying it all out, quarter after quarter, I can sniff out the disconnect between what they say is happening and what’s really happening. And when you learn to read that spreadsheet like a war map, you stop falling for the same old-same old. You stop reacting — and you start seeing the trend before everyone else even knows it’s there. That’s not luck. That’s discipline. And it’s the closest thing you’ll get to X-ray vision in this game.
So, let’s start with a simple 5-year analysis. To begin with, how have you done over the last 5 years? If you had the opportunity to invest or trade differently what would you change? Do you have any idea what have been the best performing assets over the last 5 years? Here is the breakdown and it has a powerful narrative attached to it, if you only choose to have eyes to see and ears to hear.
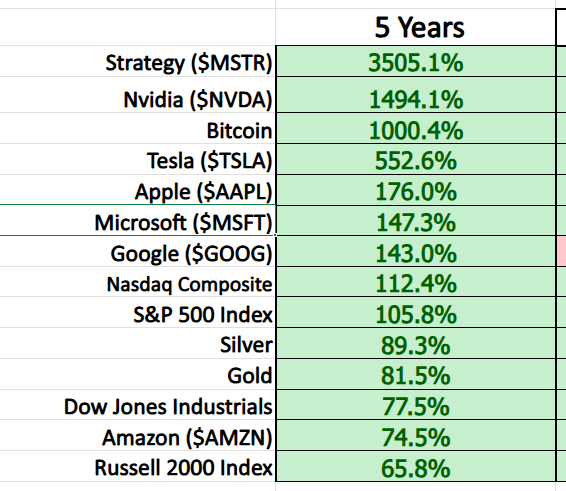
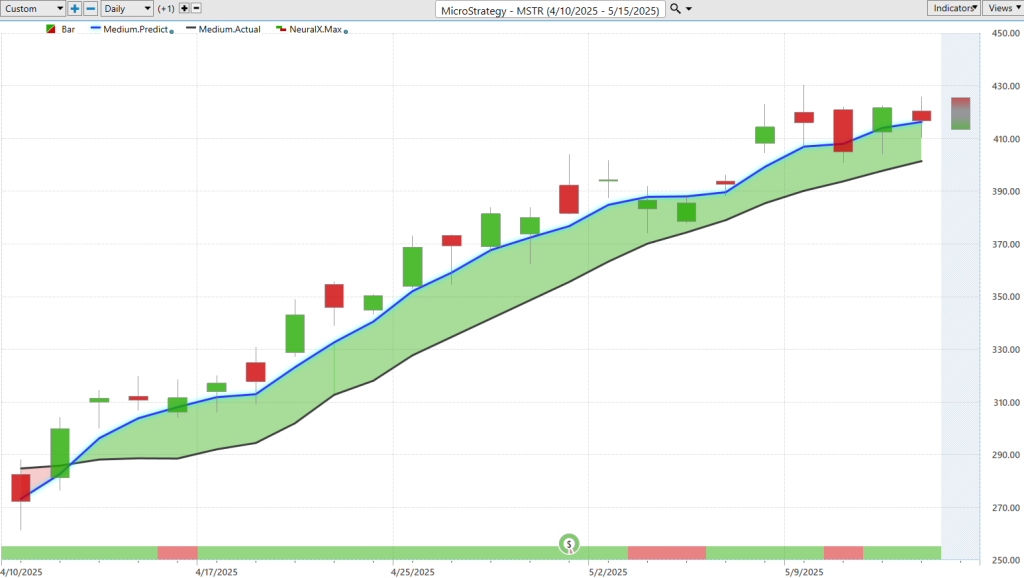
Let’s talk about what’s really going on when $MSTR rockets 3,000% in five years — and not because they invented a new product, launched a killer app, or revolutionized an industry. No, they did it by doing one thing: loading their corporate treasury with Bitcoin. That’s right. A software company turned into a leverage play on digital gold, and the market loved it. It’s not a fluke. It’s a signal. When a company’s stock goes parabolic just for holding hard money, you know the fiat game is losing its grip.
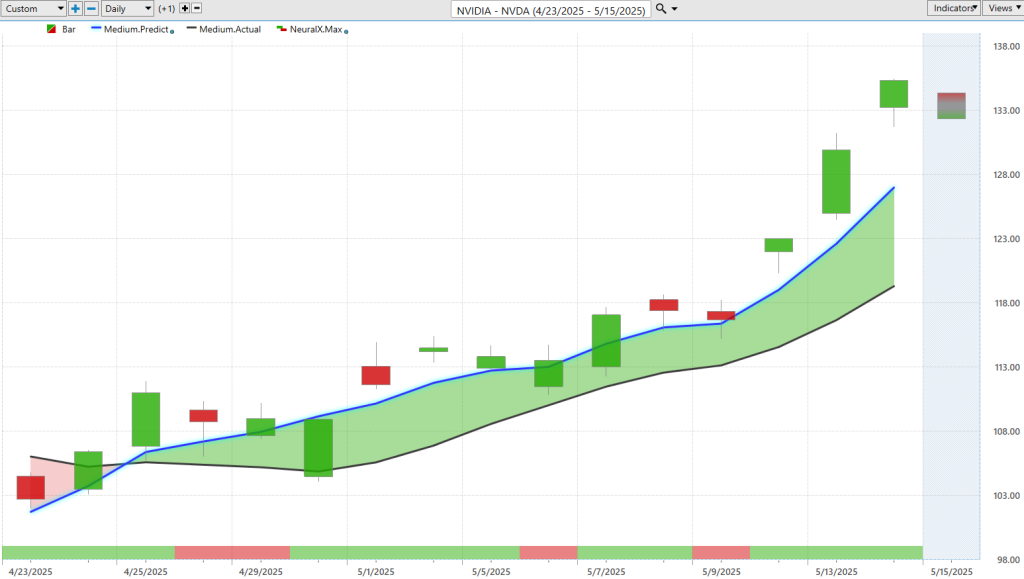
Now throw $NVDA into the mix — up 1,494%, and not because of hype, but because they’re building the infrastructure of the A.I. revolution. They’re the engine under the hood of the biggest tech boom since the internet. A.I. is the new oil, and Nvidia’s got the drill bit. The smart money knows it — and they’re piling in.
Meanwhile, Bitcoin itself is up 1,000% over five years. Think about that. While the Fed prints and politicians spend like it’s Monopoly night, Bitcoin just keeps proving its case. It can’t be debased, diluted, or defrauded. That kind of certainty is in scarce supply, and the market’s starting to scream it from the rooftops.
And then there’s Tesla. Up 522%, turning Elon Musk into a legend — not because he plays it safe, but because he bets big, breaks things, and somehow keeps landing on his feet. Cars, rockets, satellites — he’s turned Tesla into more than a car company. He’s made it a bet on the future.
Put it all together and here’s the truth: when the old rules stop working, the smart money stops following them. It chases vision, scarcity, and conviction. These aren’t just numbers, they’re trail markers in the new financial frontier. Miss them, and you’re stuck in the past. Follow them, and you’re riding shotgun with the winners.
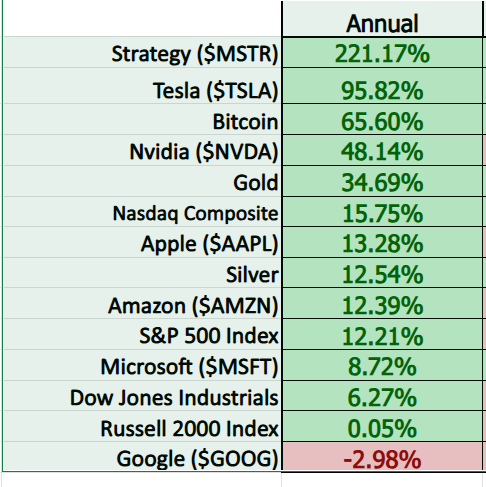
Let me ask you something — what do you think has been the best-performing asset over the past year? Be honest. Was it one of the darlings the media parades around every night on CNBC? Or was it one of those “too volatile,” “too risky,” “too speculative” plays that the talking heads warned you to stay away from?
And why do you think those assets performed the way they did? Was it luck? Timing? Or maybe — just maybe — it was because those assets are telling you something the headlines aren’t. Now here’s the real gut-check: how have you done? When you stack your trades up against the leaders of the pack, are you keeping pace? Or are you still chasing stories instead of results?
Over the last month, we’ve been bombarded with the usual noise: inflation scares, Fed speak, rate hike whispers, geopolitical drama. But when you strip out the spin and focus on the performance, the narrative becomes crystal clear. The same suspects that dominated the last five years — Bitcoin, $NVDA, $MSTR, Tesla — they’re leading the charge again. And let me tell you, the gap isn’t narrow, it’s a canyon. It’s not even close. You’ve got the monsters putting up triple-digit gains… and then you’ve got everybody else fighting over scraps. That’s your first takeaway. And if you’re not paying attention to it, you’re playing the wrong game.
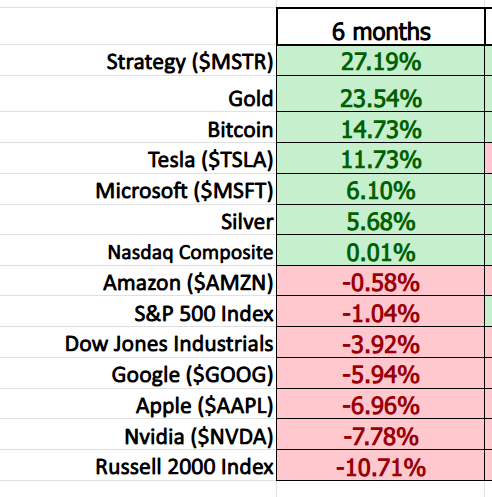
Alright, let’s look back — six months since the presidential election. Be brutally honest with yourself for a second: how’ve you done? Are you ahead of the game, treading water, or watching your portfolio get chewed up while the smart money sails past you?
Now let me ask the next question: what do you think the best performers have been? If you’ve been glued to the headlines, you might’ve guessed wrong. Because when you actually crunch the numbers, the same long-term theme keeps punching us in the face. MicroStrategy leads the pack with a monster 27% gain. That’s right. Not some hot IPO. Not some flavor-of-the-month A.I. token. Just smart, disciplined allocation backed by data and trend. That’s what’s eating everyone’s lunch.
Coming in hot on its heels is Gold, clocking in at 23.5%, and not because gold suddenly got sexy. It’s because central banks around the world are hoarding it like they know something the rest of us don’t. And guess who rounds out the top three? You guessed it — Bitcoin, pulling a very respectable 14.7%, even with all the noise and nonsense swirling around it. Now here’s the part that should really bake your noodle: the chief manipulators of fiat currency — central banks — are now the biggest buyers of gold. Let that sink in. The people who print money are piling into the one asset they can’t print. If that doesn’t tell you everything you need to know about where we are financially, I don’t know what will. It’s a strange, twisted world out there — and if you’re not paying attention to performance over propaganda, you’re gonna keep losing to the same players, over and over again.
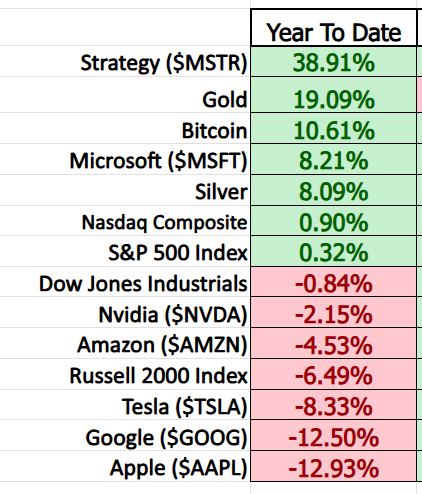
You’ve got some purists out there — you know the type — who define a trend using one lazy yardstick: “Where was the asset on January 1st?” But hey, let’s humor them. Let’s play their game and look at the Year-To-Date scorecard. Guess what? Even with that narrow lens, the same macro theme keeps hitting us like a freight train. The broader stock market averages — the beloved S&P 500, Dow, Nasdaq — they’re just treading water. Lots of sideways chop. Tons of fake-outs. Nothing you can hang your hat on unless you enjoy watching paint dry while your capital gets taxed by inflation.
Meanwhile, the hard assets — the ones the elite used to mock as “barbaric relics” or “fringe speculation” — are once again leading the parade. Gold, Bitcoin, MicroStrategy — all surging ahead, flipping the bird to traditional finance. This isn’t some temporary fluke. It’s a reflection of what’s really going on behind the curtain: fiat rot, political dysfunction, and a growing hunger for real, scarce, unrigged stores of value. So go ahead and mark the trend from January 1st. The result? Still the same: hard assets are on fire, and Wall Street’s darlings are out of breath.
Now look — I love a good scoreboard as much as the next battle-tested trader. But when we start zooming in to shorter time frames, especially the one-month view, I’m not gonna lie: I don’t put too much weight on it. Yeah, I still pull it up. I study it. I chew on it. But I’m not about to let 22 trading sessions — a handful of noisy, headline-driven days — convince me that the market’s reinvented itself.
Why? Because one month is just a blip. It’s a sneeze in market time. You get a hot CPI print, a central bank hiccup, or some tweet from Elon, and suddenly your “top performer” looks like it’s leading the charge — until it isn’t. That’s how traders get whiplash and start chasing ghosts. One good month doesn’t make a trend. And one bad month doesn’t mean the sky is falling.
So, I look at the short-term scorecard. But I treat it like a clue, not a conclusion. It’s a piece of the puzzle — not the whole picture. If you’re making big bets off a 30-day stretch without cross-referencing broader data, longer-term momentum, and relative strength, you’re not trading. The pros don’t fall for that. They connect dots. They confirm signals. They understand that in this game, context is king — and short-term noise without long-term confirmation is just market static.
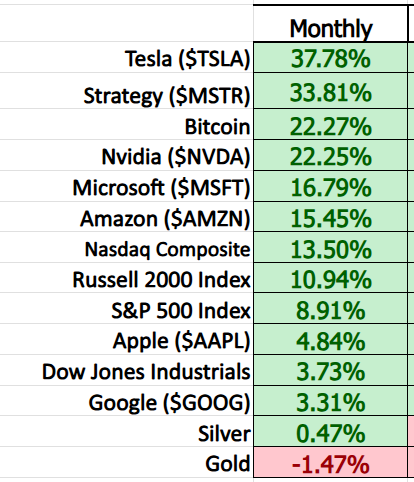
Here’s the part that slaps you in the face like a cold towel in the morning: even on the short-term scoreboard — just one month out — the same assets keep showing up at the top. Like clockwork. Bitcoin. Strategy. Gold. Occasionally you’ll see $NVDA or $TSLA sneak in and remind the market who’s boss, but the leaders? They’re consistent. Relentless. They’ve got the edge — and they’re not letting go.
Now this is where most retail traders blow it. They obsess over market direction — “Is it a bull market? A bear market? A sideways chop?”— as if that’s the secret sauce. It’s not. Let me tell you something the pros know: market selection beats market direction every time. If you pick the right horse — the asset that’s truly outperforming — you can screw up your entry, time it wrong, and still come out smelling like a genius. Why? Because the long-term trend will bail you out. It will carry your mediocre timing across the finish line and make you look like a stock-picking ninja.
But here’s the kicker: when you step back and study the performance of all 14 major assets, across multiple time frames, and you keep seeing MicroStrategy, Bitcoin, Gold, and a couple wild cards like Nvidia or Tesla at the top of the pack — over and over again — what does that tell you? It tells you the game isn’t random. It’s not about luck or headlines or analyst ratings. It’s about paying attention to who’s consistently delivering. You don’t have to chase them. You don’t have to pile in. But you do need to ask the most important question in all of trading: “Will this trend continue?” Because if it does, and you’re not riding it… you’re just watching someone else cash your ticket.
Here’s the smartest move you can make if you’re dead serious about building real wealth in this market jungle: apply VantagePoint’s artificial intelligence to the top-performing assets. Not the dogs. Not the dead weight. Not the “undervalued gems” that have been “about to turn around” for the last six years. I’m talking about putting A.I. to work where the action is — on the assets that are already leading the pack.
Because here’s the brutal truth most traders don’t want to hear: you don’t need to catch the bottom. You don’t need to nail the top. You just need to stay on the right side of the right trend at the right time. That’s it. That’s the whole game. And guess what? That’s exactly what VantagePoint’s artificial intelligence is built for. It doesn’t get emotional. It doesn’t panic over headlines. It just reads the data, spots the patterns, and points you toward the highest-probability moves.
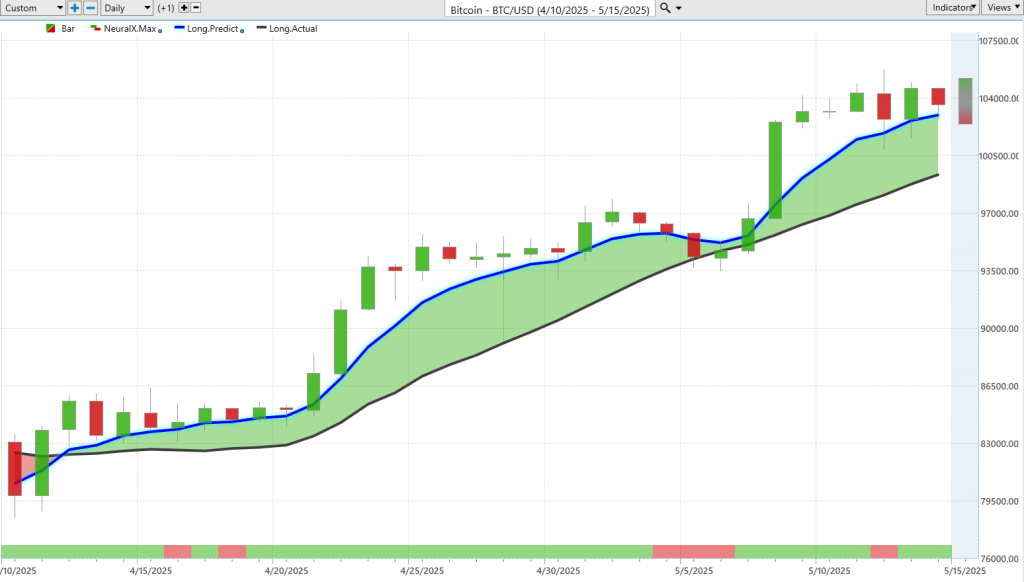
Now let’s take a look at some real proof — Bitcoin, $MSTR, and $NVDA. These aren’t hypotheticals. These are the poster children for outperformance. Their charts don’t lie.
Bitcoin’s been exploding because the world’s finally waking up to the power of money that can’t be printed into oblivion.
$MSTR turned into a beast just by stacking sats on its balance sheet.
And $NVDA? That’s the engine room of the A.I. boom — up over 1,400% because it’s literally powering the future.
Watch these charts and tell me there’s not a common thread. A.I. tracks the momentum, keeps you in when it matters, and gets you out before the rug gets pulled. That’s not theory. That’s execution.
Here is the entire performance grid for your own analysis and enjoyment:
So ask yourself: are you using the most powerful tools on the most powerful trends… or are you still trying to outsmart the market with gut feelings and CNBC soundbites?
Let me share a secret that separates the great traders from the good guessers.
There comes a moment in every successful trader’s journey — a single, crystal-clear turning point — when they stop chasing the market and start commanding it. That moment isn’t fueled by luck. It doesn’t come from a hot tip or a flashy new indicator. It comes from discovering a better way. A scientific way. A way to cut through the noise, the fear, the confusion… and finally see what’s coming before it arrives.
For thousands of traders, that moment began with a bold but simple decision:
They chose to trade with VantagePoint’s artificial intelligence.
Now, you may be skeptical—and that’s healthy. In fact, it tells me you’re smart. But let me ask you something…
What if you had access to a tool that never gets tired, never second-guesses, never lets emotions cloud its judgment?
A tool that scans hundreds of global indicators, analyzes millions of data points, and gives you a crystal-clear view of where the market is most likely headed next?
That’s not fantasy. That’s A.I. in trading — and it’s happening right now.
We’re inviting you to witness this for yourself in a FREE live online masterclass. No fluff. No filler. Just a real, behind-the-curtain look at how professional traders are using machine learning to make smarter, faster, and more confident decisions. You’ll see how this technology is giving ordinary people an extraordinary edge — live, in real time, with real market data.
This isn’t theory. This isn’t guesswork. This is results.
Now, you don’t need to be a tech whiz or a Wall Street pro to grasp this simple truth:
Machines are outperforming humans — in chess, in poker, in strategy, and yes… in the markets.
And they’re not just playing the game.
They’re rewriting the rulebook.
So let me ask you: If A.I. can beat world champions in games of precision and timing… what do you think it can do against a sea of retail traders flying blind, chasing headlines, and making emotional decisions?
Trading is a game of probability, timing, and pattern recognition. That’s what VantagePoint’s A.I. was built for.
The smartest traders I know aren’t relying on gut feelings anymore. They’re relying on machines, machines that see patterns the human eye misses, that signal reversals before the herd even sniffs a change, that keep you on the right side of the right trend at the right time.
I’m not asking for your trust. I’m offering you proof.
Come see it for yourself. Watch the VantagePoint A.I. dissect the markets with chilling accuracy.
Walk away with a new level of clarity. A new level of confidence. A trading edge you can use immediately.
This is your invitation.
You can keep trading the old way – guessing, chasing, hoping.
Or you can step into a smarter, sharper, more strategic future.
It’s not magic.
It’s machine learning.
And it’s the smartest trading decision you’ll ever make.
THERE IS A SUBSTANTIAL RISK OF LOSS ASSOCIATED WITH TRADING. ONLY RISK CAPITAL SHOULD BE USED TO TRADE. TRADING STOCKS, FUTURES, OPTIONS, FOREX, AND ETFs IS NOT SUITABLE FOR EVERYONE.IMPORTANT NOTICE!
DISCLAIMER: STOCKS, FUTURES, OPTIONS, ETFs AND CURRENCY TRADING ALL HAVE LARGE POTENTIAL REWARDS, BUT THEY ALSO HAVE LARGE POTENTIAL RISK. YOU MUST BE AWARE OF THE RISKS AND BE WILLING TO ACCEPT THEM IN ORDER TO INVEST IN THESE MARKETS. DON’T TRADE WITH MONEY YOU CAN’T AFFORD TO LOSE. THIS ARTICLE AND WEBSITE IS NEITHER A SOLICITATION NOR AN OFFER TO BUY/SELL FUTURES, OPTIONS, STOCKS, OR CURRENCIES. NO REPRESENTATION IS BEING MADE THAT ANY ACCOUNT WILL OR IS LIKELY TO ACHIEVE PROFITS OR LOSSES SIMILAR TO THOSE DISCUSSED ON THIS ARTICLE OR WEBSITE. THE PAST PERFORMANCE OF ANY TRADING SYSTEM OR METHODOLOGY IS NOT NECESSARILY INDICATIVE OF FUTURE RESULTS. CFTC RULE 4.41 – HYPOTHETICAL OR SIMULATED PERFORMANCE RESULTS HAVE CERTAIN LIMITATIONS. UNLIKE AN ACTUAL PERFORMANCE RECORD, SIMULATED RESULTS DO NOT REPRESENT ACTUAL TRADING. ALSO, SINCE THE TRADES HAVE NOT BEEN EXECUTED, THE RESULTS MAY HAVE UNDER-OR-OVER COMPENSATED FOR THE IMPACT, IF ANY, OF CERTAIN MARKET FACTORS, SUCH AS LACK OF LIQUIDITY. SIMULATED TRADING PROGRAMS IN GENERAL ARE ALSO SUBJECT TO THE FACT THAT THEY ARE DESIGNED WITH THE BENEFIT OF HINDSIGHT. NO REPRESENTATION IS BEING MADE THAT ANY ACCOUNT WILL OR IS LIKELY TO ACHIEVE PROFIT OR LOSSES SIMILAR TO THOSE SHOWN.


