




Hot Stock Snapshot: AMGEN ($AMGN)
Company Profile
Amgen began in 1980 as Applied Molecular Genetics, helped turn biotechnology into an industry, broke through with EPOGEN in 1989, expanded dramatically through products and acquisitions including Horizon Therapeutics, and today serves roughly 17 million patients worldwide. Its mission remains remarkably uncomplicated: use biology to treat serious disease. It is headquartered in Thousand Oaks, California, led by CEO Robert Bradway, and employs roughly 31,500 people. In other words, this is no laboratory experiment hoping somebody eventually buys something. It is one of biotechnology’s industrial battleships.
Amgen makes money selling medicines across general medicine, oncology, inflammation and rare disease. Major franchises include Prolia, Repatha, ENBREL, Otezla, EVENITY, TEPEZZA, BLINCYTO and TEZSPIRE. Repatha is becoming particularly important, with 2025 sales of $3.016 billion, while aging products such as ENBREL are shrinking. Competitors range from AbbVie and Regeneron to Eli Lilly and Novo Nordisk, particularly if Amgen becomes a serious obesity contender.
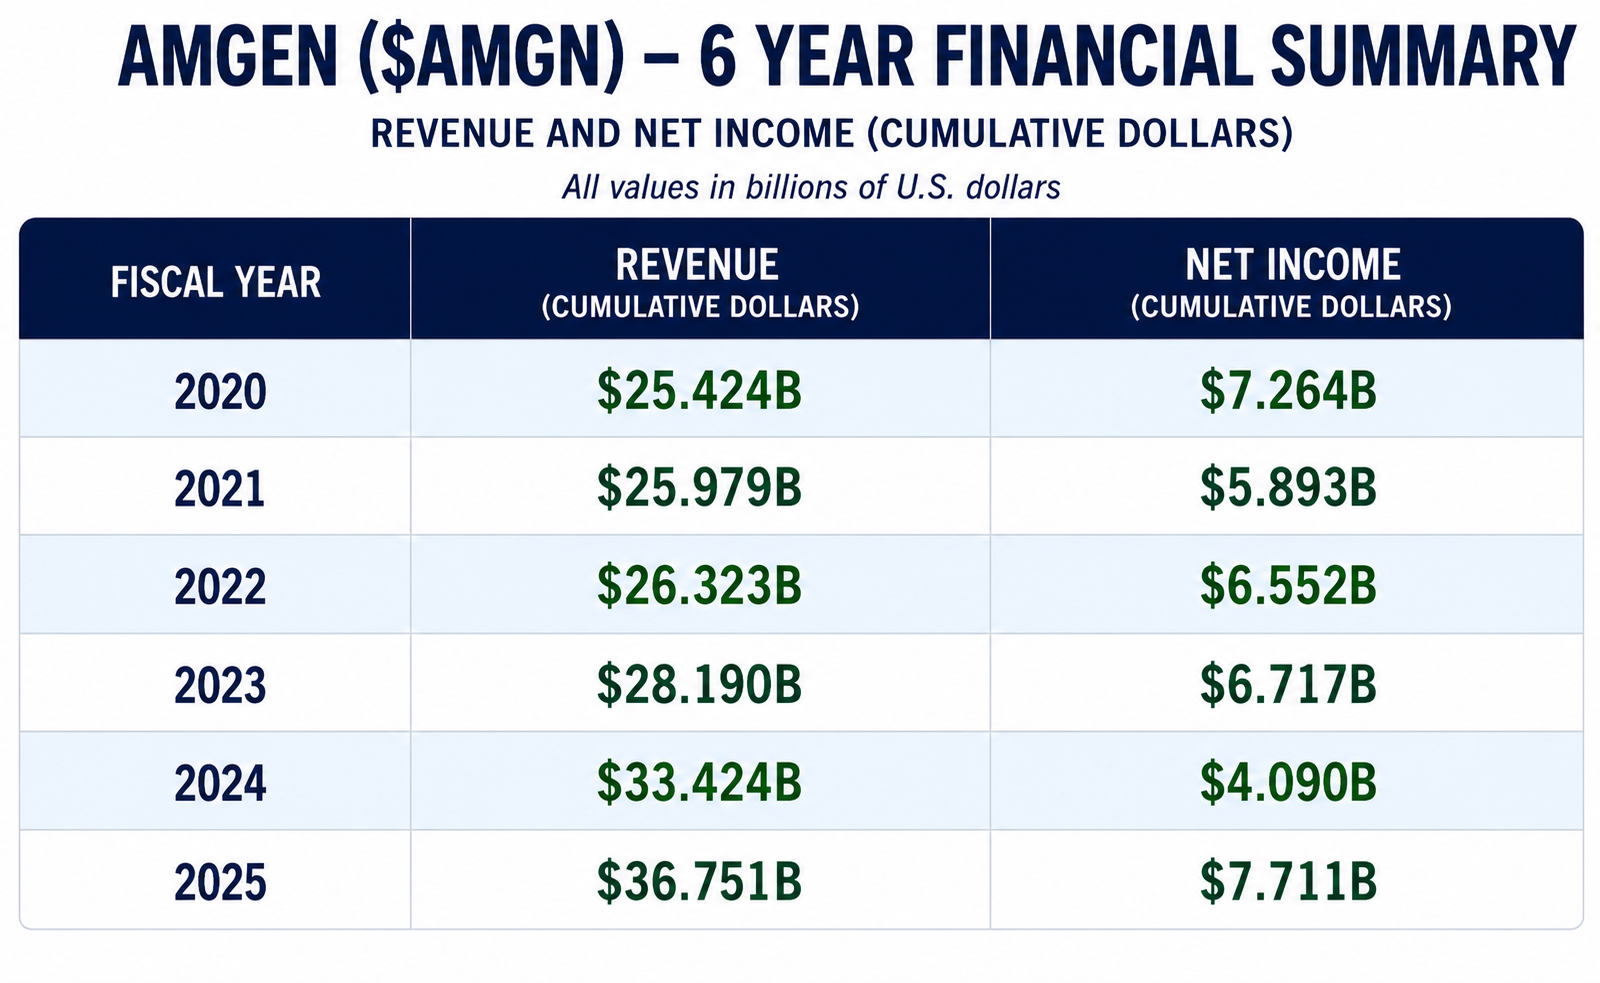
Here’s what jumps off this chart: Amgen has become a much bigger business. Revenue climbed from $25.424 billion in 2020 to $36.751 billion in 2025, an increase of roughly 45%. And notice where the acceleration occurs. Revenue barely moved from 2020 through 2022, then jumped to $28.190 billion in 2023, $33.424 billion in 2024, and $36.751 billion in 2025. That’s the kind of progression traders should pay attention to. The company isn’t merely defending an old franchise. The revenue machine has shifted into a higher gear.
But don’t make the rookie mistake of looking at that rising revenue line and assuming profits followed obediently behind. They didn’t. Net income fell from $7.264 billion in 2020 to just $4.090 billion in 2024, even while revenue was exploding higher. Then came 2025, when net income rebounded sharply to $7.711 billion, the highest figure on this six-year table. That’s the number that deserves your attention. Revenue growth is good. Revenue growth accompanied by recovering profitability is considerably better. When the business starts making more money and the market starts rewarding it at the same time, that’s when traders should sit up and pay attention.
The two questions traders should be asking are simple. Can Amgen’s newer growth engines outrun patent erosion in older blockbusters? And can MariTide become a genuine obesity franchise rather than an extremely expensive science project? Those questions increasingly determine how much investors are willing to pay for tomorrow.
The newest evidence favors the bulls. Second-quarter sales increased 9% to $10.1 billion, adjusted EPS beat expectations, and management raised 2026 guidance to $38.2 billion to $39.4 billion of revenue and $22.30 to $23.50 adjusted EPS. Repatha sales jumped 37%, EVENITY 38%, while Prolia fell 32%. That is exactly the transition Wall Street needs to see.
Healthcare itself has strengthened, but AMGN has been doing considerably more than merely riding the sector. The rally reflects earnings, rising guidance, newer-product growth, pipeline expectations and increasingly powerful relative strength. Recent market data also showed AMGN outperforming peers while trading near record territory.
The upside surprise is MariTide. Successful Phase III results could give investors an entirely new growth franchise to value. The blind spot is expectations. At these prices, investors are no longer paying bargain-bin biotech prices. They are paying for execution. Patent erosion, disappointing MariTide data, regulatory trouble or slowing newer-product growth could change the arithmetic quickly.
AMGN therefore suits the trend trader who prefers strength rather than fishing around Wall Street’s bargain basement. The trend remains credible while revenue grows, newer products replace declining franchises, guidance holds and price remains technically strong. The early warning would be deterioration in those growth products combined with weakening relative strength. The business is growing, earnings have recovered, and the stock is behaving like the market believes the story. For now, the burden of proof belongs to the bears.
For traders, the fundamental takeaway is straightforward. The business is considerably larger than it was six years ago, revenue growth accelerated during the last several years, and 2025 earnings recovered sharply. That gives the price trend a fundamental foundation rather than leaving us with nothing but enthusiasm and a candlestick chart.
52-Week Range
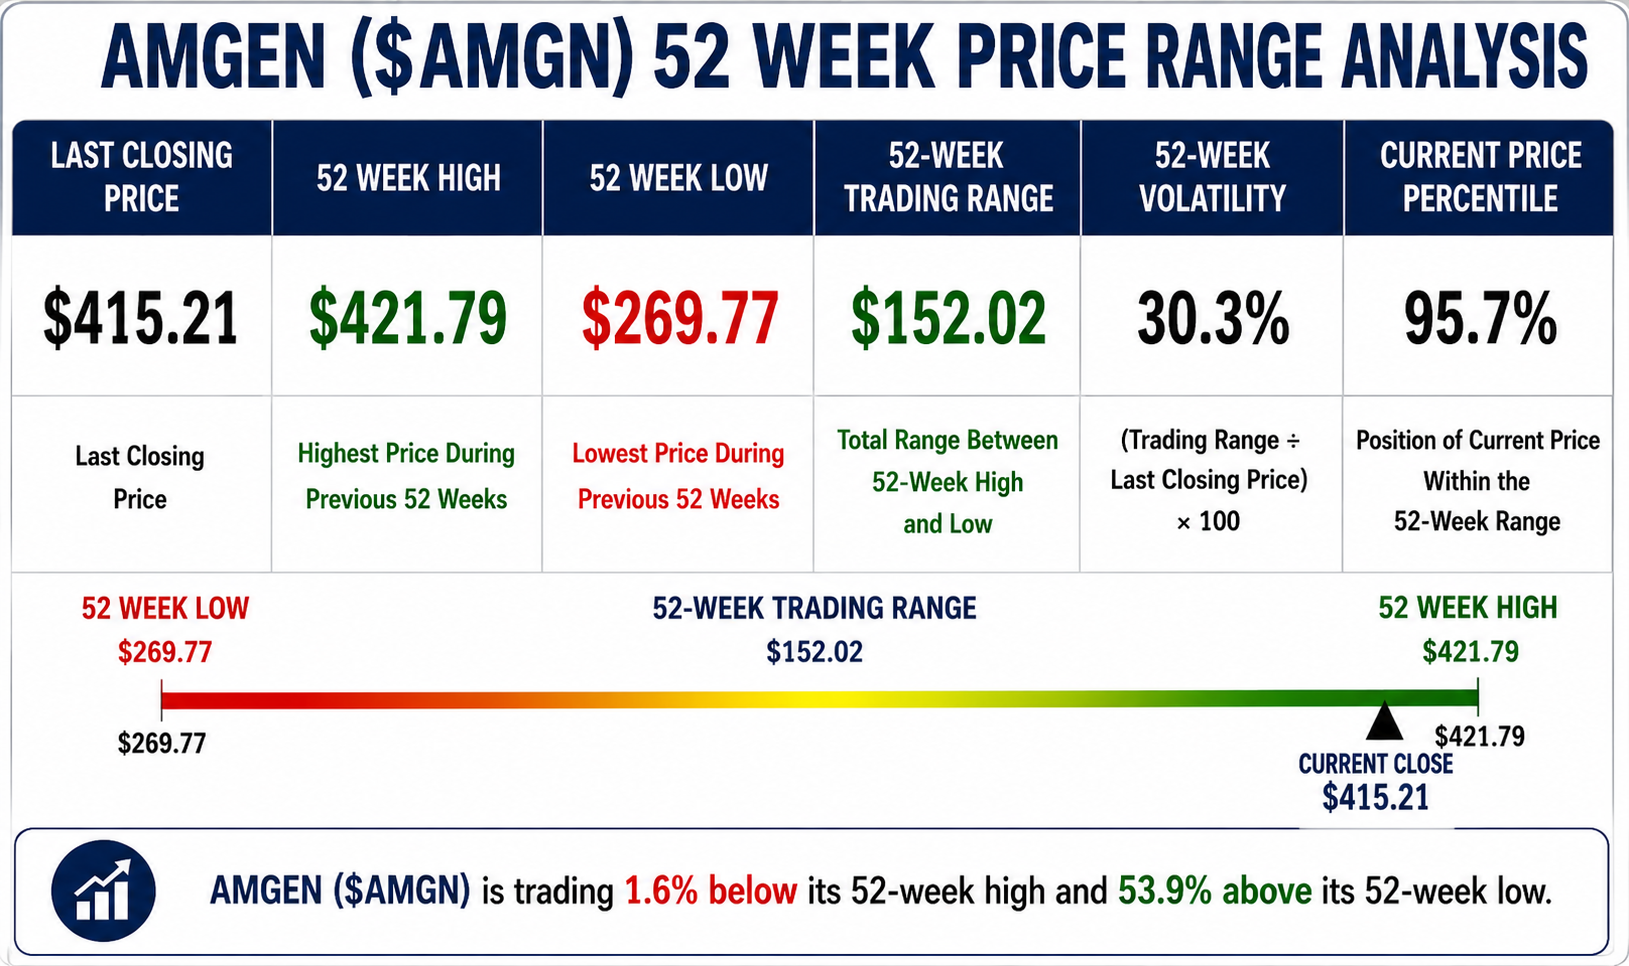
The 52-week boundaries shown on the chart are $269.77 on the bottom and $421.79 on the top.
That is a $152.02 annual range. More important, AMGN is currently sitting just beneath that upper boundary.
This is precisely where a 52-week chart becomes useful. A stock near its annual low is being rejected by the market. A stock near its annual high is being accumulated aggressively enough that buyers have pushed it almost as far as anyone has been willing to pay during the previous year.
AMGN is firmly in the second camp.
The $421.79 level is now the number that matters. A decisive breakout above it would place AMGN into fresh 52-week-high territory. Failure to break through it could produce consolidation or a pullback after the stock’s substantial summer advance.
52-Week Chart
The one-year chart is almost a textbook demonstration of why strong stocks deserve attention.
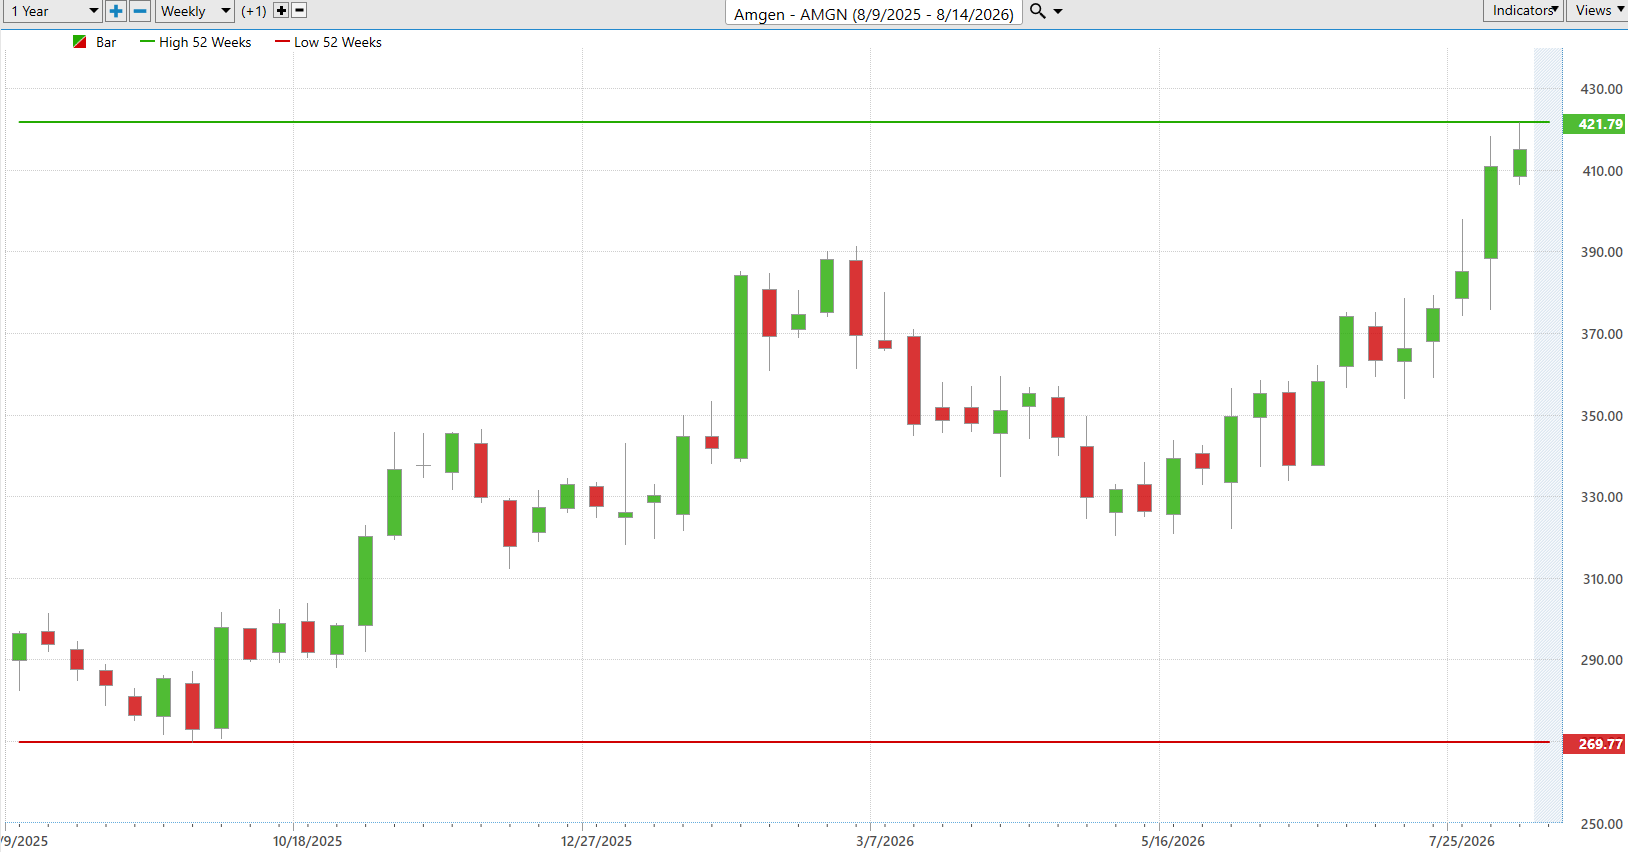
AMGN traded down toward $270 during the fall of 2025. It subsequently rallied toward $350, corrected, surged toward $390, suffered another substantial decline into the $320s, and then began its latest advance.
What matters isn’t that AMGN declined. Stocks decline. Apparently Wall Street has not yet repealed gravity.
What matters is what happened afterward.
Every major selloff was eventually followed by another advance. The latest rally has carried AMGN from approximately the low-$320 area during the spring to above $410 by August.
The stock is now challenging the highest price of the entire 52-week period. That is the market’s way of telling us that despite all the corrections, arguments, headlines and opportunities to sell, buyers ultimately won.
Best-Case Analysis
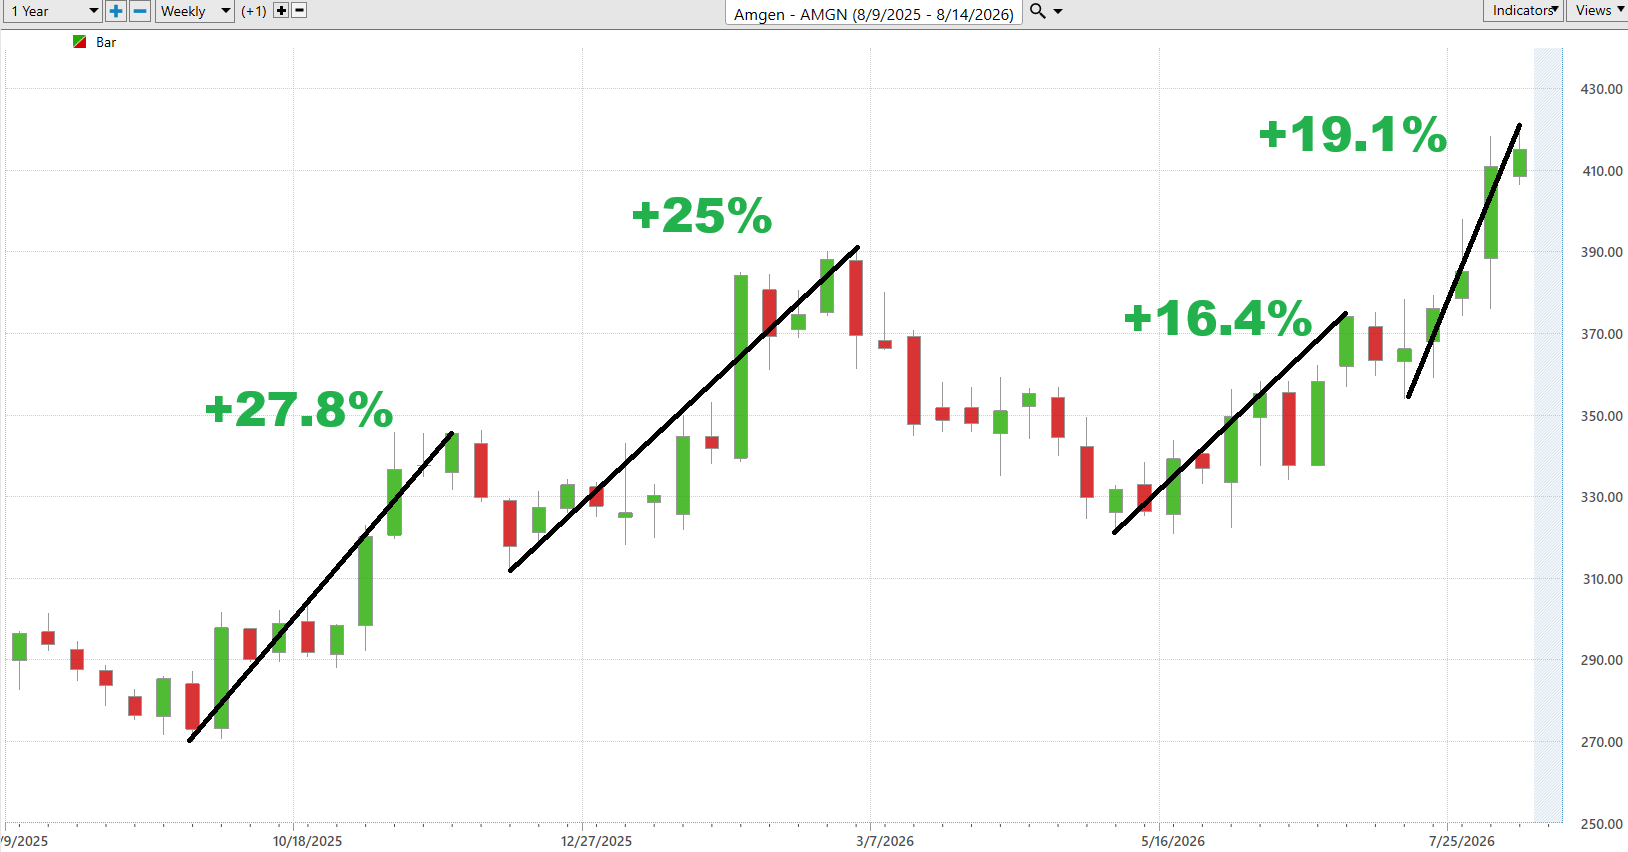
The best-case chart shows four significant rallies of approximately:
+27.8%, +25.0%, +16.4%, and +19.1%.
Those aren’t theoretical projections. They are the major rallies identified on the supplied one-year chart.
Notice the pattern. AMGN doesn’t merely crawl higher. When buyers gain control, the stock has demonstrated the ability to produce substantial directional moves.
The most recent advance is particularly interesting. AMGN rallied roughly 19.1% from its latest significant low and carried price directly toward the 52-week high.
For traders, this establishes the opportunity side of the equation. AMGN has demonstrated repeatedly that once an advance develops, meaningful upside can follow.
It does not mean another 19%, 25%, or 28% rally is coming. Historical rallies tell us what the stock has been capable of doing, not what it owes us next.
Worst-Case Analysis
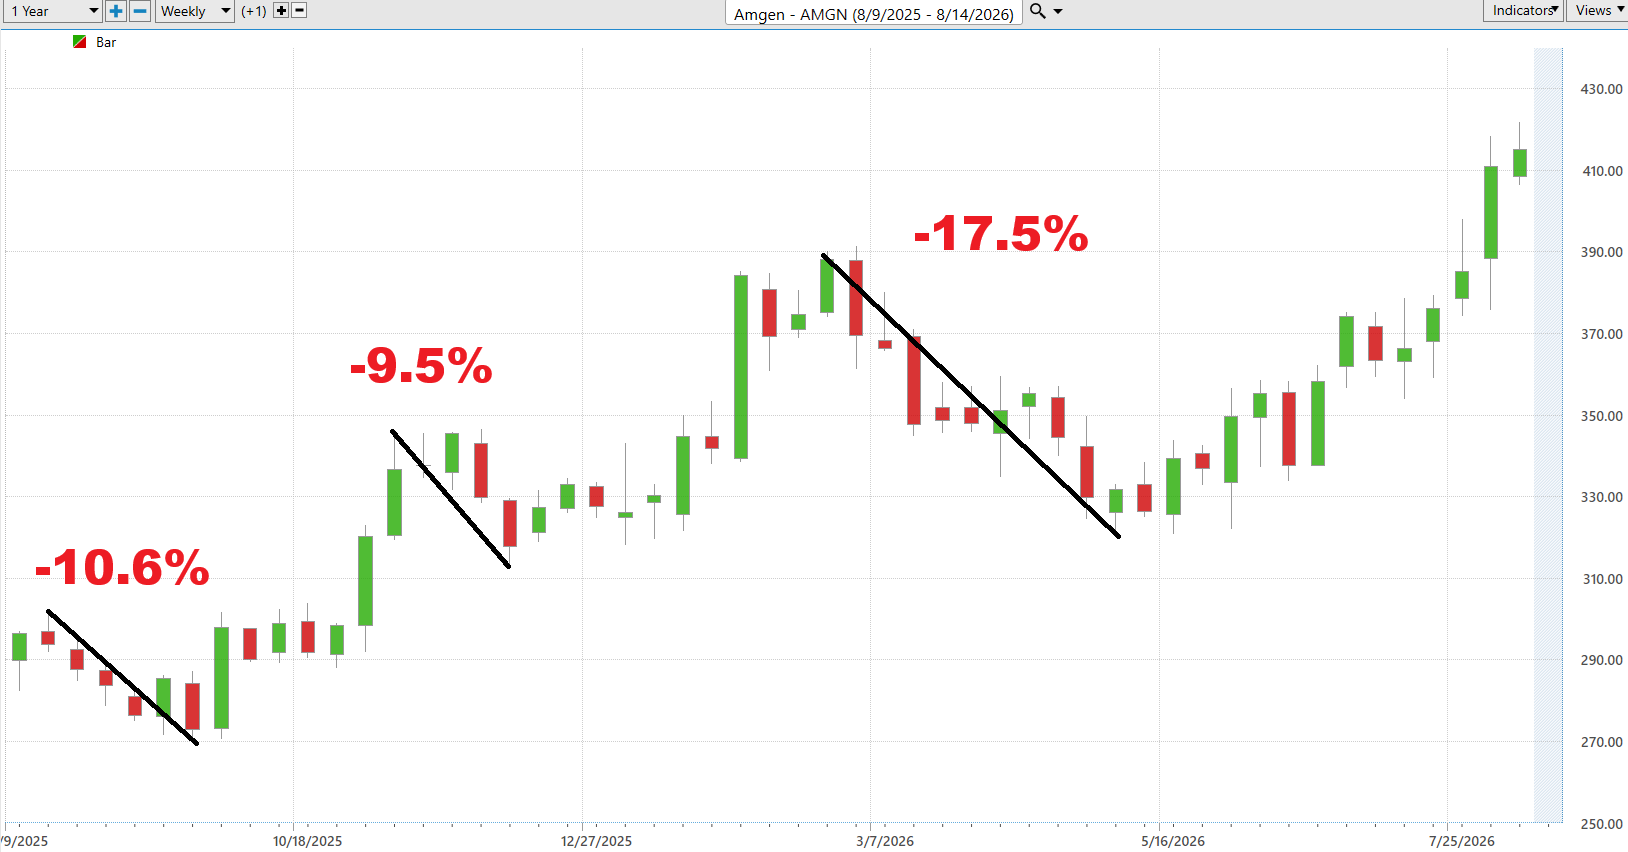
Now for the part Wall Street brochures generally print in a font requiring laboratory equipment.
AMGN’s major declines on the supplied chart were approximately:
-10.6%, -9.5%, and -17.5%.
The largest correction was especially instructive. AMGN fell from roughly $390 into the low $320s before eventually recovering and making another assault on its highs.
Think about what that means.
You could have been completely correct about the larger bullish story and still endured a 17.5% decline along the way.
That is why risk management isn’t pessimism. It is arithmetic.
The stock’s historical behavior suggests that even within a powerful longer-term advance, corrections approaching 10% and occasionally considerably more are entirely possible. Position sizing and predetermined exits therefore matter just as much as identifying the trend.
Comparison Metrics
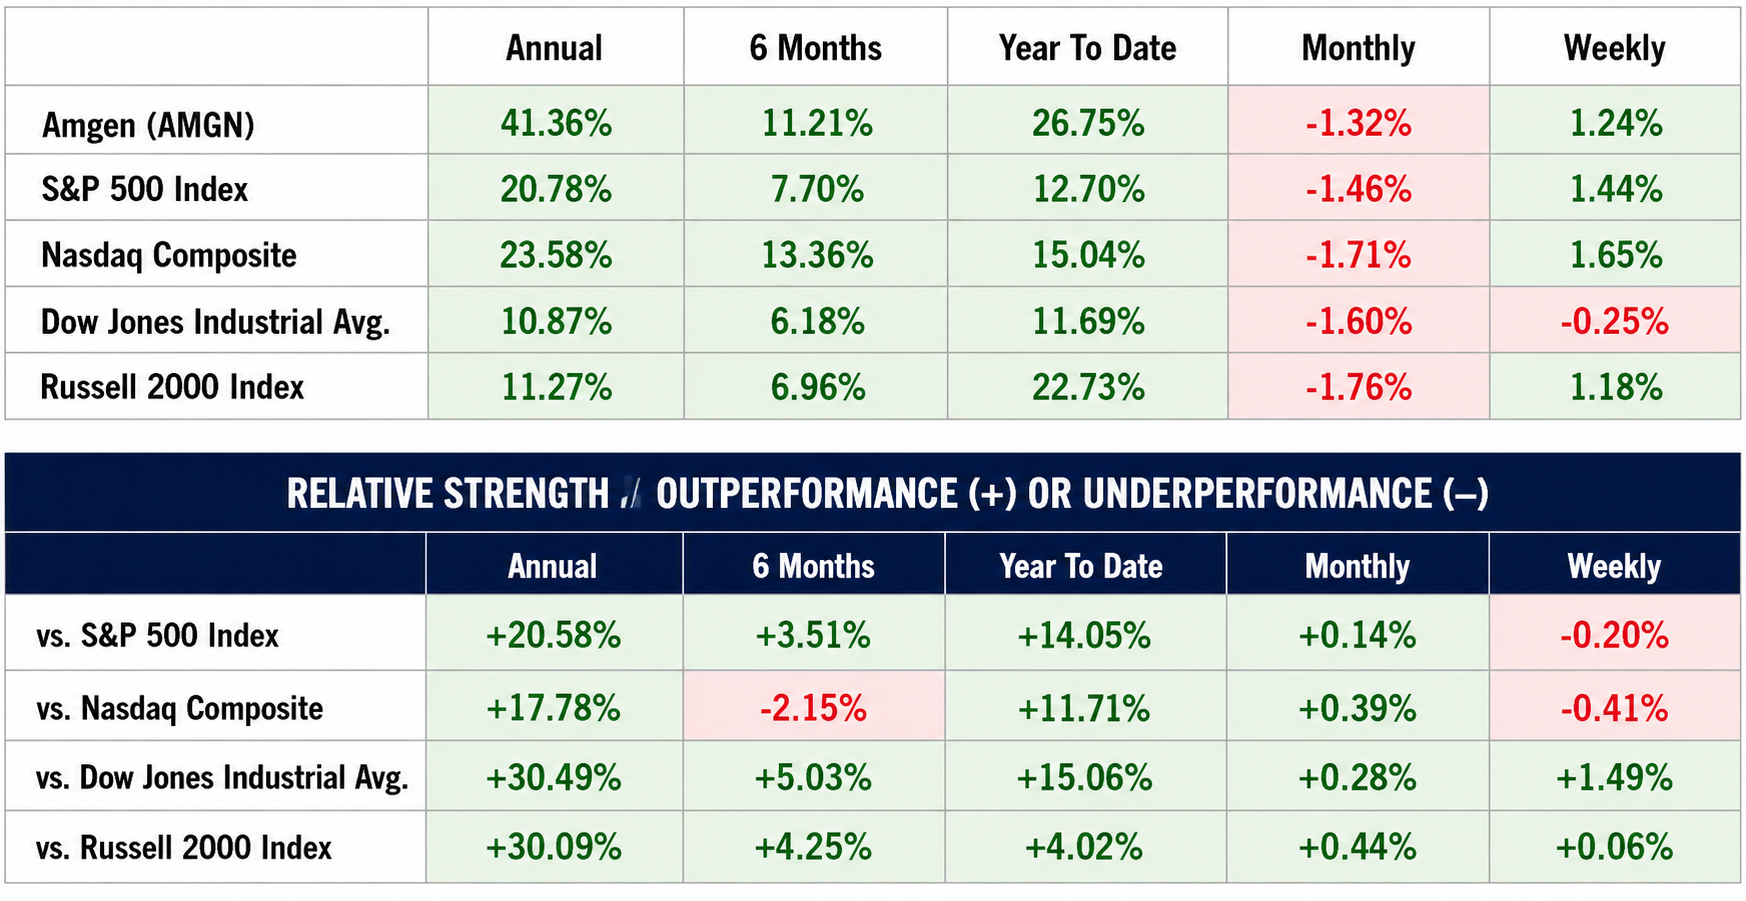
This is where AMGN stops merely looking good and starts becoming interesting.
Over the annual period shown, AMGN gained 41.36%. The S&P 500 gained 20.78%, the Nasdaq Composite 23.58%, the Dow 10.87%, and the Russell 2000 11.27%.
That means AMGN outperformed the S&P 500 by 20.58 percentage points and the Nasdaq by 17.78 points. Against the Dow and Russell 2000, the annual advantage was roughly 30 percentage points.
Year to date tells essentially the same story. AMGN gained 26.75%, outperforming the S&P 500 by 14.05 percentage points, the Nasdaq by 11.71, the Dow by 15.06, and the Russell 2000 by 4.02.
That is genuine market leadership.
But the shorter-term picture contains an important wrinkle. Over six months, AMGN’s 11.21% gain beat the S&P, Dow and Russell but trailed the Nasdaq by 2.15 percentage points. Weekly, AMGN slightly trails both the S&P 500 and Nasdaq.
So the message is unusually clear:
Long-term relative strength is excellent. Short-term relative strength has cooled.
That doesn’t destroy the bullish thesis. It tells us the stock may be digesting its recent advance while sitting immediately beneath a major 52-week boundary.
VantagePoint AI Triple Cross Indicator
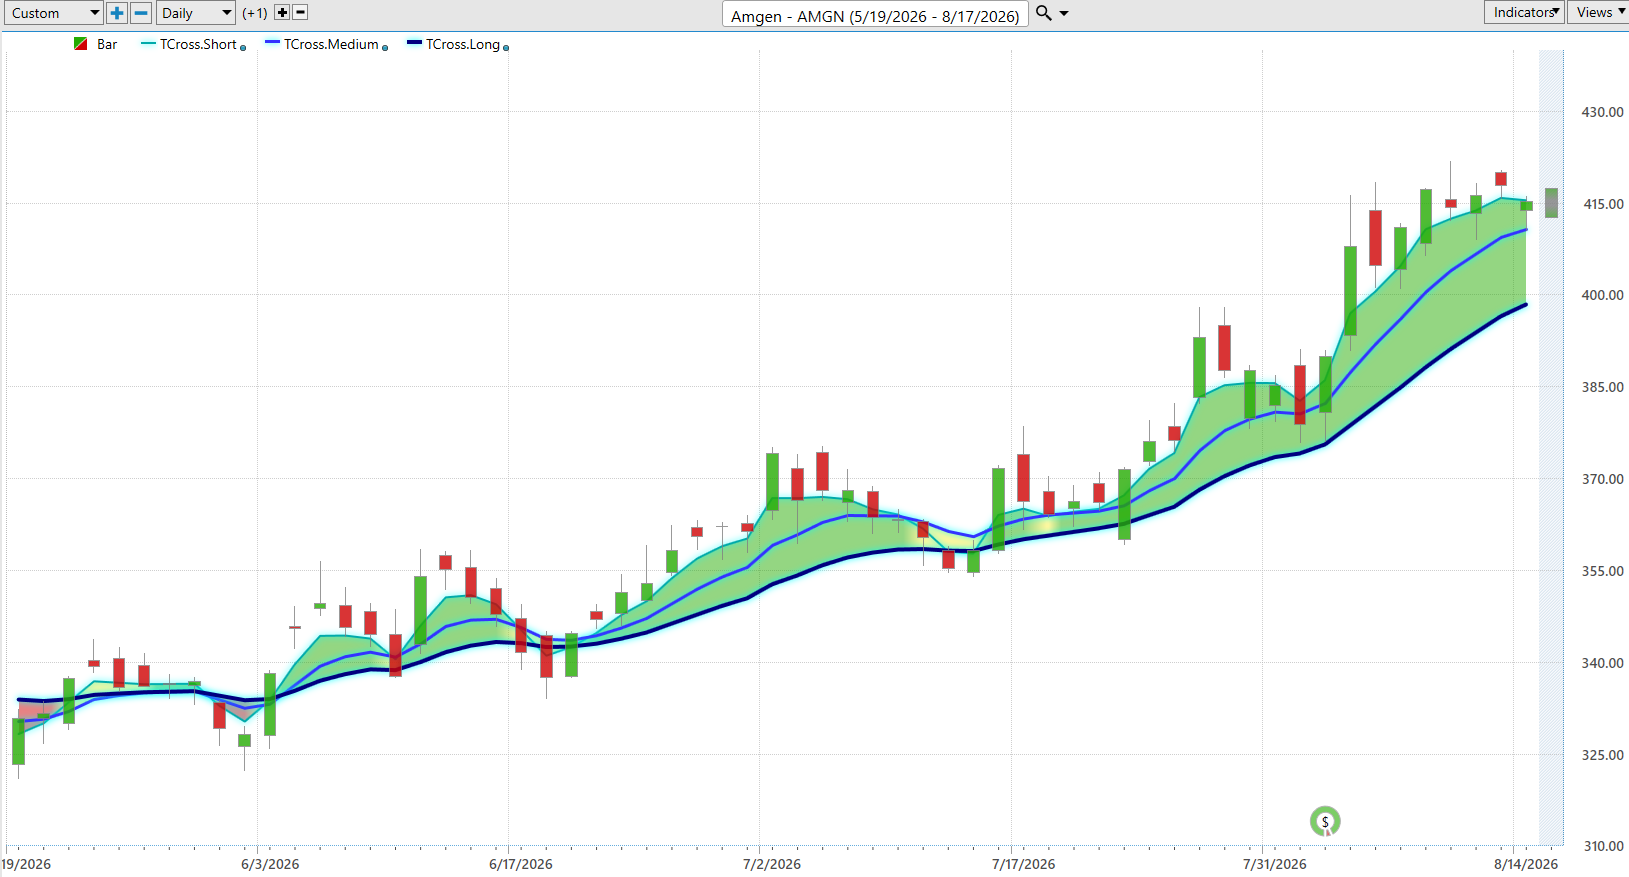
The VantagePoint AI Triple Cross Indicator gives traders something enormously valuable: perspective. Instead of relying on one moving average to tell the whole story, it compares three predictive moving averages representing the short, intermediate, and longer-term trends. Think of it as asking three witnesses the same question. When all three give you the same answer, the evidence becomes considerably more persuasive.
When the short-term predictive average is above the medium-term average, and both are above the T-Cross Long, the market is displaying bullish alignment. When those lines are also rising and separating, the message becomes stronger. Buyers are not merely winning today’s argument. Momentum is being confirmed across multiple time horizons. When the lines flatten, converge, or begin crossing one another, the message changes. The trend may be losing strength, and traders should start paying closer attention.
The great advantage is that these are **predictive**, rather than ordinary historical moving averages. VantagePoint uses artificial intelligence and intermarket analysis to anticipate future price behavior. The Triple Cross is therefore designed to help traders recognize a developing trend, confirm its strength, and spot deterioration before it becomes painfully obvious on the price chart. One line can whisper. Three lines moving together can make a considerably stronger argument.
The Triple Cross chart is decisively bullish.
The short-term T-Cross is above the medium-term T-Cross, and the medium-term T-Cross remains above the long-term T-Cross. More importantly, all three remain pointed higher.
Look at the separation between them during the latest advance. The short-term predictive average accelerated sharply higher as AMGN moved through the $390s and above $400. The medium-term average followed. The long-term T-Cross continues climbing underneath price.
That is exactly the alignment traders want to see in an established uptrend.
The latest price action has begun moving sideways near $415 while the shorter predictive averages flatten somewhat. That is the first thing I would watch.
At present, the Triple Cross is not signaling a bearish trend reversal. It is telling us the larger trend remains bullish while short-term momentum has stopped accelerating.
That distinction matters enormously.
A bullish trend doesn’t require the stock to rise every day. It requires the predictive structure to remain intact.
Right now, it is.
VantagePoint AI Neural Index
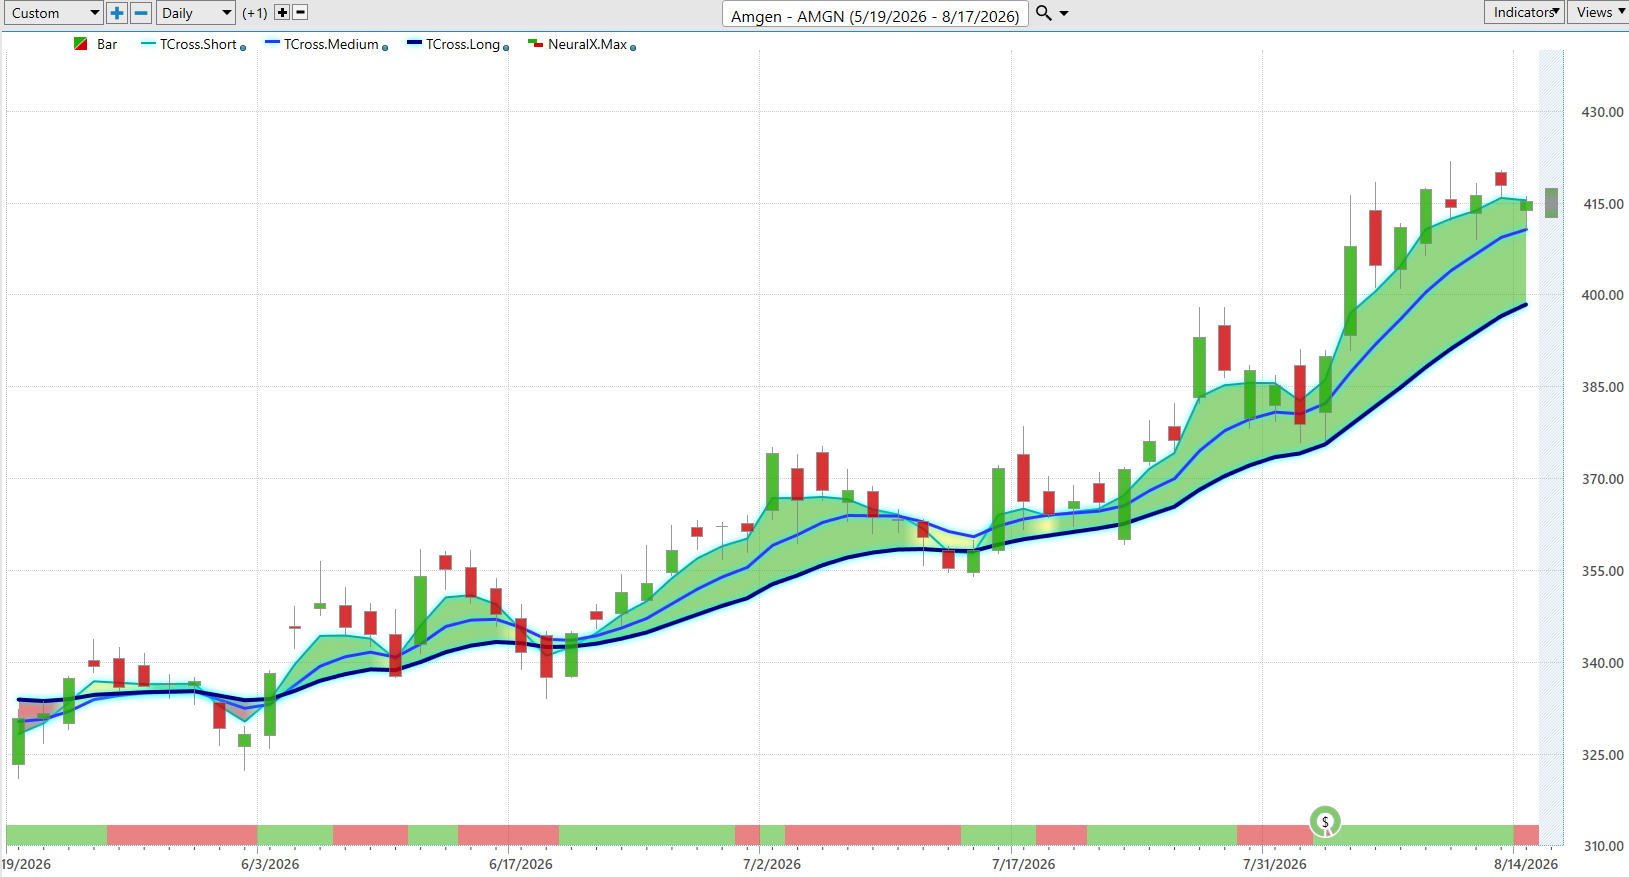
The Neural Index gives us the shorter-term warning light. It is at the base of the chart.
Throughout the advance, the Neural Index repeatedly shifted between positive and negative readings. Those short red stretches represented temporary forecasts of near-term weakness. Most were subsequently overwhelmed by the larger bullish trend.
But look at the far-right side of the current chart.
The most recent Neural Index reading has turned negative.
That means the short-term forecast has weakened even though the larger predictive trend remains bullish.
This creates an important divergence.
The Triple Cross says: the primary trend remains up.
The Neural Index says: don’t assume tomorrow has to cooperate.
That is valuable information when AMGN is sitting just beneath its $421.79 52-week high.
Instead of interpreting the negative Neural Index as an automatic sell signal, I would interpret it as a warning against chasing the stock aggressively at this exact moment. If the Neural Index turns positive again while the Triple Cross remains bullish, we regain double confirmation.
That would be considerably more attractive.
VantagePoint AI Daily Range Forecast
The Daily Range Forecast adds another layer.
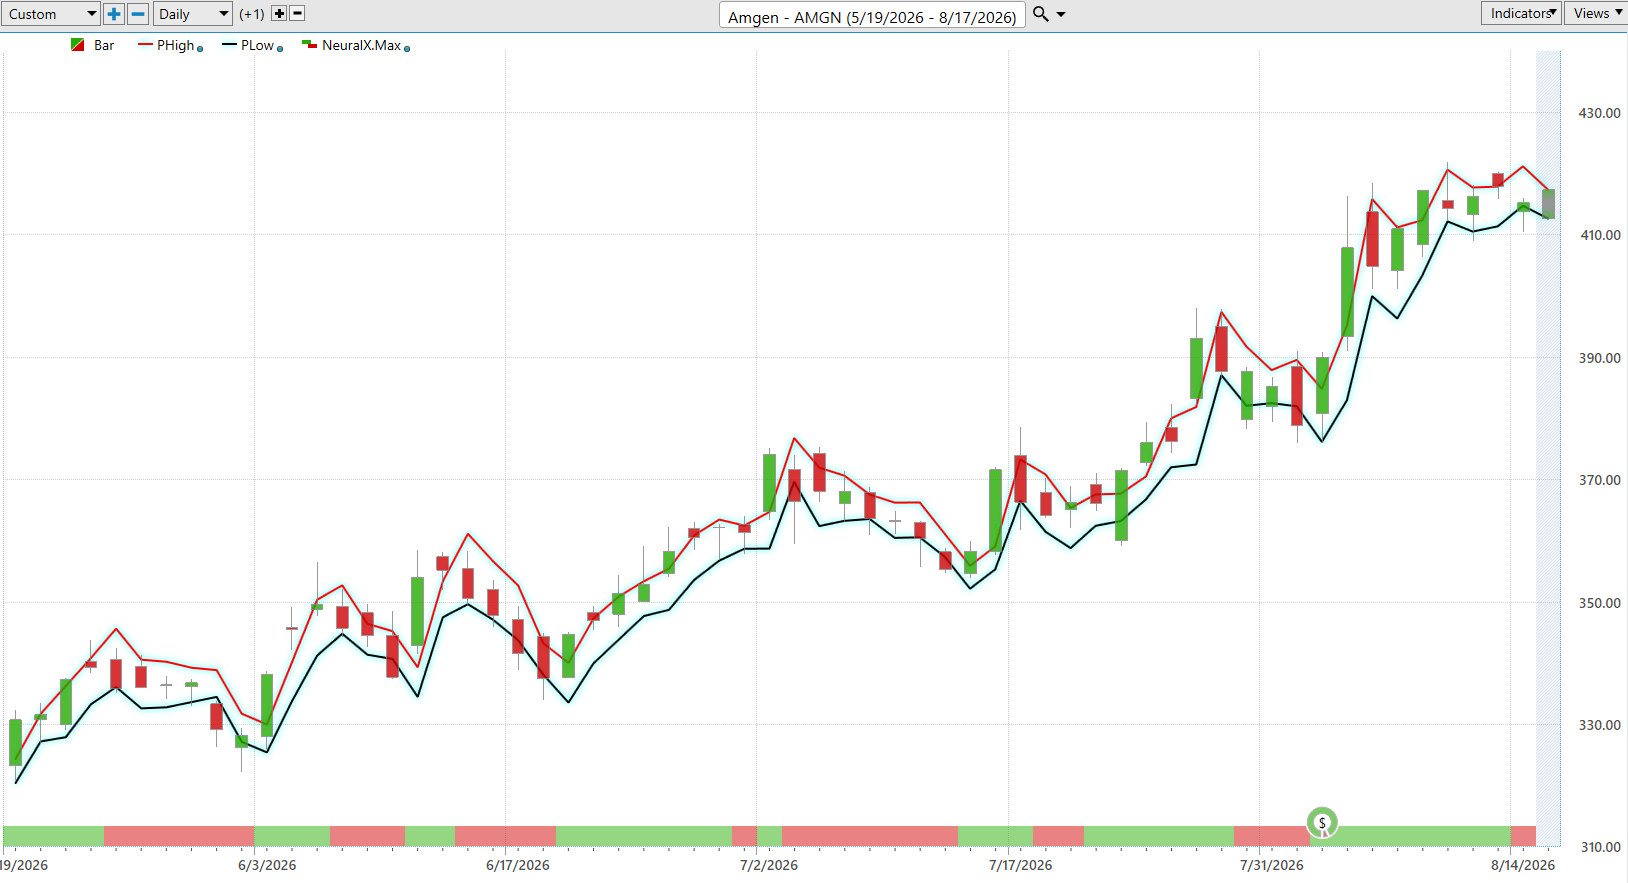
Look at the red predicted-high line and the dark predicted-low line. Both have moved dramatically higher during the latest advance.
That tells us the entire expected daily trading envelope has been repriced upward.
In late July, the predicted range was centered considerably lower. By mid-August, both predicted boundaries had climbed into the low-$400s and teens. That is exactly what you expect when the underlying trend is strong.
But something else is happening at the far right of the chart.
The predicted high has stopped accelerating and has begun curling lower, while the predicted low has moved closer to price.
That fits perfectly with what the Neural Index is telling us. The larger trend remains bullish, but immediate momentum is cooling.
This is precisely why traders shouldn’t chase strength simply because a stock looks terrific.
The Daily Range Forecast gives us prospective boundaries where buyers and sellers may become more active. When the larger trend remains bullish, the lower predicted boundary can help identify a more attractive potential entry zone, while the predicted high helps identify where chasing becomes increasingly expensive.
The stock is strong.
That doesn’t mean every price is a good price.
Our Suggestion
$AMGN has several things going for it simultaneously.
Revenue has increased dramatically over six years. Earnings recovered strongly in 2025. The stock has produced substantial historical rallies. It has dramatically outperformed most major indexes over the annual and year-to-date periods. The Triple Cross remains bullish. And price is sitting just beneath the $421.79 52-week high.
That’s a lot of evidence pointing in the same direction.
But the short-term indicators are whispering something different.
The latest Neural Index has turned negative. Short-term relative strength has cooled. The predicted daily high has stopped accelerating. And price is sitting immediately beneath the most obvious resistance level on the entire chart.
So our suggestion is bullish, but patient.
We would rather see one of two things.
First, AMGN breaks decisively through $421.79, establishes a new 52-week high, and receives renewed confirmation from the Neural Index while the Triple Cross remains bullish.
Or second, the stock pulls back toward its predictive value zone while the longer-term T-Cross structure remains intact. That could provide a more attractive risk-to-reward opportunity than chasing price near the top of the range.
AMGN is strong. The long-term relative strength is exceptional. The predictive trend remains bullish. But short-term momentum is cooling.
That’s not a contradiction.
That’s the market telling us to keep the stock on the radar, respect the trend, watch the Neural Index closely, and make AMGN prove that the next move has begun before putting additional capital at risk.
Ready to learn more about forecasting stocks and options days before anyone else with up to 87.4% proven accuracy? Attend a FREE LIVE CLASS.
It’s not magic.
It’s machine learning.
THERE IS A SUBSTANTIAL RISK OF LOSS ASSOCIATED WITH TRADING. ONLY RISK CAPITAL SHOULD BE USED TO TRADE. TRADING STOCKS, FUTURES, OPTIONS, FOREX, AND ETFs IS NOT SUITABLE FOR EVERYONE.IMPORTANT NOTICE!
DISCLAIMER: STOCKS, FUTURES, OPTIONS, ETFs AND CURRENCY TRADING ALL HAVE LARGE POTENTIAL REWARDS, BUT THEY ALSO HAVE LARGE POTENTIAL RISK. YOU MUST BE AWARE OF THE RISKS AND BE WILLING TO ACCEPT THEM IN ORDER TO INVEST IN THESE MARKETS. DON’T TRADE WITH MONEY YOU CAN’T AFFORD TO LOSE. THIS ARTICLE AND WEBSITE IS NEITHER A SOLICITATION NOR AN OFFER TO BUY/SELL FUTURES, OPTIONS, STOCKS, OR CURRENCIES. NO REPRESENTATION IS BEING MADE THAT ANY ACCOUNT WILL OR IS LIKELY TO ACHIEVE PROFITS OR LOSSES SIMILAR TO THOSE DISCUSSED ON THIS ARTICLE OR WEBSITE. THE PAST PERFORMANCE OF ANY TRADING SYSTEM OR METHODOLOGY IS NOT NECESSARILY INDICATIVE OF FUTURE RESULTS. CFTC RULE 4.41 – HYPOTHETICAL OR SIMULATED PERFORMANCE RESULTS HAVE CERTAIN LIMITATIONS. UNLIKE AN ACTUAL PERFORMANCE RECORD, SIMULATED RESULTS DO NOT REPRESENT ACTUAL TRADING. ALSO, SINCE THE TRADES HAVE NOT BEEN EXECUTED, THE RESULTS MAY HAVE UNDER-OR-OVER COMPENSATED FOR THE IMPACT, IF ANY, OF CERTAIN MARKET FACTORS, SUCH AS LACK OF LIQUIDITY. SIMULATED TRADING PROGRAMS IN GENERAL ARE ALSO SUBJECT TO THE FACT THAT THEY ARE DESIGNED WITH THE BENEFIT OF HINDSIGHT. NO REPRESENTATION IS BEING MADE THAT ANY ACCOUNT WILL OR IS LIKELY TO ACHIEVE PROFIT OR LOSSES SIMILAR TO THOSE SHOWN.