


Welcome to the Artificial Intelligence Outlook for Forex trading.
VIDEO TRANSCRIPT
Okay, hello everyone and welcome back. My name is Greg Ferman, and this is the Vantage Point AI market outlook for the week of May the 19th, 2025.
PowerShares DB US Dollar IDN Bullish Fund
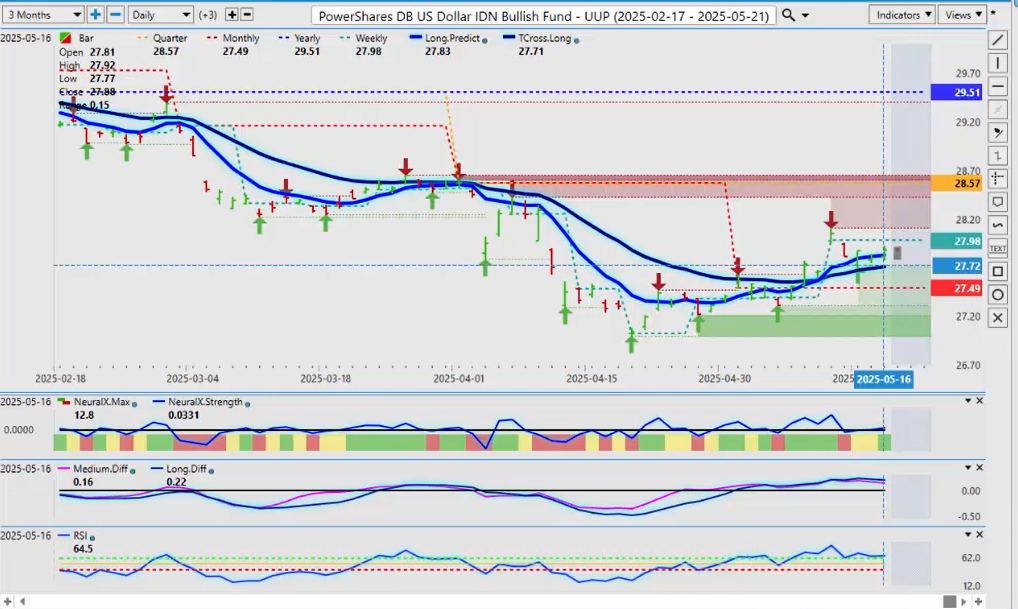
Now, to get started this week, we’ll look at the comparison between the US Dollar Bull Fund and the US Dollar Bear Fund to get a feel for what the US Dollar is actually doing here. So, what we can assess is that we are above the VPT cross long. 27.71 is the critical level. We’re above the monthly opening price at 27.49. So again, still some signs of life in the US Dollar.
Now, my concern is that we have an MAF cross that is pointing lower. The predicted RSI is flatlined, but our neural index and our neural index strength are suggesting the dollar still has some life in it. So again, we want to make sure we’re not moving our anchor points around here, guys. Right now, we’re positive on the month and we’re above the Vantage Point TRSOS long. Those are our key support levels — the T Cross Long again at 27.71 and the monthly opening price at 27.49. We would need a breakdown of these two levels to actually leave the Bull Fund.
PowerShares DB US Dollar IDX Bearish Fund
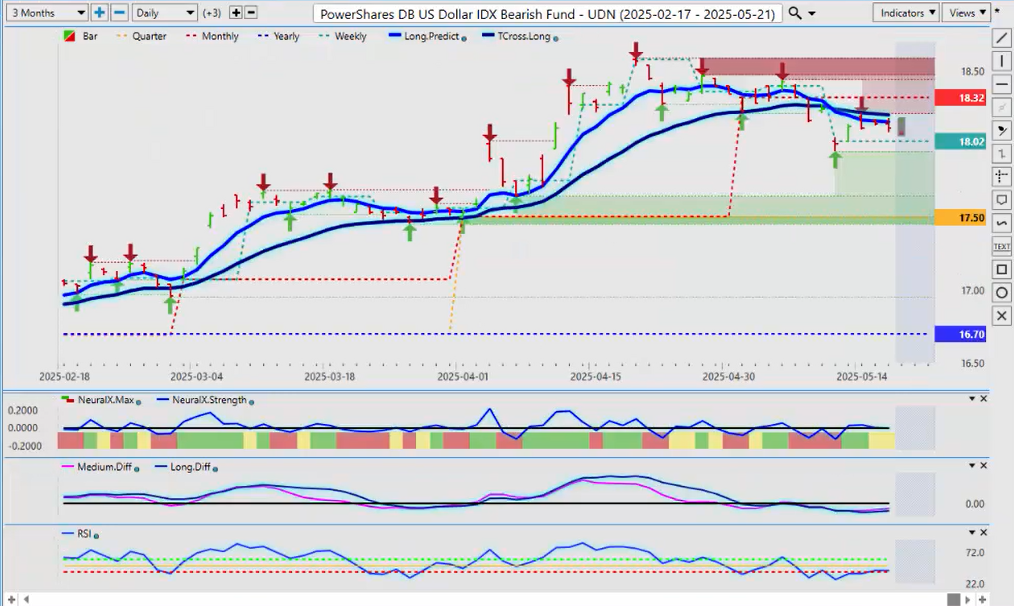
Now, the alternative is the UDN, the Dollar Bear Fund. Now again, what’s concerning is that we always seem to put a high and a low in for the week on the Monday. So, we made a big push down on the Monday, but we didn’t have any follow-through on the Bear Fund at all. We put a support low at 17.95 — a newly formed verified zone. Again, we’re retracing back to our TCROSS Long at 18.20. That is a key level. We are below the monthly opening price at 18.32. So all of our resistance is here.
Another way that the more savvy trader can play this is to have a buy stop above either the T Cross Long at 18.20 or the monthly opening price at 18.32. If we can get above that level, then we could see the Dollar Bear Fund accelerate. But that’s very unlikely at this time of the month.
Now, normally, we would have one more push of dollar weakness until we get to the end of the month. Then, we see the dollar turn around and get strong and follow that same pattern.
SPDR SPY ETF ($SPY)
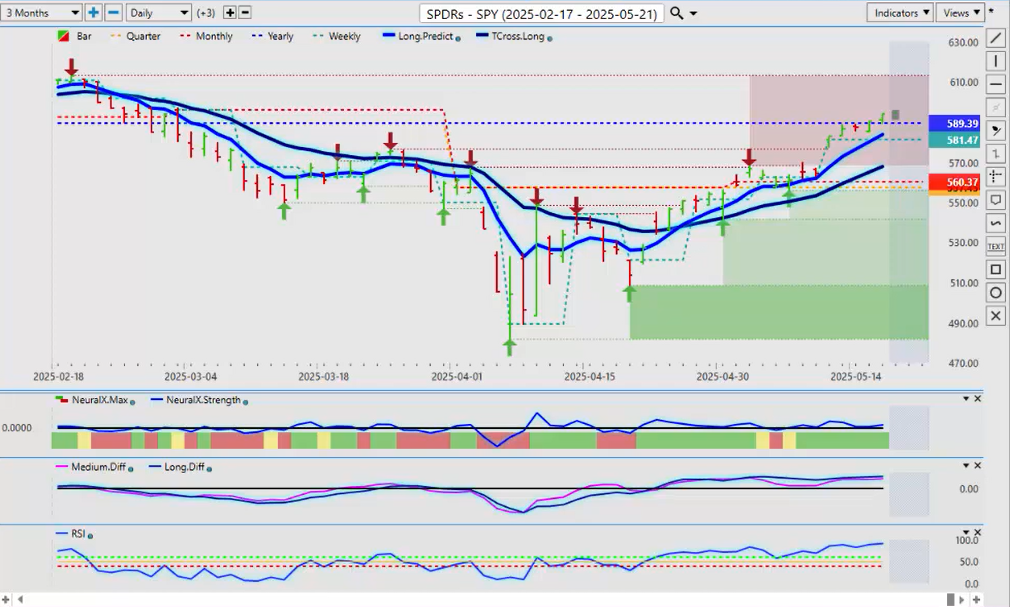
Now, looking at the equity market, the SPYs — they have fought their way all the way back up to and above the calendar yearly opening price. Now once again here, guys, we have to make sure that we’re accurately measuring performance. So, we use the current monthly opening price. That is the only performance we’re looking at. We don’t want to move the goalposts. So right now, we’re up a mere 5.59% on the month. Now that’s good, but if the S&P 500 and the SPY is going to fail, it’s going to likely be in the weeks ahead leading up to the end of the month.
Now again, the current yearly opening price — the most important number to us right now — is 589.39. We’ve already — we’re already up 5.1% on the month. So again, I’m not saying it can’t move higher here, guys, but I think that — be careful. Be very, very cautious of a bull trap up here, is what I will say. Because in most cases, as we move towards the end of the month, the equities usually move lower and the Dollar typically moves higher.
But I have seen a relatively strong positive correlation since November between the US Dollar and the main equity markets. But again, that calendar yearly opening is very, very important for us to stay above that.
Gold
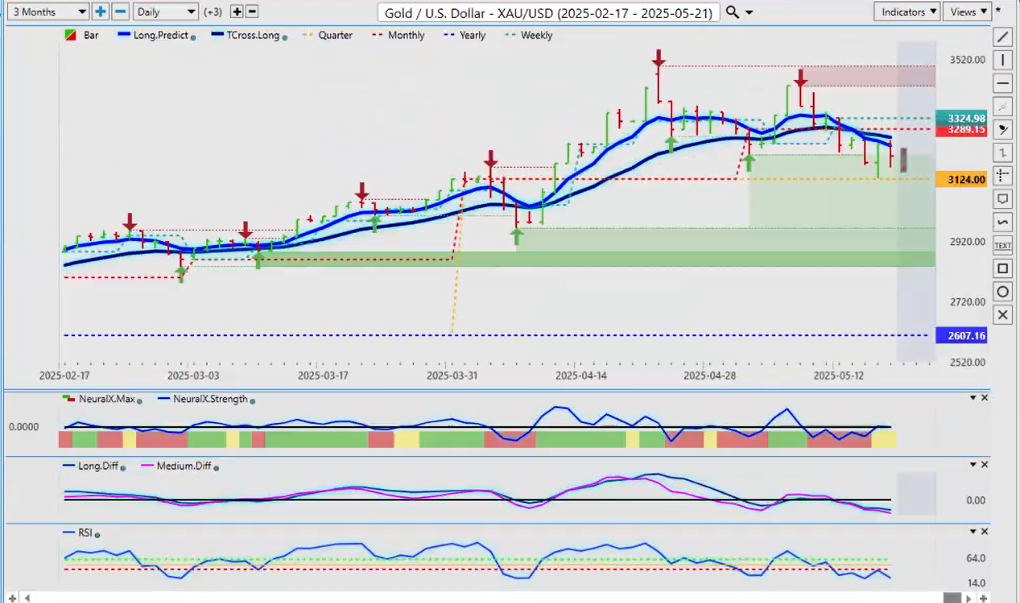
Now, when we look at Gold prices — again, Gold unable to hold its value up here. Now again, we’re still grossly positive on the year — 26.07. The main indicators again are mixed but still pointing down. But here’s what I want everybody to see again: when we start moving around or saying, “Okay, a random 30 days of performance, a random 60 or 90 or 120 or a year, a year-over-year…” We want a year-to-date and month-to-date and quarter-to-date.
So, the quarterly opening on Gold — 31.24 — you’ll notice we came down, hit that exact level on Thursday, and then had a fairly significant rebound from that level. So, in my respectful opinion, Gold remains bullish while above 31.24, and we remain very positive on the year — 26.07.
Again, if we move the goalposts around with performance numbers, it confuses most people into thinking something is bullish when it’s bearish, or it’s bearish when it’s actually bullish. So again, that test of the quarterly opening speaks volumes as to the real value.
Now, if you are a net seller of Gold, then I would respectfully submit you would put a sell stop limit order below 31.24. If it breaks down below that level, you can immediately pick up the shorts. But for now, there is still an upside bias while the Fed tries to figure out what their next move is — which I think they’re very confused on.
United States Oil ($USO)
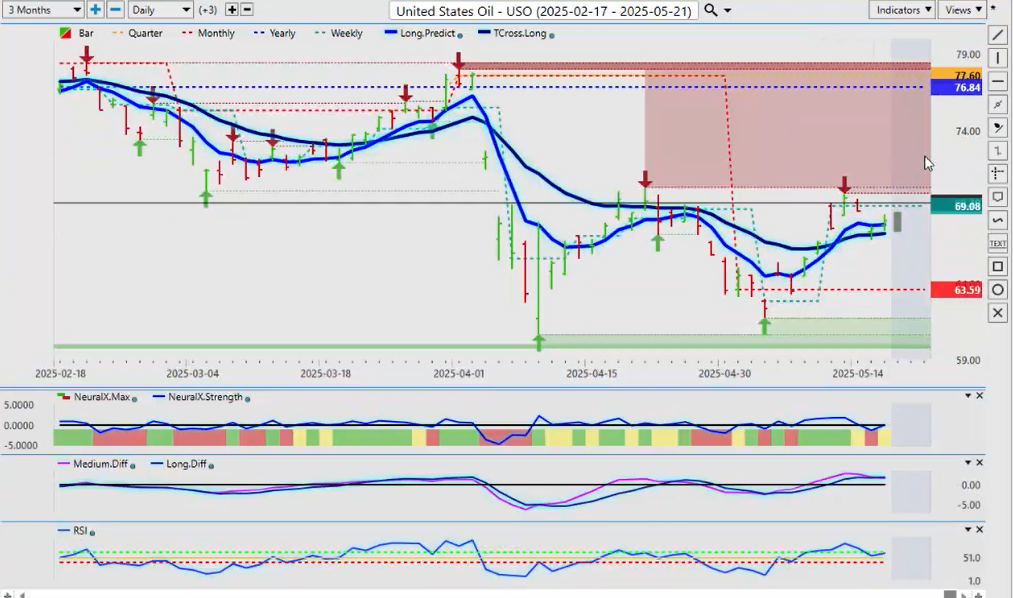
Now with Oil prices — once again, when we look at how trading went for the week, we come back here, back and forth throughout the calendar week, but we finished off on the TCROSS Long — 67.27. I believe this level is likely to hold. We’re above the monthly opening price. Again, structurally, it is bearish on the year, but we’re coming into a period of known Oil strength, and that is usually in May, June, and part of July — also the ARBOP Gasoline Contracts.
But for now, USO is what we will use to gauge whether Oil is bullish or bearish. And for now, I believe that we will hold above that TROS Long at 67.27, but I would also be a buyer down to 63.59 — the current calendar monthly opening price.
The indicators are dead sideways on this one, guys. The MA Diff is flat. The neural index is showing some signs of life here, and the predicted RSI has actually got a reverse checkmark — suggesting that this was just a retracement and we are getting ready to move higher off of those critical VPT Cross Longs. So, longs still carry a slight edge to the upside.
Bitcoin
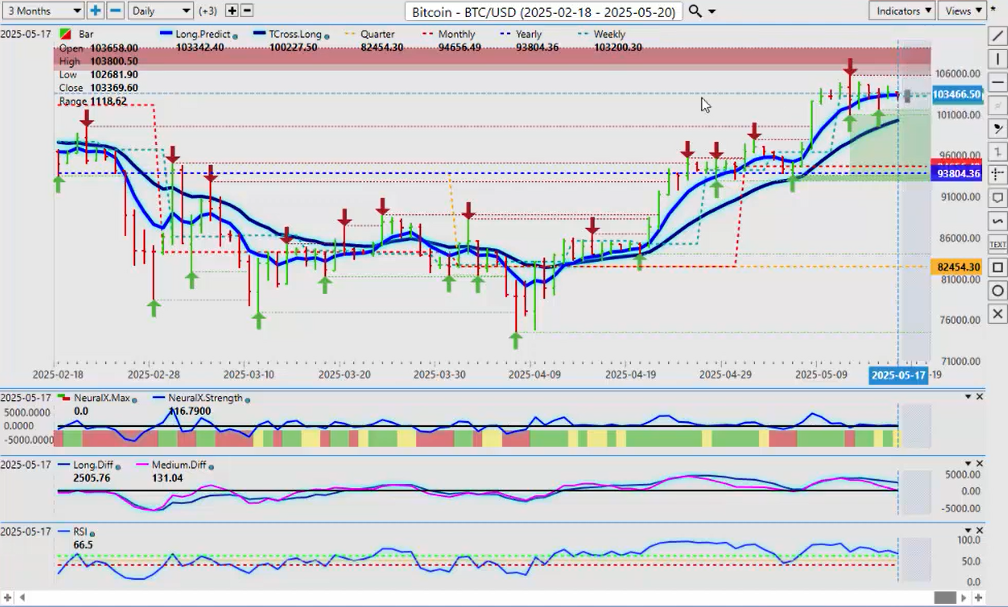
Now, when we look at Bitcoin going into next week — not a lot of activity here. We’ve had a big push on the Monday. So, we come back to 4/5 right there — big upside, big downside — and we didn’t make a new high or a new low after that bar. So, where we sit right now, I believe that Bitcoin will come down and test the VPT Cross Long.
Now, this will be a very critical psychological level because it’s at 100,000 — just above the 100,000 mark — 100227.50. So we come down there, we reassess. But structurally speaking in the market — again, using proper anchor points — I don’t want to move around and guess at performance. I’m above my monthly opening. I’m above my yearly opening. I’m above my quarterly opening. Structurally, the bias is still to the upside.
But I feel that, again, this is not the best month to be buying Bitcoin. In most cases, we’ll see a lot of activity between August through October in Bitcoin. So, a retracement would be perfectly normal. But that psychological level of 100,000 — I would love to see us stay above that. And then I would be a happy buyer of this particular asset class.
Now again, there’s a number of different ways to buy Bitcoin. You can buy it on the spot market. You can also use an ETF — one of my favorites is the Cathie Wood ARKB Fund — but you can see that it too is stalling out up here, and it just can’t seem to get moving.
We’ve had a retracement, but again, not entirely convinced that this is the best month to be buying Bitcoin at these particular levels or the Bitcoin ETFs. But if we can see it coming down a little bit lower, I think that there’s still good value while we wait for year-end.
Euro versus U.S. Dollar
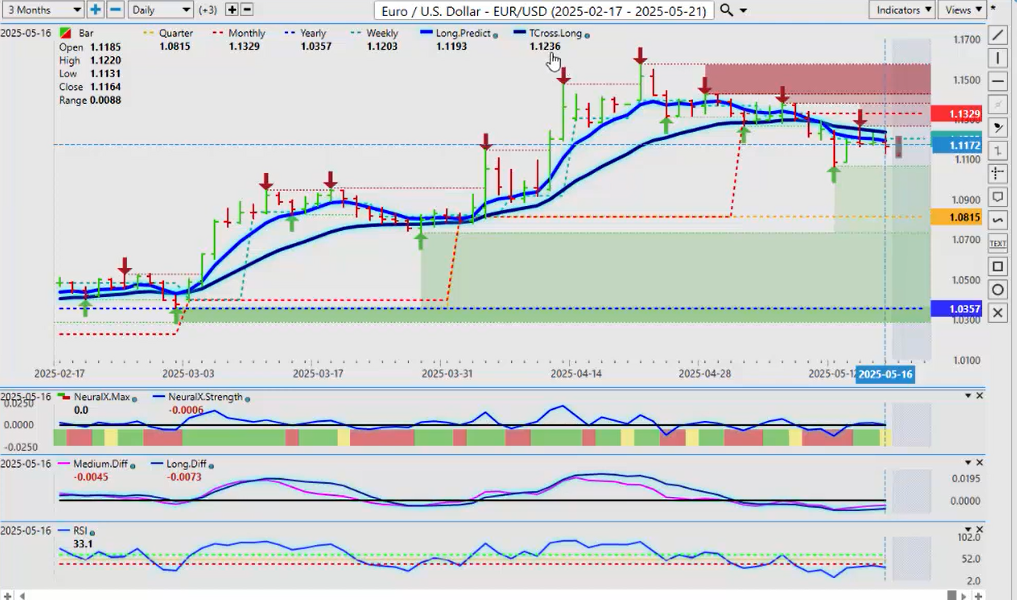
Now, when we look at some of our main forex pairs here — looking at first and foremost the EUR/USD. Now guys, this basically is a Dollar Index chart. The EUR/USD, as I’ve said many times, is literally 99.99% inverse correlated to the Dollar Index. So EUR/USD down, Dollar Index up.
So we put a bottom in on the Euro right out of the gate on Monday, and we had zero follow-through. We’ve had multiple retracements last week up to the TCROSS Long. I believe that we can, on a temporary basis, break through this level next week. But as we go into the end of the month, that Dollar strength is still likely going to be there, guys.
Okay, so I would look for a break of the TCROSS Long at 1.1236. But we are negative on the month, though we are very, very much positive on the year here — and that’s what most traders miss, because they start moving their anchor points.
So if we look at the Euro right now and everybody is convinced that the Euro is so bearish — when in actual fact, guys, it’s up 7.85% on the calendar year. The Euro is having the best year in a long, long time. So don’t let anybody confuse you because it’s moving lower in the last several weeks.
We’ve got the low from Monday — 1.1057. We’ll use that as a baseline for next week. If that level holds, then we are likely going to take out the TROS Long. That TROS Long at 1.1236 — we would likely take that out by Tuesday or Wednesday.
But to be clear, if we cannot break through that critical VP level, then we are going lower.
Now, one of the things that I see that tells me or helps me understand the currency markets — that the Dollar Index is probably not going to have a great week next week. Maybe okay on Monday, but Tuesday, Wednesday, Thursday, Friday could be very different.
U.S. Dollar versus Swiss Franc
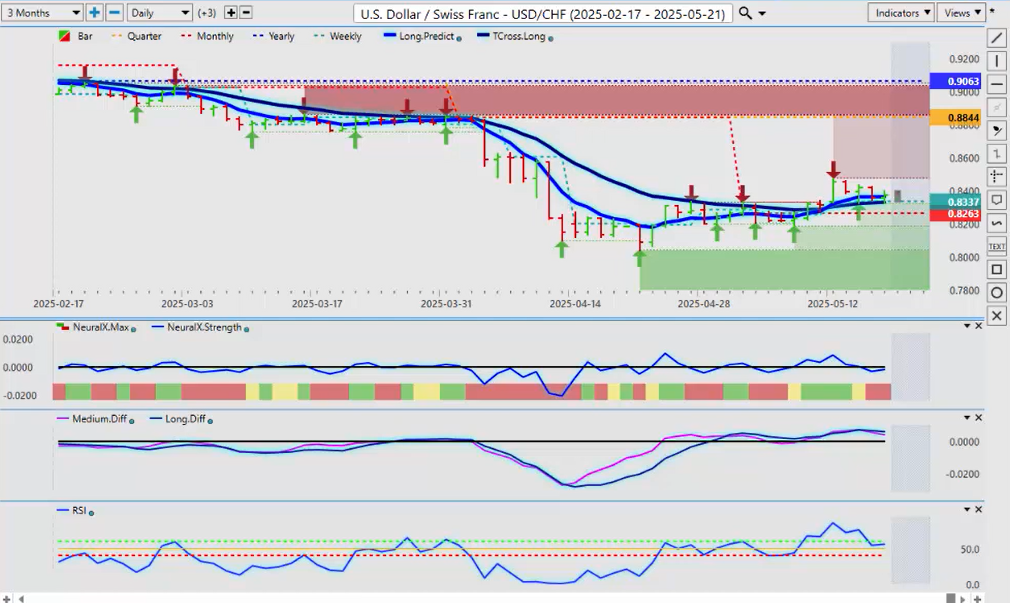
The USD/CHF, about 98% positively correlated to that Dollar Index — and as you can see, we made a big move up this past Monday, and we’ve done nothing but move lower since. So we’re getting all tangled up on that VPT Cross Long — that level’s coming in at 0.8332. We need to break down below that, but more importantly, break down below the monthly opening at 0.8263. We need to do that quickly — within the next two or three days — or this is nothing more than a retracement, and we go higher into the end of the month.
So keep an eye on the levels there. But the VP MA Diff Cross — right here, pink line over the blue line — says we are going lower. So I suspect, if nothing else, next week we will test that very important monthly opening price at 0.8263.
British Pound versus U.S. Dollar
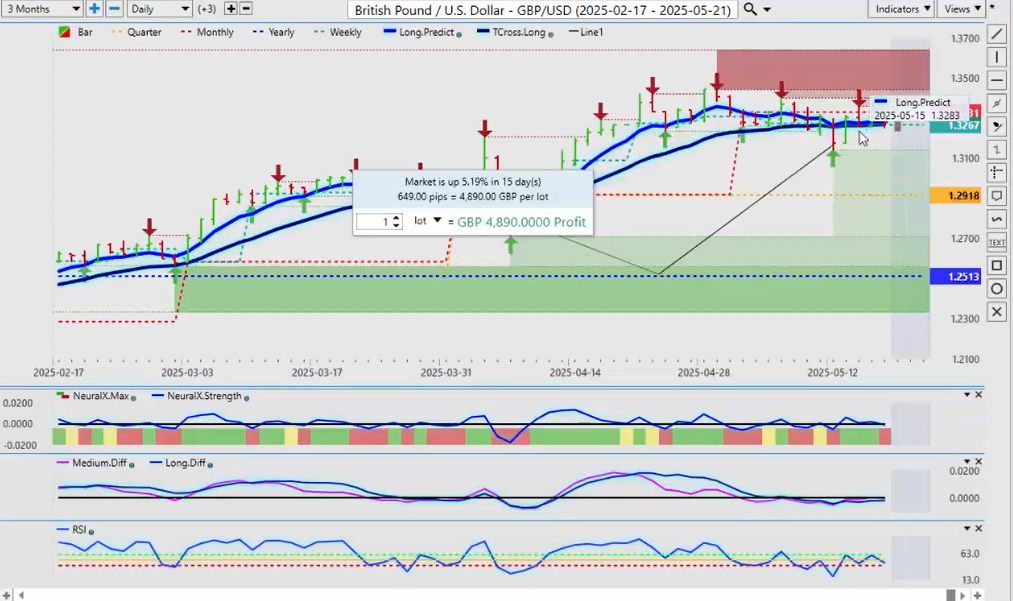
Now, the GBP/USD — pretty good week out of the gate. But once again, not much for follow-through. Actually, nothing on the downside. So again, we hit that key level, come down, sitting right there — that low of that Monday bar, 1.3140. And as you can see, there were simply no sellers down there, and we moved back up.
So from a structural basis, you can see the monthly opening price is critical here, guys. It’s containing it lower. So if we can break through the monthly opening price at 1.3331, we’ve got ourselves a pretty good long here. But be careful of a bull trap going into the end of the month.
That Dollar cycle that I’ve talked about for many years on this very presentation — every week, there is a clear cycle in the Dollar: that it gets strong at the end of the month into the first week of the new month, then it sells off, and it usually remains somewhat flat throughout the month. So again, a push — one more push higher on the GBP/USD, in my respectful opinion, before we go lower.
And again, the indicators on VP are still saying that there is some downside left here. But if we can get above that monthly opening price, we can still extend higher — at least for another week.
U.S. Dollar versus Japanese Yen
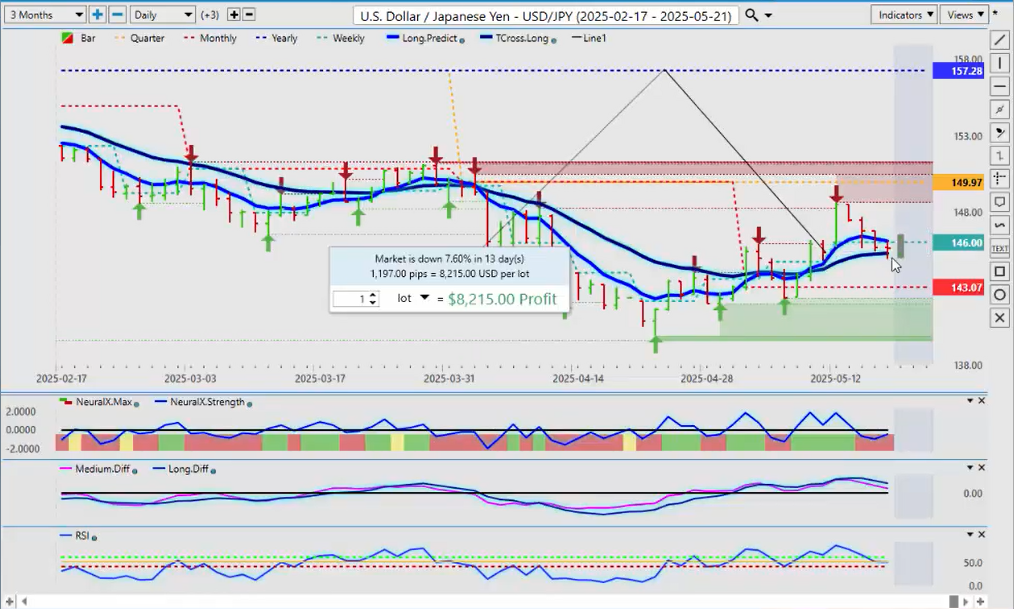
Okay, now the USD/JPY — basically, the carry trade coming apart at the seams here. And again, when we look at it from the yearly opening price, it’s indisputable that the Yen is having a much better year than it’s had in the last few years with the carry trade.
So I believe the TCROSS Long at 145.29 is likely to give way by midweek. Now, if there’s any kind of movement to the downside on the NASDAQ, the S&P 500, Bitcoin — that would be the catalyst to send this pair lower. If those markets that I just mentioned stay up, well then USD/JPY could rebound.
But right now, the MA Diff Cross is pointing down. But we don’t have a lot of momentum in that predicted RSI. I’m looking for a break of the 40 level to say, “Look, I’ve got a lot of momentum building.”
But on a side note here, guys — be careful on Monday, once again. And I’ve warned my own direct clients on this many times: when you get a big push on a Monday, the probability of follow-through is very, very low. And it would take a very strong fundamental to keep the USD/JPY going higher.
But again, you can see, as we approach the quarterly opening price, we fail again. So right now, the monthly opening price at 143.07 — that price target is a very realistic target for at least another week, week and a half. Then we’ve got to be careful at the end of the month.
So again, the VP indicators do support it going lower. But we’ve got to break through the VPT Cross Long — that critical predicted moving average based on the correlation to 31 other markets — and that level is 145.29.
So again, the savvy trader could put a sell stop just below 145. If we break down below that, this pair has plenty of room to run down to 143.
U.S. Dollar versus Canadian Dollar
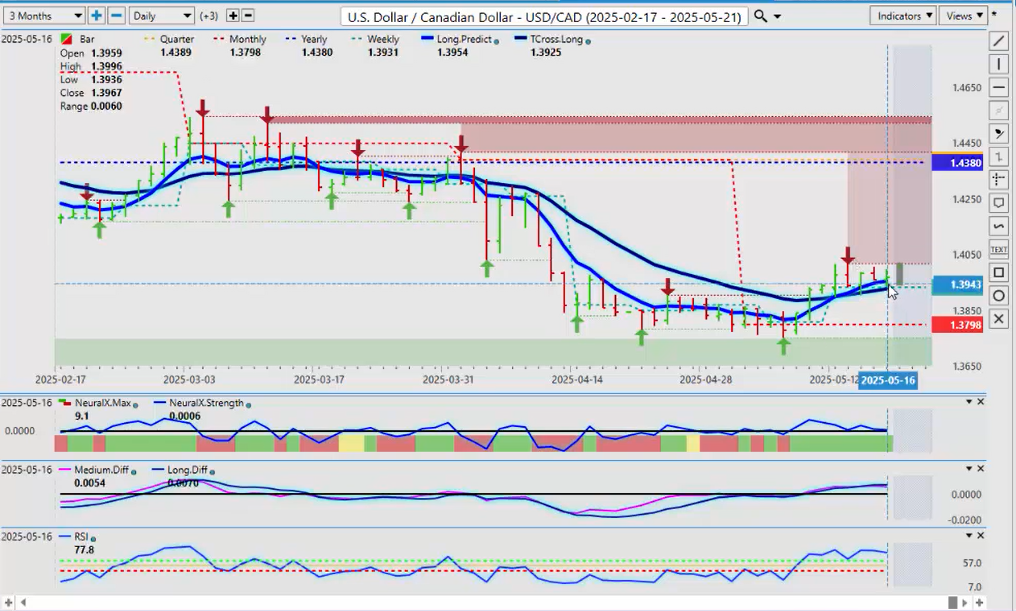
Now, the USD/CAD pair — once again, the data coming out of Canada, not very good at all. We do have some inflation — more inflation data coming out next week. I don’t think it’s going to be overly supportive for the Canadian Dollar, but there is that strong correlation the Canadian Dollar has to Oil, so we’ll keep an eye on this.
But for now, that TCROSSLong, 1.3925 — always remember, guys, this is an outlook, not a recap of something that’s already taken place. So these levels are in play as soon as trading starts in the next hour.
You can see it’s 5:07 on Sunday night when I’m doing this video. So when this video is posted, the market is just opening. So, 1.3925, and of course, that very important calendar monthly opening price — 1.3798. Those are your two main support levels for next week.
But that’s the area that — if this pair is going to go lower, guys — we have to break down below 1.3925.
Australian Dollar versus U.S. Dollar
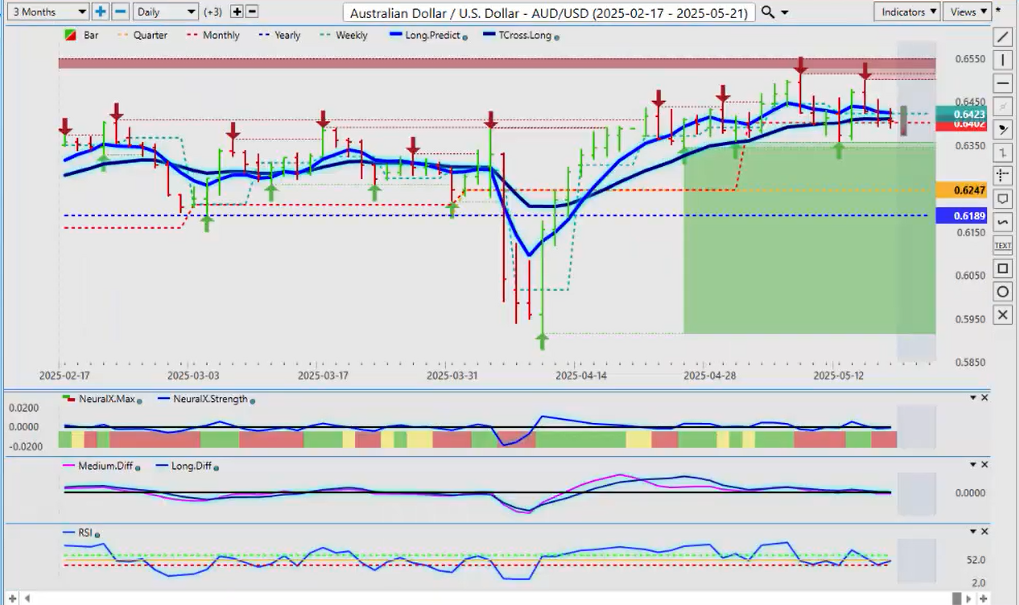
Now, the AUD/USD and the NZD/USD — they did see some movement this week. And again, when we look at it — one, two, three, four, five — you can see that we had a big push down on Monday and a complete reversal on Tuesday.
So, my strong advice — free advice, I might add — is: be careful on Monday. Don’t jump into the market too early. The media is playing games with you guys — that’s what they’re doing. They’re putting out announcements, news that is highly questionable whether it’s accurate or not, and the market reacts to it. There’s a big swing to the upside, the downside — and very often on Tuesday, it reverses. And then by midweek, we’re basically trapped inside that Monday bar high and low.
So be very cautious with this. But for now, structurally speaking, we’re positive on the quarter — 0.6247. We’re positive on the year — 0.6189. But always remember that those are also your retracement points, guys, okay?
But the indicators from VP are still mildly bullish on here. So longs — well, longs will carry the edge, in my respectful opinion, only while above 0.6357.
New Zealand Dollar versus U.S. Dollar
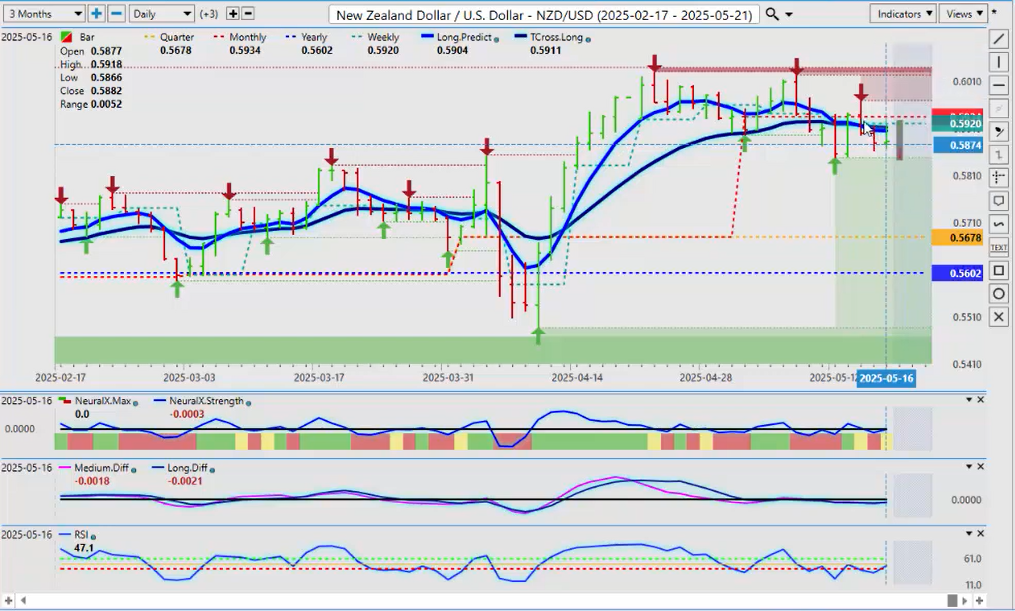
Very similar with the NZD/USD. When we look at the Kiwi, a little more pronounced breakdown below that TCROSS Long. And I believe this is coming from buyers on Australia and New Zealand — the cross pair.
So when I’m looking at this right now, we’ve got decent support down here at the lows — 0.5847. These indicators actually suggest that the Kiwi is the one that may turn higher next week first.
If that’s the case — on a side note — then you would look to sell AUD/NZD.
Always remember what AUD/NZD is, guys — it’s made up of AUD/USD and NZD/USD. So AUD/USD and NZD/USD, actually from an intermarket analysis standpoint, they’re a window into what could happen with the main cross pair. Or it lets us tell — okay, which one are they going to buy? AUD/USD, NZD/USD, or both? And which one has a slight advantage?
I would argue that the Kiwi next week has a slight advantage. And again, if you even have the slightest of an advantage in these markets, then you’re ahead of the rest of the game.
So with that said, this is the Vantage Point AI market outlook for the week of May the 19th, 2025.

