





Hot Stock Snapshot: Tapestry ($TPR)
Company Profile
Tapestry ($TPR) is a global luxury accessories and lifestyle company built primarily around Coach and Kate Spade New York. Coach is the company’s dominant growth engine. In the first nine months of fiscal 2026, Coach produced approximately $5.27 billion of revenue compared with about $840 million from Kate Spade. Tapestry completed the sale of Stuart Weitzman in August 2025, leaving management with a more concentrated portfolio and greater reliance on the extraordinary strength of Coach.
The business story has strengthened considerably. Fiscal 2025 produced record revenue of approximately $7.01 billion, and the first nine months of fiscal 2026 have already generated $6.13 billion. In the latest reported quarter, revenue jumped to $1.92 billion, up 21% year over year, while GAAP net income increased to approximately $344 million from $203 million. Management subsequently raised its fiscal 2026 revenue outlook to approximately $7.95 billion.
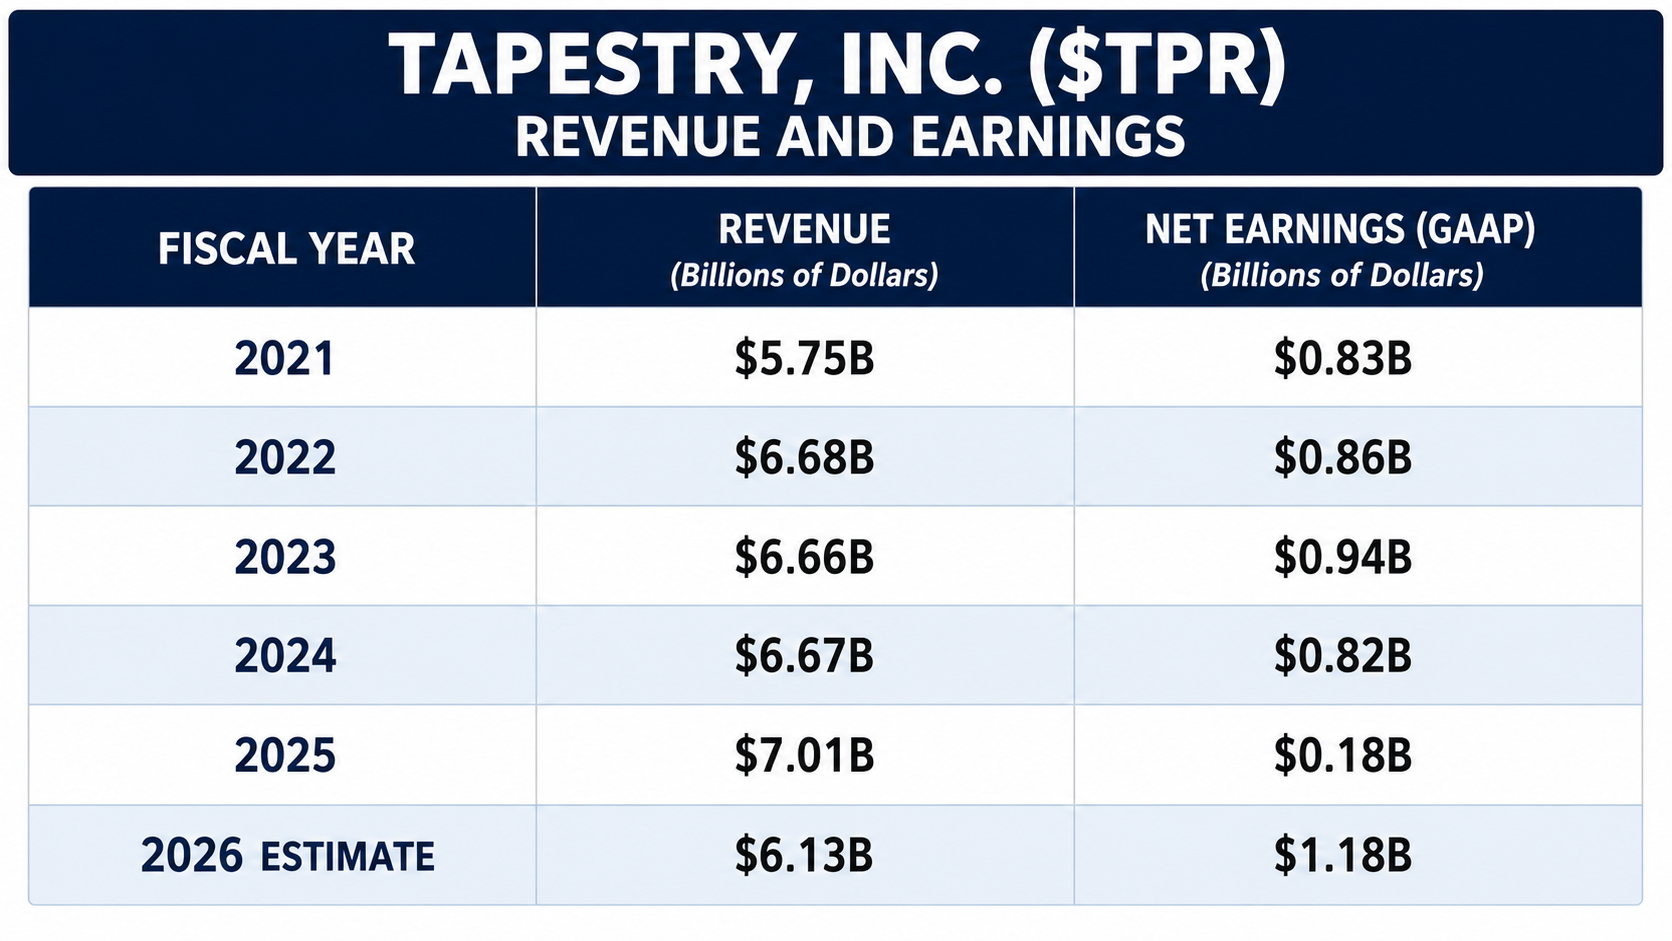
The table needs context. Fiscal 2025’s reported earnings were severely depressed by approximately $951 million of after-tax charges, including major Kate Spade impairment charges, acquisition-related expenses and restructuring items. On an adjusted basis, underlying profitability actually improved. Fiscal 2026 makes the acceleration much easier to see, because through only nine months Tapestry has already earned approximately $1.21 billion on an adjusted basis, more than the adjusted profit generated during all of fiscal 2025.
For traders, that distinction is critical. This is not simply a stock making new highs while its business stands still. Revenue growth, margins and underlying profitability have accelerated at the same time that the stock has moved toward record territory. That provides a fundamentally stronger foundation for the technical trend.
52-Week Range Analysis
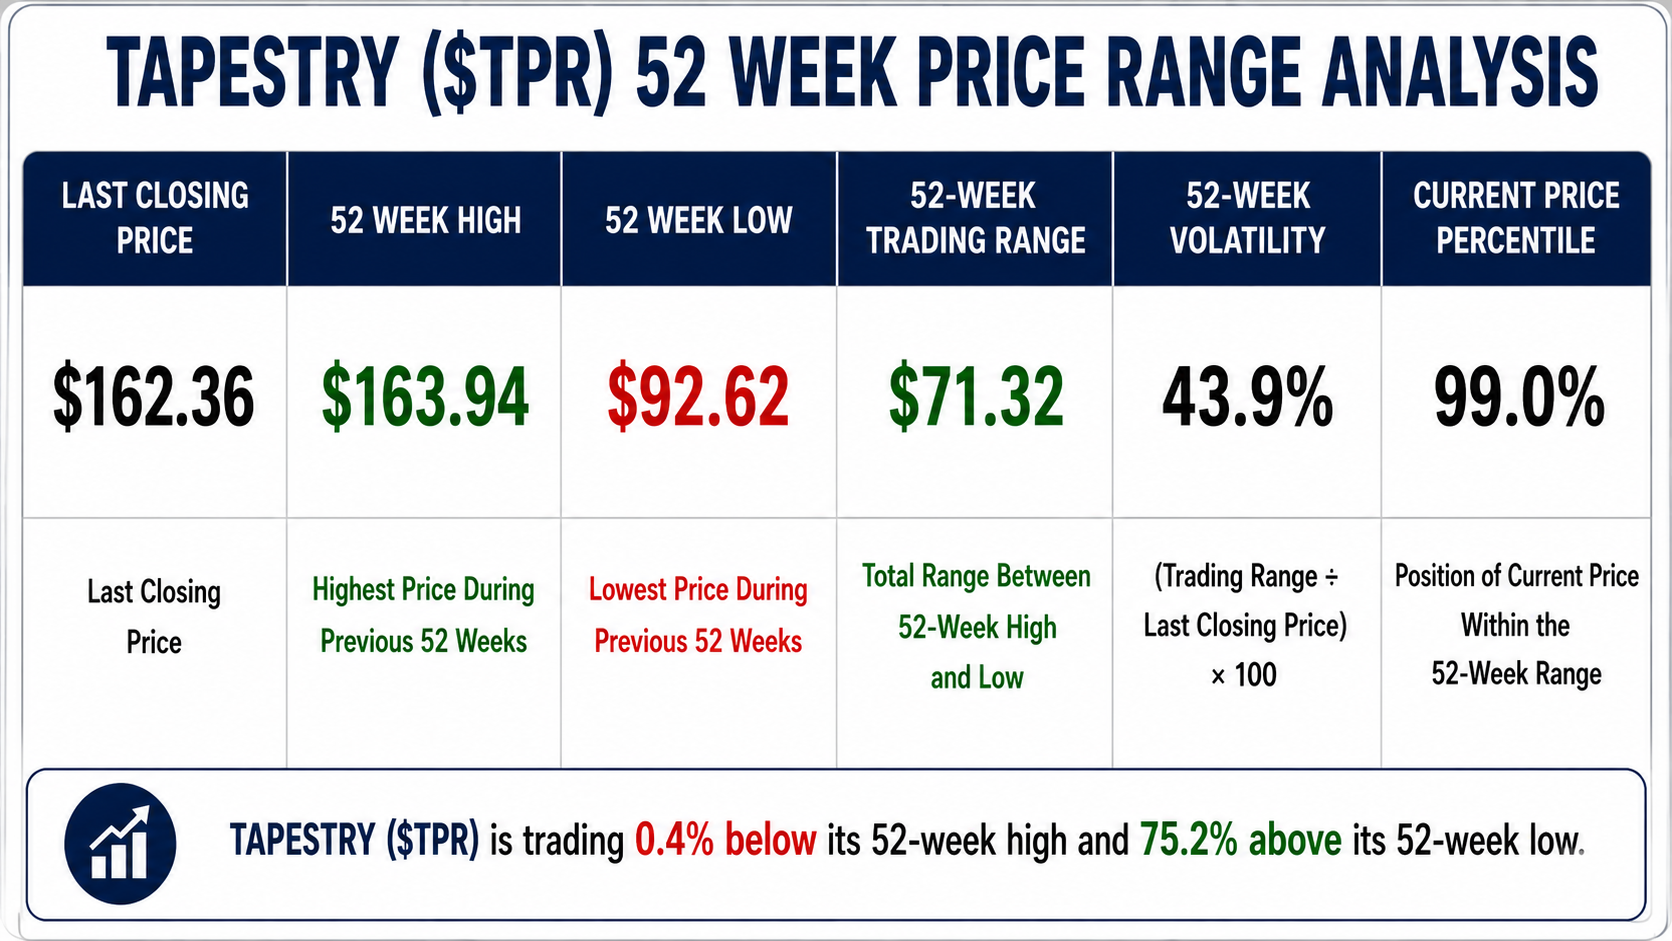
$TPR closed at $162.36, versus a 52-week high of $163.94 and a 52-week low of $92.62. The total trading range is $71.32, and using our annual-range-to-current-price measurement, the stock’s 52-week volatility is approximately 43.9%. Most importantly, $TPR sits at roughly the 99th percentile of its 52-week range. It is effectively trading at the top of the mountain.
That is both bullish and informative about risk. $TPR is approximately 1% below its 52-week high and about 75% above its 52-week low. Traders frequently make the mistake of treating proximity to a high as evidence that a stock is “too expensive.” Momentum traders should look at it differently. Stocks cannot make new highs without first trading near old highs. What matters now is whether buyers continue defending the trend when the stock pulls back. The 43.9% range measurement also reminds us that $TPR is capable of substantial movement, so position size matters.
52-Week Chart Analysis
The 52-week chart tells an impressive story. $TPR traded near the $100 area last fall, recovered into the $150s, endured several substantial corrections, and repeatedly attracted buyers. The structure ultimately evolved into a series of major recoveries followed by fresh advances. Most recently, price pushed back through the prior $150 to $157 resistance region and accelerated toward $164.
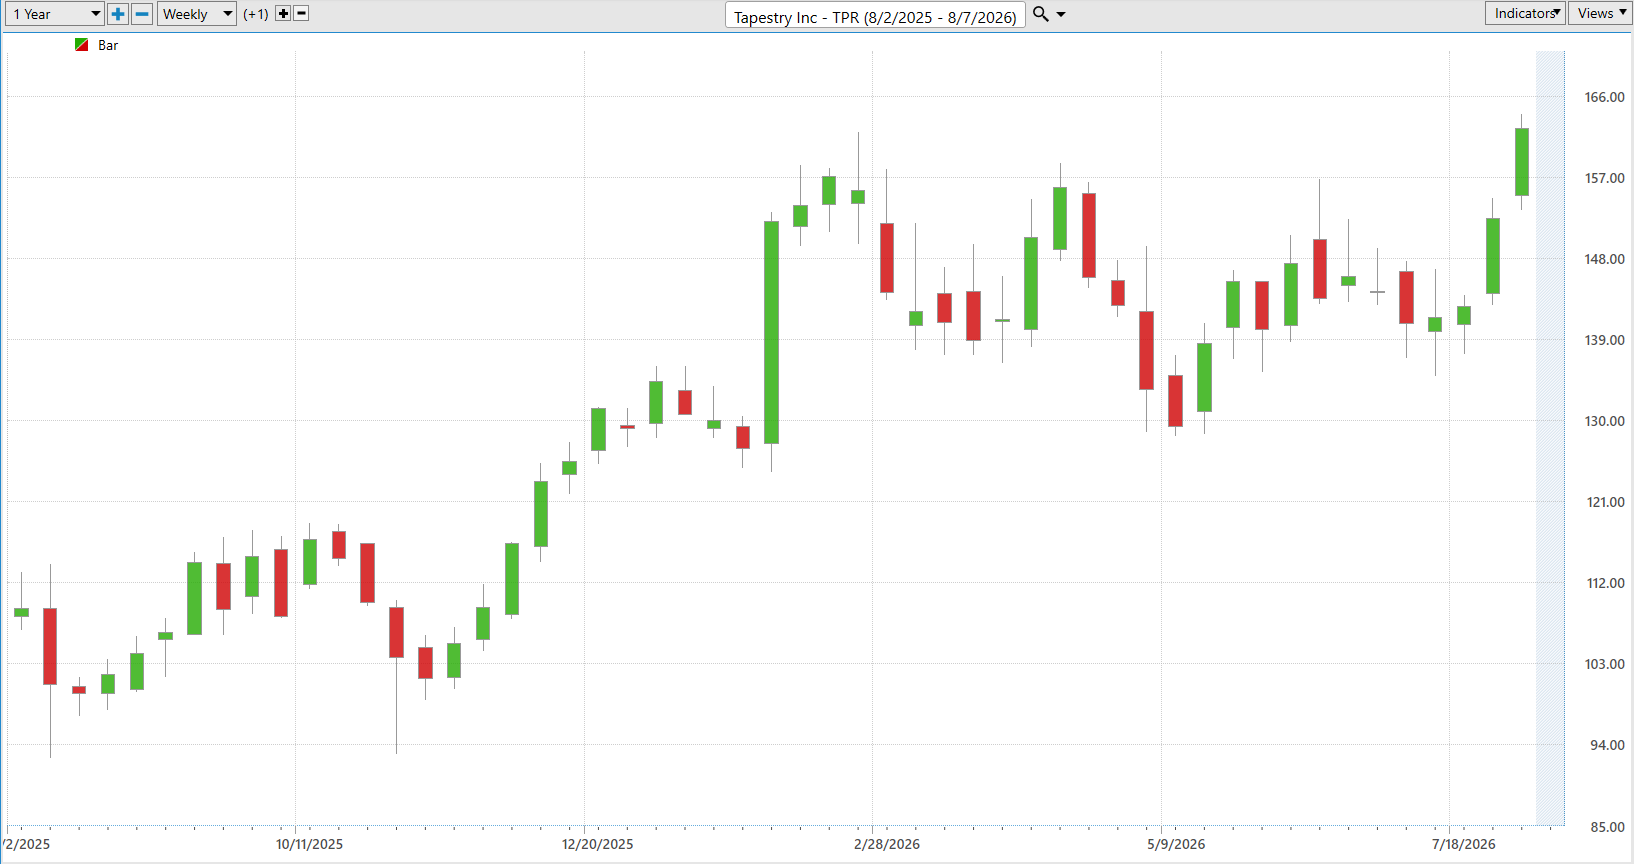
This is what traders mean when they talk about market leadership. The important feature is not that $TPR went straight up. It did not. The stock experienced several sharp setbacks and then recovered from every one of them. That ability to absorb selling pressure and subsequently challenge or exceed previous highs tells us demand has consistently returned. Right now, the longer-term chart remains decisively bullish.
Best-Case Analysis
Volatility is very poorly understood by traders. It is not theoretical. This exercise is one of the fastest ways to understand both risk and opportunity because it measures what the stock has actually demonstrated it can do.
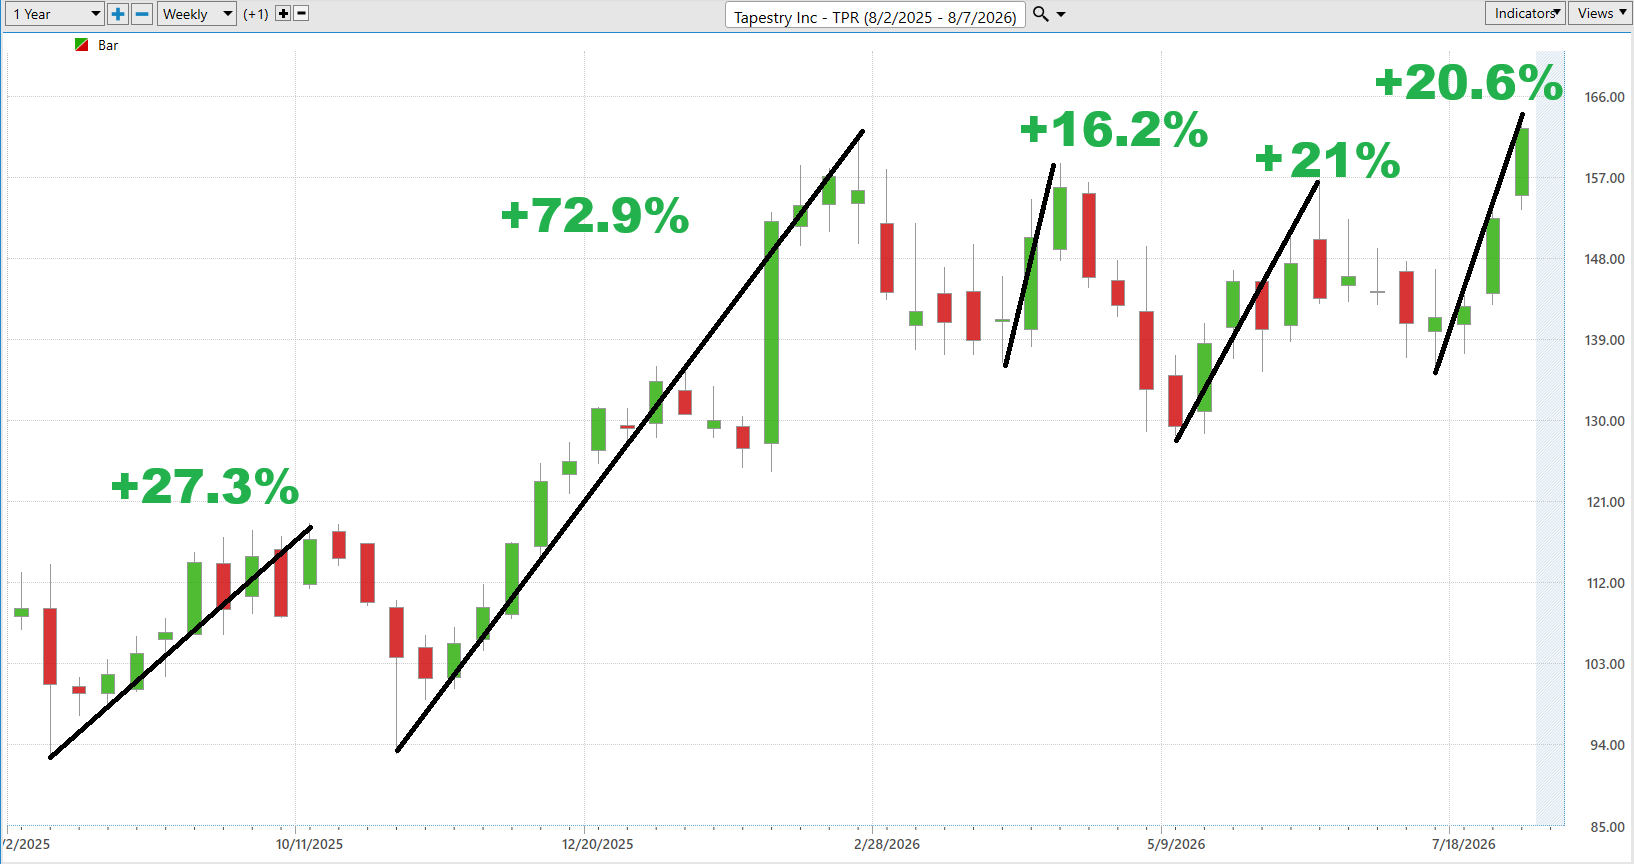
During the past year, the major bullish advances highlighted on the chart ranged from approximately +16% to +73%. The most dramatic advance was roughly +72.9%, while other meaningful rallies measured approximately +27.3%, +16.2%, +21% and +20.6%. This tells us $TPR has repeatedly rewarded traders who were positioned on the correct side of the trend.
The most useful observation is that the current advance of approximately 20.6% is not historically extraordinary for this stock. Tapestry has already produced several moves in this general neighborhood and one dramatically larger advance. That does not predict another 50% rally. It tells us that a 20% move alone is not sufficient evidence that the trend must be exhausted.
Worst-Case Analysis
Now we look at the invoice that comes with all that opportunity. The significant corrections shown during the same period range from approximately 8% to 21%, including setbacks of roughly 20.8%, 8.2%, 15.2%, 19% and 13.6%.
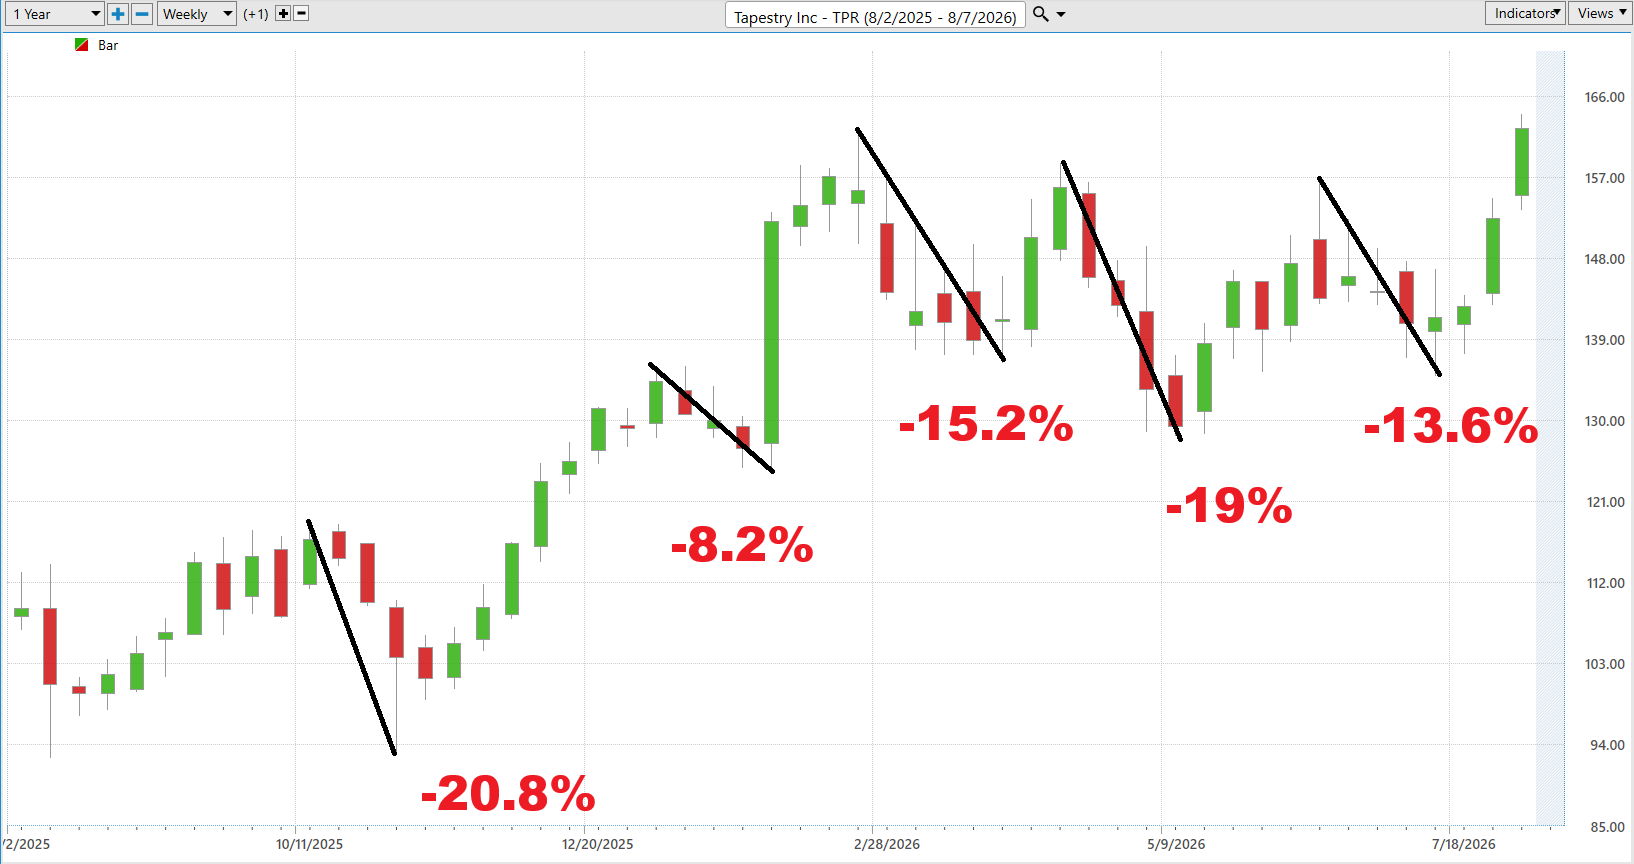
That is extremely important with the stock now near a 52-week high. A trader can be completely correct about the long-term bullish trend and still experience a 10%, 15% or even 20% drawdown along the way. $TPR has already demonstrated that behavior repeatedly. Volatility is not the same thing as direction.
Put the Best-Case and Worst-Case charts beside each other and the personality of the stock becomes obvious. Tapestry can move very aggressively in both directions. That is precisely why position sizing matters. The goal is to participate in the large upside moves without putting yourself in a position where an historically normal correction destroys the trade or forces an emotional exit.
Comparison Metrics Analysis
Relative strength is one of the most compelling parts of the current setup. Over the annual period, $TPR gained 50.39% compared with 21.72% for the S&P 500. That represents 28.67 percentage points of outperformance. Year to date, Tapestry gained 26.79% compared with 13.11% for the S&P, an advantage of 13.68 percentage points.
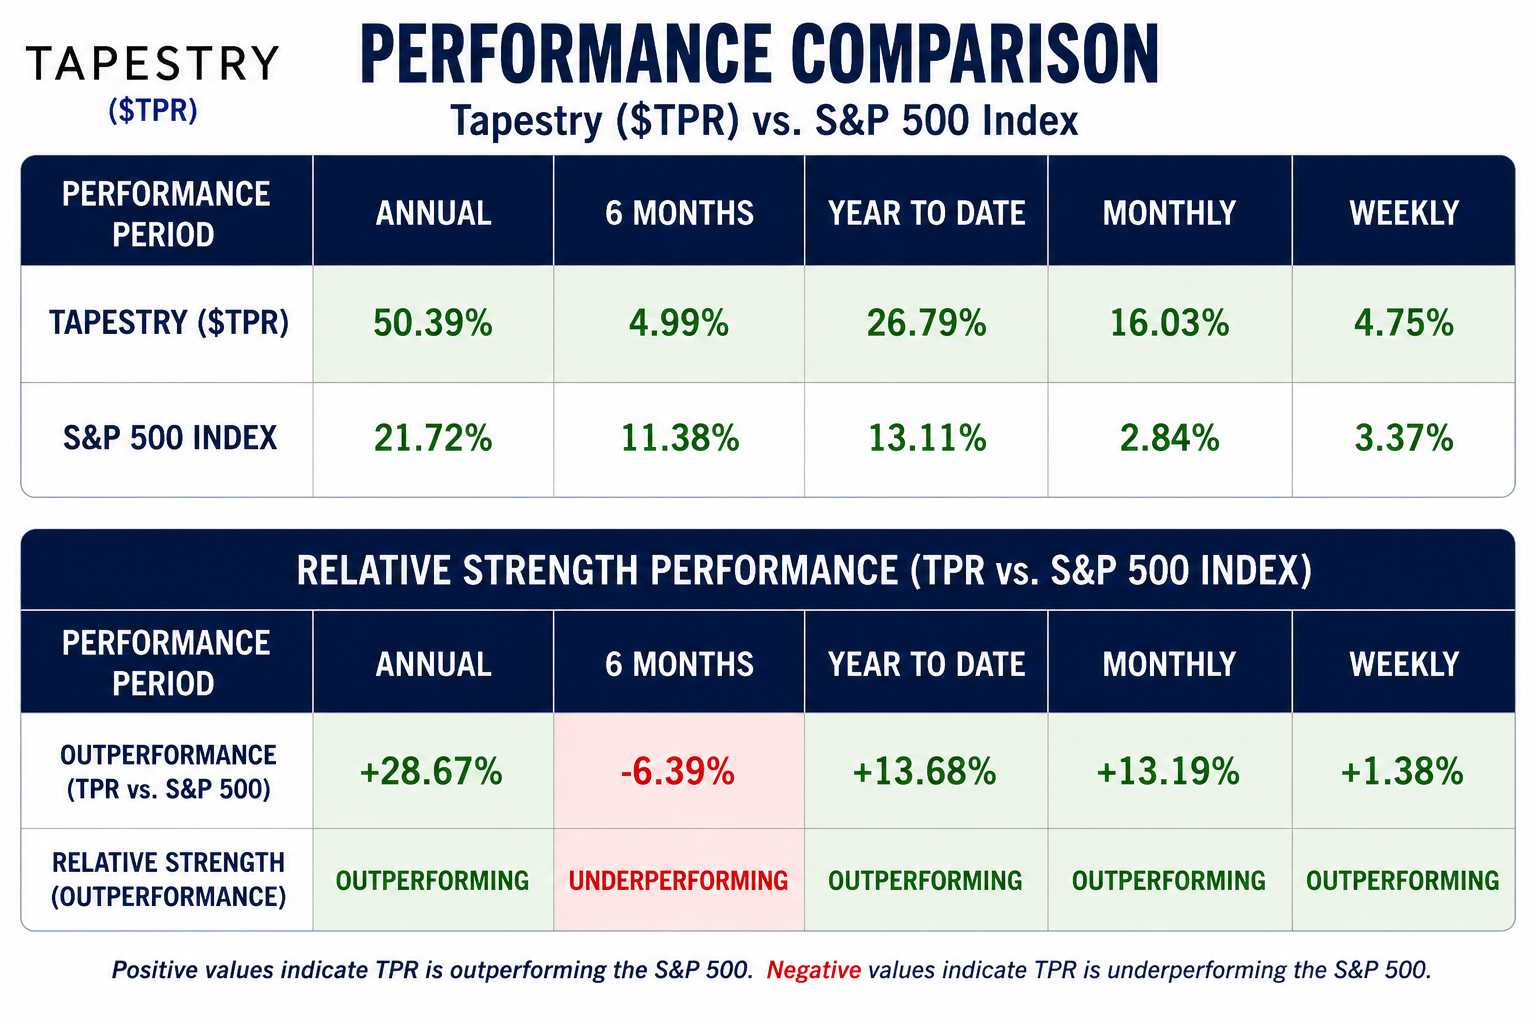
The shorter-term numbers are even more revealing. During the most recent month, $TPR advanced 16.03% versus only 2.84% for the S&P 500, outperforming by 13.19 percentage points. Weekly performance was 4.75% versus 3.37%, another 1.38 points of outperformance. The one weakness is the six-month period, where $TPR gained just 4.99% compared with 11.38% for the S&P, an underperformance of 6.39 points.
That six-month weakness actually makes the recent numbers more interesting. Relative strength weakened and then reaccelerated sharply. Annual, YTD, monthly and weekly performance now favor Tapestry. That tells traders money has rotated back into the stock with considerable force. The current price near a 52-week high is therefore being confirmed by renewed relative strength.
VantagePoint AI Predictive Blue Line Analysis
The Predictive Blue Line is unmistakably bullish. It has risen steadily from approximately $141 in late July toward the upper $150s. More importantly, price has remained above the rising Predictive Blue Line during the advance, while the predictive average itself remains well above the slower actual moving average. Both the direction and slope are positive.
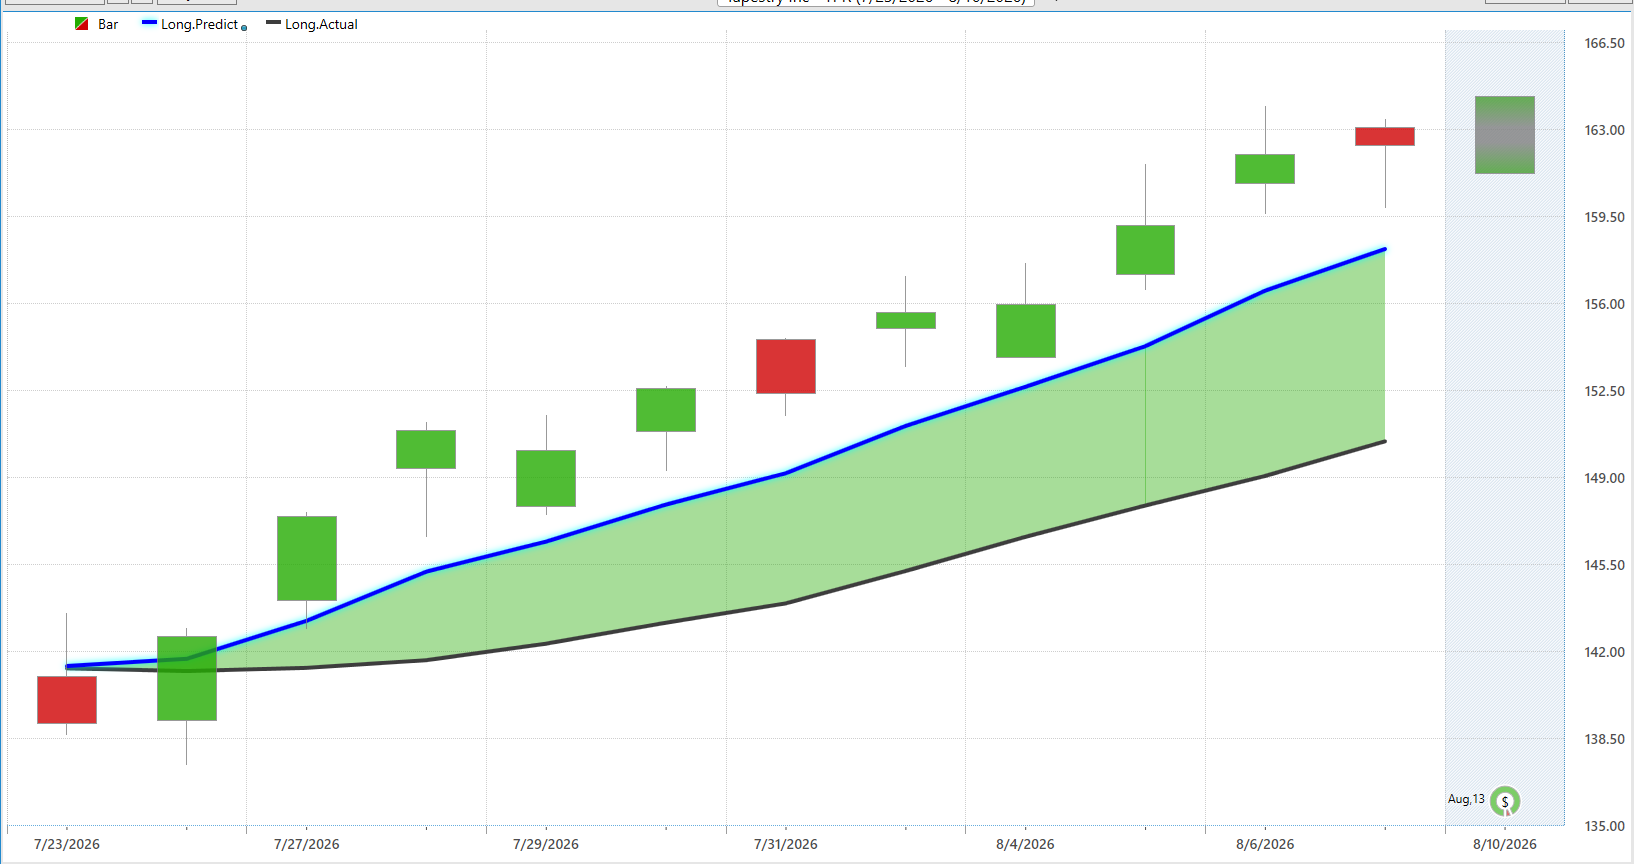
That tells traders that the primary predictive trend remains higher. Instead of treating every red candle as a bearish signal, traders should focus on the relationship between price and the Blue Line. As long as that Blue Line continues pointing higher, pullbacks toward it represent potential value zones within an established uptrend.
The warning would come if the Blue Line begins flattening, rolls over, and price starts spending meaningful time beneath it. We do not see that configuration right now. At present, the indicator is saying: the dominant trend remains bullish, but price is extended above its predictive value area.
VantagePoint AI Neural Index Analysis
The Neural Index provides another layer of confirmation. At the beginning of the displayed period there was a brief negative signal. It quickly turned positive and has remained predominantly green throughout the subsequent advance. At the same time, the Predictive Blue Line has continued rising.
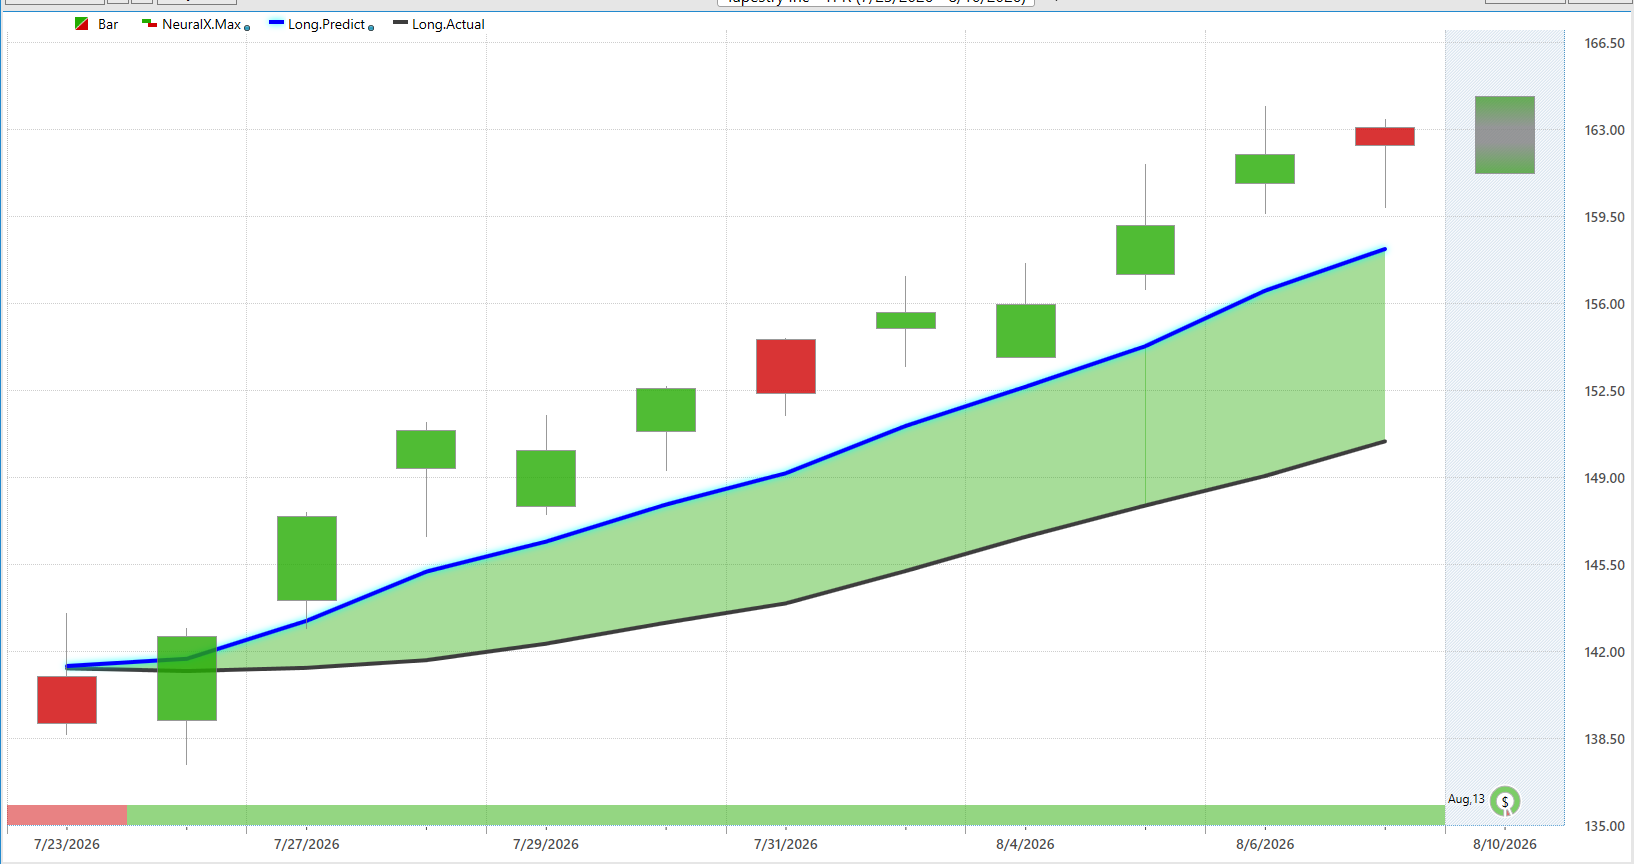
The Neural Index is designed to focus on the next 48 to 72 hours, so it should never be interpreted as a standalone long-term trend indicator. Its usefulness comes from asking whether the short-term forecast agrees with the larger predicted trend. Right now, it does.
This is what we call double confirmation. The Predictive Blue Line identifies an upward primary trend while the Neural Index confirms favorable near-term momentum. When both agree, the evidence supporting the bullish scenario becomes considerably stronger than relying upon either signal independently.
VantagePoint AI Daily Range Forecast Analysis
The Daily Range Forecast addresses a different question: where is the opportunity likely to exist inside the trend? The chart shows the forecast boundaries moving progressively higher as Tapestry advances. The lower forecast boundary has risen dramatically alongside price, while the upper boundary continues migrating upward toward the mid-$160 area.
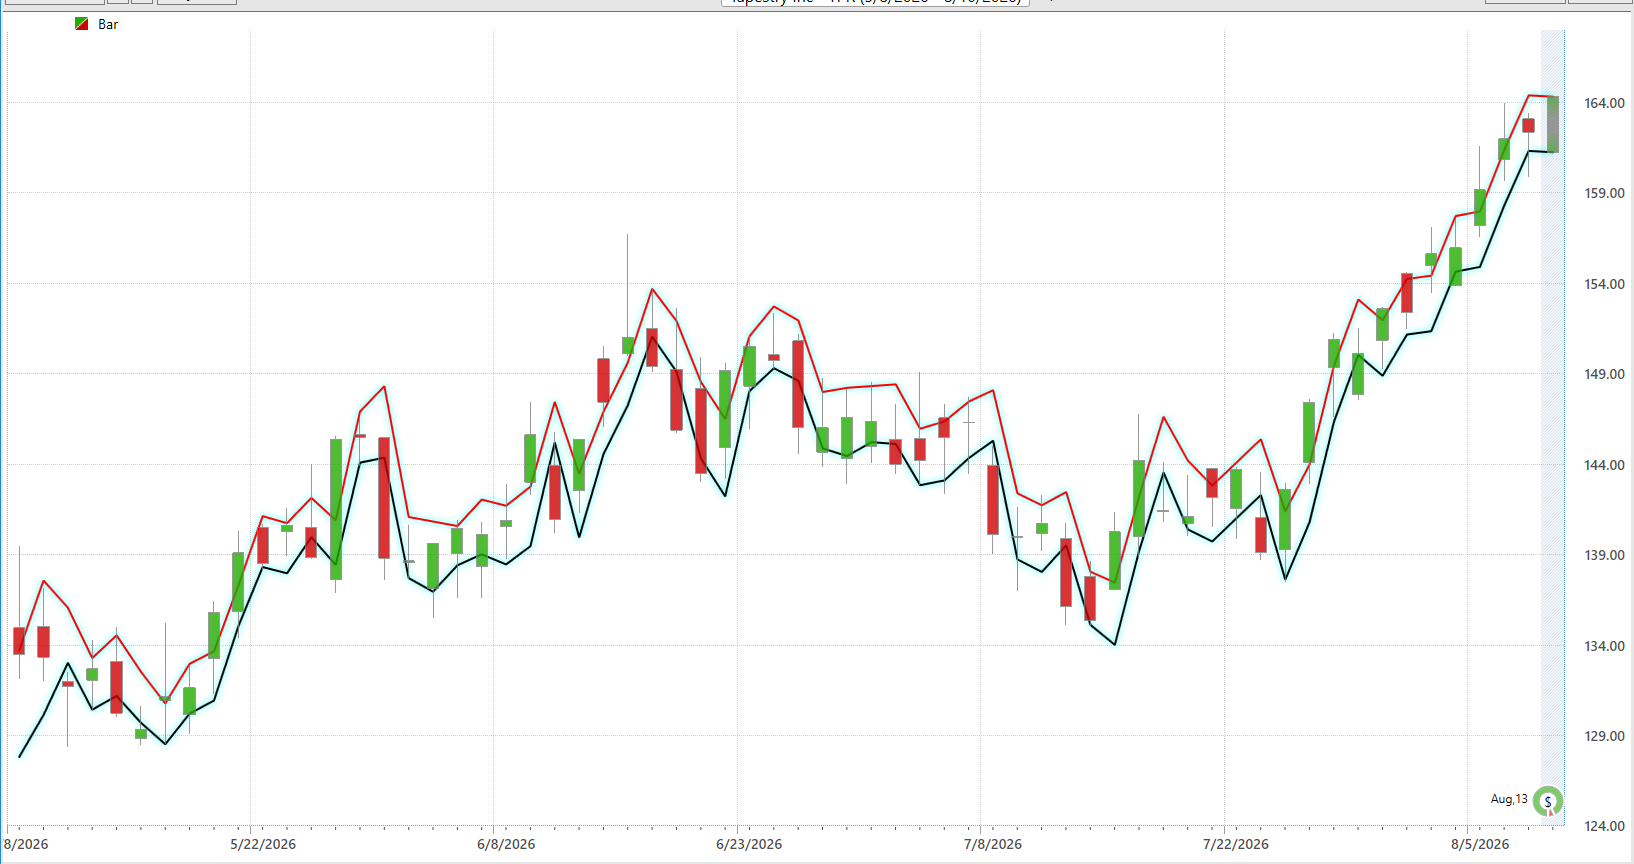
This matters because being bullish does not automatically make every price a good entry. A trader purchasing near the forecast high is assuming considerably more immediate risk than a trader patiently entering near the lower portion of the predicted range. The Daily Range Forecast converts a directional opinion into an execution framework.
The lesson here is straightforward. The trend remains bullish, but $TPR is trading near the upper reaches of both its daily and annual ranges. That argues for selectivity rather than chasing. Traders should use pullbacks toward the lower forecast boundary and Predictive Blue Line to evaluate risk/reward instead of assuming they must participate at any price.
Our Suggestion
The evidence across these graphics is unusually consistent. Tapestry is trading near its 52-week high, relative strength has reaccelerated, the Predictive Blue Line is rising, the Neural Index is positive, and the Daily Range Forecast continues migrating higher. Fundamentally, the picture confirms the technical strength rather than contradicting it. Through the first nine months of fiscal 2026, revenue reached $6.13 billion and adjusted net income reached approximately $1.21 billion, while management raised its full-year revenue and EPS outlook.
Management’s performance over the last two reported quarters deserves attention. In fiscal Q2, management reported EPS of $2.69, up 34%, and said results exceeded its own guidance. The company also increased planned fiscal-year shareholder returns to approximately $1.5 billion. It has repeatedly delivered above its prior expectations and then raised the bar.
There is one complication traders should keep front and center. The stock is no longer cheap in terms of its position on the chart. At roughly the 99th percentile of its annual range, $TPR has already traveled a very long distance. And the Worst-Case Analysis demonstrates that 13% to 21% corrections are entirely consistent with this stock’s history. The bullish thesis therefore should not be interpreted as permission to chase.
The better approach is to let the indicators do their jobs. Watch the Predictive Blue Line for trend, the Neural Index for short-term confirmation, and the Daily Range Forecast for entry location. As long as the Predictive Blue Line continues climbing, the Neural Index remains supportive and relative strength stays positive, the evidence favors the bulls. A meaningful rollover in the Blue Line accompanied by deterioration in the Neural Index and relative strength would tell us that conditions have changed.
Finally, there is an immediate fundamental catalyst. Tapestry is scheduled to report fiscal Q4 and full-year 2026 earnings on Thursday, August 13 at 8:00 a.m. ET. The stock enters that event with extraordinary momentum and management credibility, but earnings can instantly reset expectations.
The central takeaway is simple: $TPR currently looks and behaves like a market leader. The opportunity is real, but so is the volatility. Traders should not ask whether Tapestry is bullish. The evidence says it is. The more useful question is where can you participate in that bullish trend while keeping the risk under control?
Ready to learn more about forecasting stocks and options days before anyone else with up to 87.4% proven accuracy? Attend a FREE LIVE CLASS.
It’s not magic.
It’s machine learning.
THERE IS A SUBSTANTIAL RISK OF LOSS ASSOCIATED WITH TRADING. ONLY RISK CAPITAL SHOULD BE USED TO TRADE. TRADING STOCKS, FUTURES, OPTIONS, FOREX, AND ETFs IS NOT SUITABLE FOR EVERYONE.IMPORTANT NOTICE!
DISCLAIMER: STOCKS, FUTURES, OPTIONS, ETFs AND CURRENCY TRADING ALL HAVE LARGE POTENTIAL REWARDS, BUT THEY ALSO HAVE LARGE POTENTIAL RISK. YOU MUST BE AWARE OF THE RISKS AND BE WILLING TO ACCEPT THEM IN ORDER TO INVEST IN THESE MARKETS. DON’T TRADE WITH MONEY YOU CAN’T AFFORD TO LOSE. THIS ARTICLE AND WEBSITE IS NEITHER A SOLICITATION NOR AN OFFER TO BUY/SELL FUTURES, OPTIONS, STOCKS, OR CURRENCIES. NO REPRESENTATION IS BEING MADE THAT ANY ACCOUNT WILL OR IS LIKELY TO ACHIEVE PROFITS OR LOSSES SIMILAR TO THOSE DISCUSSED ON THIS ARTICLE OR WEBSITE. THE PAST PERFORMANCE OF ANY TRADING SYSTEM OR METHODOLOGY IS NOT NECESSARILY INDICATIVE OF FUTURE RESULTS. CFTC RULE 4.41 – HYPOTHETICAL OR SIMULATED PERFORMANCE RESULTS HAVE CERTAIN LIMITATIONS. UNLIKE AN ACTUAL PERFORMANCE RECORD, SIMULATED RESULTS DO NOT REPRESENT ACTUAL TRADING. ALSO, SINCE THE TRADES HAVE NOT BEEN EXECUTED, THE RESULTS MAY HAVE UNDER-OR-OVER COMPENSATED FOR THE IMPACT, IF ANY, OF CERTAIN MARKET FACTORS, SUCH AS LACK OF LIQUIDITY. SIMULATED TRADING PROGRAMS IN GENERAL ARE ALSO SUBJECT TO THE FACT THAT THEY ARE DESIGNED WITH THE BENEFIT OF HINDSIGHT. NO REPRESENTATION IS BEING MADE THAT ANY ACCOUNT WILL OR IS LIKELY TO ACHIEVE PROFIT OR LOSSES SIMILAR TO THOSE SHOWN.