


Register for a Free Live Training
The Hot Stocks Outlook uses VantagePoint’s market forecasts that are up to 87.4% accurate, demonstrating how traders can improve their timing and direction. In this week’s video, VantagePoint Software reviews forecasts for Arista Networks ($ANET), Crown Castle International ($CCI), Chewy ($CHWY), Under Armour ($UA), Wolverine Worldwide ($WWW) and Digital Realty Trust ($DLR)
Hello again, traders, and welcome back to the Hot Stocks Outlook for November 5th, 2021. Hope y’all are having an excellent week out there in the financial markets and as always, plenty to cover here today in the outlook.
Now we’re going to start out with shares of Arista Networks. We’ve also got Crown Castle, Under Armour, Wolverine Worldwide, Digital Realty Trust, and lastly, we’ll look at Chewy here, which we looked at over the past couple weeks now. But starting out here with shares of Arista, and this is a really good example of what’s going on in the broader market, but how these tools can really help you get ahead of these big market turns. So what we have with Arista Networks is daily price action. Each one of these candles represents a full and complete trading day, and right up against that price data, you see that there is a black line and also a blue line there.
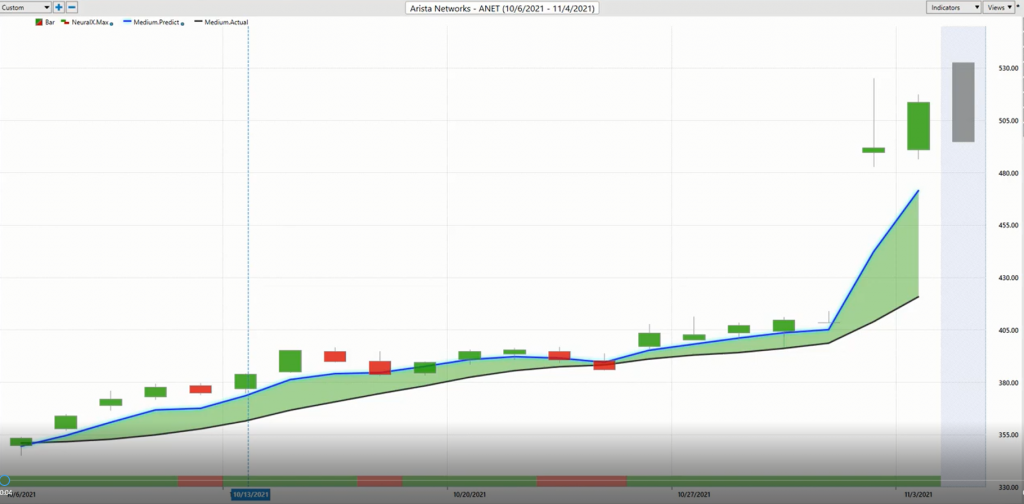
Now the black line that you’re seeing that is a simple moving average. So a very common technical indicator. What it does is it look back over the previous 10 close prices, adds them all together, divides it by 10, and it acts as a really good indicator to smooth out the existing price action and let us as traders know where the market price has been. But obviously, traders need to know where market price is going next. And to do that, what we’re able to do is compare that black line or what we refer to as the lagging simple moving average, and we compare it to this blue value that’s generated via VantagePoint’s artificial neural network technology. So to explain a little about what’s happening there is rather than just looking at past prices of Arista Networks like traditional technical analysis, VantagePoint’s artificial neural networks have determined very important market relationships that are known to drive this specific market Arista. So what we call the target market in this case.
So what it’s able to do is understand how things like the S&P 500, the NASDAQ, individual stocks, individual ETF markets, global currencies, global interest rates, futures, commodity prices, all drive and influence the future price of this target market stock, in this case, Arista. And it takes that information and actually generates a true price prediction on where things are headed going next. And it takes that prediction and actually uses that to construct extremely accurate predictive indicators that are actually forward-looking. So whenever we have that blue line crossing above the black line, suggesting average prices are going to start moving up. You’d want to therefore look to take long positions in the market, but there’s so many ways that we can apply this neural network technology to let us know when the trend shifts.
At the very bottom of the chart, you’ll see this bar that goes from green to red, back to green. This is tuned to look ahead for very short-term strength or weakness in the market. It’s only tuned to look ahead 48 hours at a time and has an extremely high level of accuracy associated with that. Now, we also have a predicted high and a predicted low that’s generated each and every trading day to help traders manage these really nice swings that we’ve had in the market. And this has been very important is we’ve seen the market move higher. The software, through its use of things like the Intelliscan, actually allow us to see a lot of these big pivots that take place because we’re able to see these market shifts with the help of that predictive artificial neural network technology. So we recognize that, “Hey, there’s a lot of strength coming into the market here in the beginning mid-October and therefore, we want to use this scanning tool to look for fresh opportunities to go ahead and get along the market.”
And that has been a very wise thing to do because it has made the most sense to buy the market, take profit on those long positions.
Crown Castle International ($CCI)
So we’ll move over here, we got Crown Castle. It’s a really good example of how you’re just seeing all of these predictive indicators get very bullish over the past several weeks in stocks. We have things like Chewy here, which we’ve talked about over the past couple weeks now and have just continued and continued to move higher. But here’s Crown Castle, you see in 10, 20, getting a very strong crossover to the upside. You see your neural index at the bottom of the chart. This again is very short-term forecasting. So it’s looking ahead just 48 hours, strength or weakness. You see here that it does get bearish and you run a little bit of sideways here.
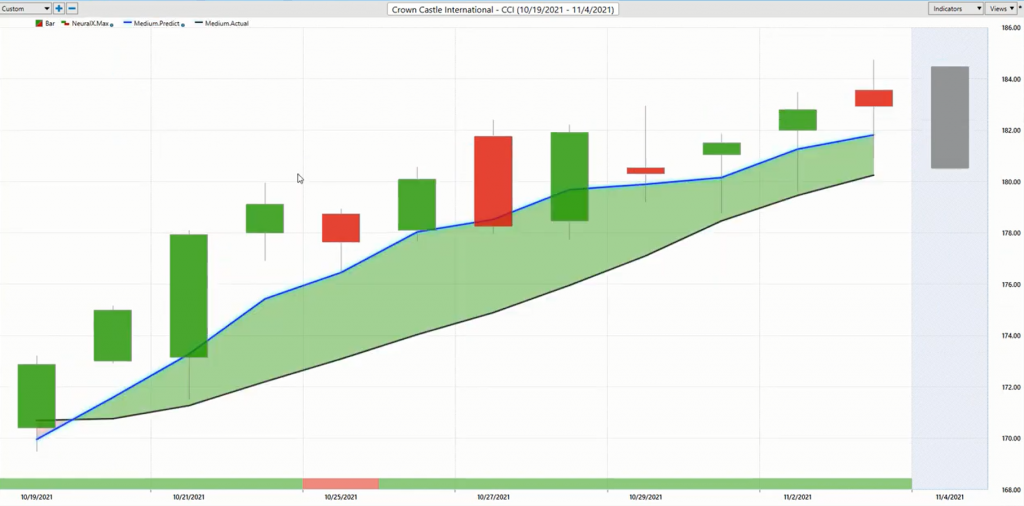
You see, you do have some lower lows setting in over the next few days, but very quickly, the next trading day, it gets bullish, stays bullish, and the resumption of that trend. Now on a daily basis, traders also have a predicted high and a predicted low candle. And again, it’s utilizing that neural network technology not to look at future average prices like the predicted moving average, not to look at that 48-hour timeframe like the neural index, but to look for intraday levels of where price is expected to move on the high and low side. And what we can do is actually look back and see how accurate all of those predictions are against the actual trading day. So here’s today’s prediction of a high and low, but we can see what the prediction was, and then we get the reality of the candle to fill in.
So you see that when you recognize, “Look, the market’s in an uptrend, I want to go ahead and get long.” It’s not just about recognizing that crossover, but having the tools that every single day are going to indicate to you, “Look, if you want to be a buyer in this market, you should buy down at these predicted lows. If you’re a short-term trader, maybe look to take profit up at the predicted highs. If you’re a trend trader and the blue line is still above the black line and the trend looks to still be up, well, maybe you should maintain that position.” You can always take some of your profits along the way, buy more of that position down at predicted lows, but you see this market’s moved up about 6%, but many of opportunities to buy at those predicted lows take profit as that market moves higher and benefit off of this broad market strength, which VantagePoint’s done an extremely good job of highlighting here for traders.
Here we have on 10, 21, this crossover to the upside here in shares of Under Armour. And this is really helpful as well is actually, here we have earnings and you see that acts as a really big catalyst to propel the market higher. But when you have a tool like VantagePoint, it’s often going to do a really great job of potentially getting you in the market well before those earnings, but also getting a very good cushion going into that, what we might call a volatility catalyst, right, is no one can predict the earnings or what the number is necessarily going to be. VantagePoint looks at those daily intermarket relationships to make determinations and consistently gets that very right. But you have things like fed announcements, earnings reports, these things you want to be aware of, but oftentimes these things really work in your favor where you see you get an entry down below 21.
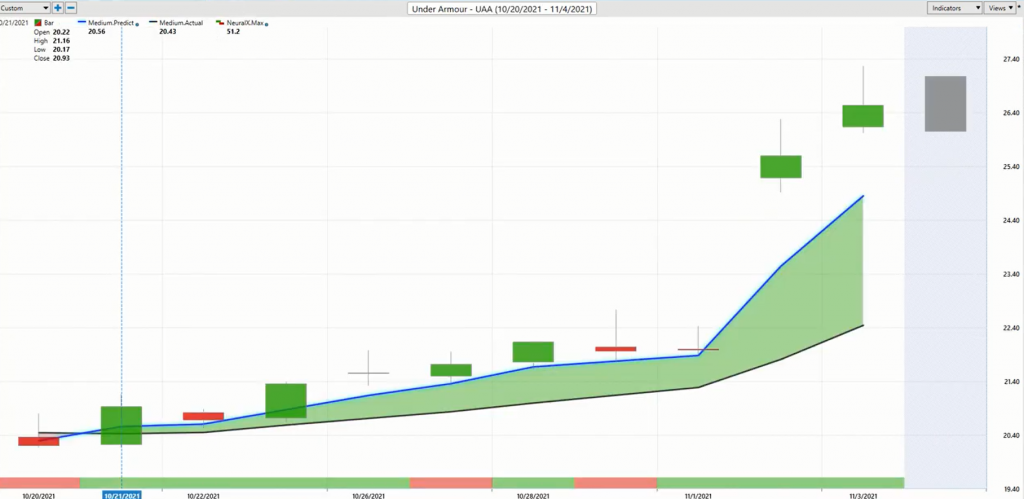
And if this thing tanks after earnings, well, you probably break even on a trade, but if it propels higher, you really stand to make a lot of money and have a very large asymmetry as far as those gains versus those losses in the trading account. So you see here again, a very nice move here about 29% rally, just in the last nine trading days. And you’ve seen that a lot of market strength, these earnings come in, and a lot of these things pop in higher.
Here’s Wolverine Worldwide. These charts look the same because this is how the markets play out. When you have this big shift in the S&P 500 and you’re using tools like VantagePoint’s Intelliscan, it’s going to help you recognize that shift. And then it makes it very easy to say, “Okay, well, now here’s maybe an individual stock that I want to trade. How should I look to go ahead and actually trade that?”
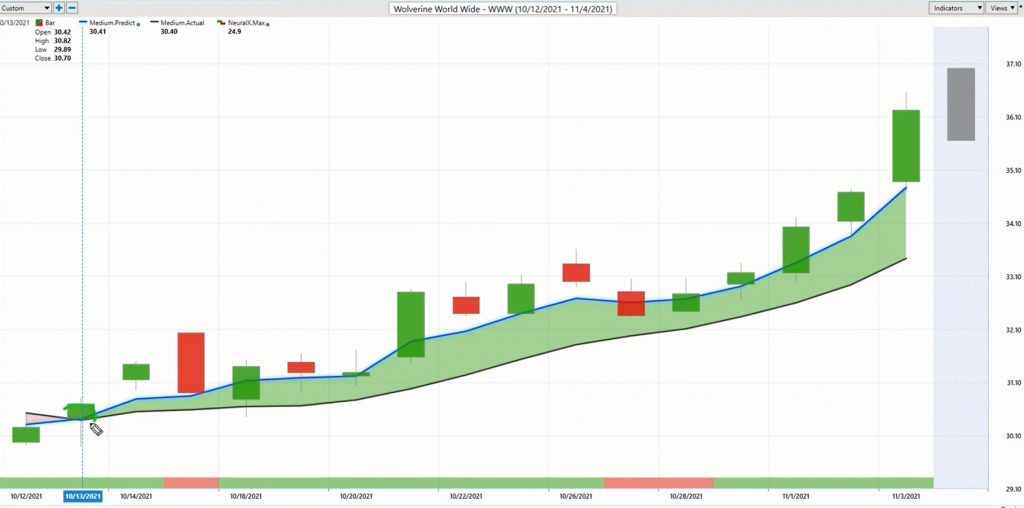
You see neural index gets bearish here, you see some lower lows, little bit of a dip here, but the duration of this forecast is extremely bullish. So all one would really be doing is, look towards predicted lows would make the most sense as far as intraday prices to accept good discounts on price. You see about four entries at the predicted low doesn’t mean you can’t just take an entry from your crossover knowing that, okay, well now your crossover’s come through, let’s start managing this. But a very, very nice move here, but a move that’s very similar to many of the opportunities that we’ve seen. You see a 19% rally here in about 16 trading days.
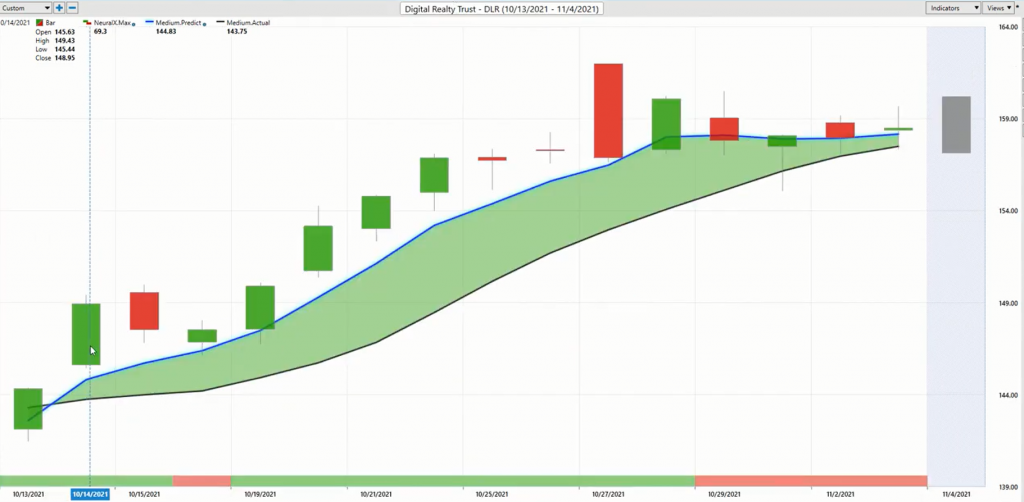
Digital Realty Trust. So a little bit slower moving, but again, those predicted highs and lows doing a really great job here. You see the neural index getting bearish. Things running a little sideways here, and you can do a good job that, buying some here, taking some profit up at the high end and really reducing that risk and exposure to the market. And if it continues to trend and break out, well, great, we’ve seen that that has played out really well in a lot of markets and specifically here Chewy.
So we actually brought this through really before these pops even here, because we see a lot of this strength coming into the market. Very strong forecast as far as your blue line over the black line, neural index very bullish. You see that you get that neural index bearish here, and you get a little bit of a weakness here, but then again, today, driving higher and things looking pretty good here once again.
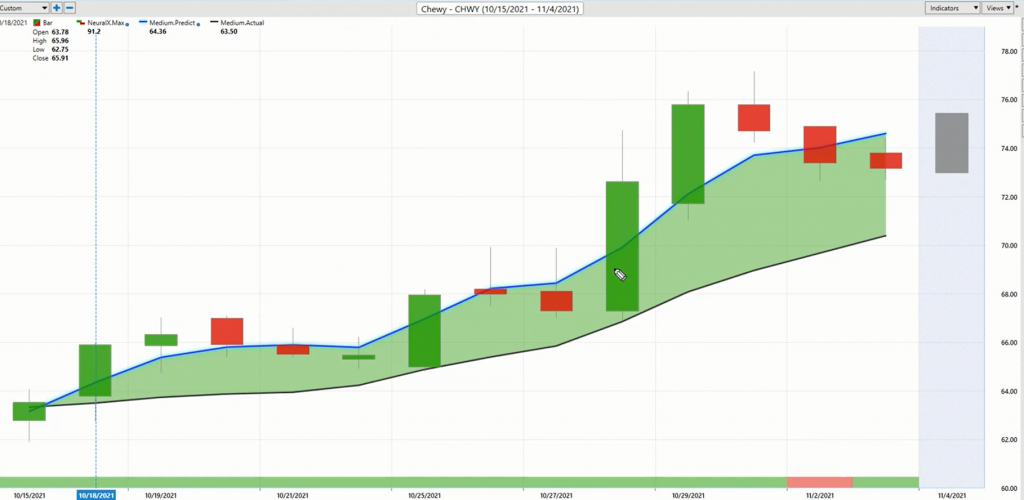
But it’s all about, not necessarily recognizing that, “Okay. Well, yes, sir, it makes sense to get into the market back here and potentially hold that position,” but it’s really the trade management here, right? So you’ve got all these opportunities here where it says, “Okay, well, if you want to get in a position here, look to try to buy down here.” And you get a really nice entry to benefit as that market and volatility expands and things really start to accelerate to the upside. So again, I don’t know where we’re necessarily at here. We’re not that far up. We’re only maybe about 75, 76 or so, but still, about an 18% rally here in the past 13 trading days and very similar to many of these opportunities that we’ve seen.
So it just gets to this point of, if you want to make money in the markets and you don’t recognize this shift that occurred back here in October, which if we’re looking at any of these markets, Arista here, really highlights that whole shift that we saw as far as the S&P and the indexes and stocks starting to move higher and VantagePoint indicating that, “Look, that’s the way you want to go.” This looks like the way the bigger narrative has played out on the broader markets and S&P, but also these individual stocks just keep guiding you that, “Look day after day here, let’s look to do some trade management, buy, take profits on longs and that’s about it.” So we’ll go ahead, leave it there for this week. Once again, this has been our Hot Stocks Outlook for November 5th, 2021. Thank you all for watching, best of luck out there. Thanks again, and bye for now.


