One of the best things you can do as a trader and investor is study who is winning. This will often provide tell-tale clues to developing an understanding of the macroeconomic forces in the world that are sometimes not visible through traditional means. As a traders, we should look and price assets outside of a dollar denominated lens to be able to see the world differently.
For example… What county over the past year has had the fastest growing stock market in the world?
Over the Past 12 months the United States has seen roughly a 50% increase. This is about 41% higher than normal.
Germany has seen a 45% increase in their stock index.
How about China? The Shanghai Composite Index has done well, growing by over 25% in the last 12 months, which is about 20% higher than its normal year.
What about Japan? They’ve seen their stock market grow by about 50% over the last 12 months, which is about 45% higher than normal.
Britain is up 22%…
Brazil is up 45%…
Despite all of these countries having record breaking growth in their own stock markets, they all pale in comparison to that of Zimbabwe.
You see, if you had invested in the Zimbabwe Industrial index 12 months ago, you would have seen a return, of an astounding 481%.
Now, don’t rush out to invest in the Zimbabwe Stock Index. Instead, I’m sharing this reality so you can ask yourself how this may have occurred? How is it that a tiny country in Africa has massively outperformed the top tech companies in the world? Why is the Zimbabwe stock market doing so much better than Facebook, Apple, Amazon, Netflix, Nvidia, Tesla, and Google?

As you can see, Zimbabwe has crushed the returns available from anywhere else in the world. If you are serious about trading and investing this should arouse your curiosity to a very large extent. When we dig in to understanding the scene in Zimbabwe it can provide a macro framework for us to decide what might be the key drivers of that stock market which will certainly affect the decisions we will be making in our own portfolios.
One of the unfortunate things Zimbabwe is known for is that 13 years ago the country went through one of the worst hyperinflations in history. They experienced a peak inflation of 89.7 sextillion per cent per year. The worst of the inflation occurred in 2008, leading to the abandonment of the currency. The peak month of hyperinflation occurred in mid-November 2008 with a rate estimated at 79,600,000,000% per month. This resulted in one US$1 becoming equivalent to Z$2,621,984,228. You can imagine how this decimated the countries economy and the scars it left upon its citizens.
In 2009 the country adopted a new currency, and within a few years the country seemed to be healing from its economic nightmare. For the next 4 years, Zimbabwe averaged 15% GDP growth per year, which was then followed by a much slower growth rate of about 3% per year up until 2018. In 2019, Zimbabwe entered a recession after a horrible drought and ensuing famine hit the country. The government attempting to reform its currency once again made the decision that it would do whatever was necessary to support the new currency and the economy. So, the Zimbabwe authorities decided to use a tactic that it thought would help keep asset prices afloat and prevent a complete economic collapse.
They decided to print more money.
In fact, by January of 2020, 70% of Zimbabwe’s dollars had been created within only the previous 12 months. This new injection of currency did keep Zimbabwe’s markets afloat, but what it really did was devalue the currency. As I have previously mentioned in my articles over the past year, that price is simply a ratio of exchange. Whenever we see prices increase, we must ask ourselves is the asset we are measuring becoming more valuable, or is the metric that we are measuring it through being devalued? In Zimbabwe clearly the currency was being devalued once again.
Just a few months later, the COVID-19 pandemic hit and forced Zimbabwe to create even more currency to prevent the collapse of its economy. As of today, more than 93% of all dollars in Zimbabwe, were created within the only the last 24 months. The result is painfully obvious to understand. The currency in Zimbabwe was massively devalued, which artificially sent prices of everything to insanely high levels.
The reason why Zimbabwe’s stock market has skyrocketed in the last year has not been because the prowess of Zimbabwe’s companies or that the economy has been doing well, but simply because the government chose to artificially devalue its own currency, in order to prevent a market collapse. The gains seen in Zimbabwe’s stock market are just from the massive increasing of the money supply.
The citizens of Zimbabwe, having experienced one of the worst hyperinflations in history, noticing that their government was printing money again poured all of their liquid assets into the Zimbabwe stock market as a hedge against the loss of purchasing power which they knew would result from staying in cash. Famed Hedge Fund Manager, Ray Dalio has coined the phrase “cash is trash” to describe the phenomenon of loss of purchasing power by staying in cash.
The Zimbawean story has many important truths for the rest of the world to consider and understand. The first is they learned and studied monetary supply expansion directly from observing what the United States has done since the 1987 Stock Market Crash.
Alan Greenspan was chairman of the Federal Reserve from 1987 to 2006. Throughout his tenure, he sought to support the U.S. economy by actively using the federal funds rate and other policies in the Fed’s arsenal to buoy the American stock markets. You can read more about this practice by looking up the term “the Greenspan Put” on Google. Instead of allowing the marketplace to find an equilibrium point which may have taken a very long time, Greenspan chose to manage the economy by reducing interest rates and expanding the monetary supply. Every stock market correction that occurred during his tenure and thereafter, the policy response was to lower interest rates and increase the monetary supply. Greenspan was trying to instill investor confidence by supporting big banks and institutions.
Greenspan cultivated a market belief that the Fed will step in and implement policies to limit the stock market’s decline beyond a certain threshold. During Greenspan’s tenure, it was widely believed that a stock market decline of over 20%, which typically denotes a bear market, would prompt the Fed to lower the fed funds rate again and again. This was seen as insurance and allayed the fears of investors that a protracted, and costly, market decline would occur.
The consequence of Greenspan’s policies was that investors were more prone to reckless and excessive risk-taking in stock markets, leading to market bubbles, which, resulted in even more market volatility. Experienced investors, needing to buy protection from the excessive market valuations, resorted to the time-tested trading strategy of buying put options to protect their portfolios from excessive market declines precipitated by the inevitable bursting of these market bubbles. But unknowingly what this also did was signal to the banks and the population at large, that any sort of downturn in an economy or market was bad, and that we should only see perpetual growth forever.
For example, as internet stocks fell in the dotcom bust from 2000 to 2002, some investors profited mightily by deploying this strategy. In practice, the idea might have advocated the notion that if you bought an internet stock, and then it dramatically rose in price over a few months, then, to preserve your gains, you would buy a put option with several months’ duration to protect those shares.
However, the moniker Greenspan put is the generalized notion of a commitment, that has never been officially confirmed, that the Greenspan-led Fed would be extremely proactive in halting excessive stock market declines. This policy was then furthered by Greenspans successors Ben Bernanke, Janet Yellen and Jerome Powell. With every stock market decline the official policy response was to lower interest rates further and increase the money supply.
If you look at any American Stock Index chart over the last 34 years, you can easily conclude that the official policy response from the Fed was always the same. Lower Interest rates and inject more money into the financial system.

While this table might seem very basic and elementary to an experienced trader or investor it takes on new meaning today because of recent Fed actions and behaviors.
Within the past few weeks, the Fed has decided that it will no longer report M2 money supply statistics! (Imagine a publicly traded company no longer reporting earnings!)
Most traders and investors have monitored Fed policy and behavior to determine if they were increasing or decreasing the monetary base. This will no longer be possible.
Millions rely on this basic data point to decide what type of economic environment we are in.
What is the rationale for doing this?
Are they going to act like the adults at the party and remove the punch bowl and hope no one notices? Or are they going to hyperinflate currency into oblivion and need complete privacy to do so? These are fair questions and answers are few and far between.
The Fed has put 40% of new money into circulation over the last 18 months. This is less than what occurred in Zimbabwe but since the United States is the Reserve Currency of the world it is potentially problematic. The American stock indexes are up slightly more than that 40% in the same time frame. Coincidence?
In the past you could see year over year growth of the money supply and decide if the Money Supply was increasing or decreasing like in the chart below.

Today, if you click on the following link, you go to the St. Louis Fed website to track the m2 Money supply and receive the following announcement.

In other words – “Dear investors and traders please don’t worry about the pesky purchasing power of your dollars. We got this. You are in good hands with FedSpeak.”
I have more questions than answers, but I find this development to be terrifying in more ways than one. The world’s most powerful monetary authority has decided that it does not and will not disclose its actions!
Transparency is a thing of the past.
What could go wrong?
The Fed which has never been audited and has only Congressional oversight seems to conclude that transparency is a nuisance. Since everybody is hyper focused on the Money Supply and that focus has led to a completely artificial stimulus dependent economy, we have to now trust that they have the answer.
What does all this have to do with you?
Well, we are seeing valuations in the stocks market that have never occurred before. Let me put it this way, GDP would have to double overnight in the United States just for us to return to slightly overbought levels. In recent articles, I have referenced the Warren Buffett indicator which measures Market Capitalization by the GDP of the United States. Here is the chart:
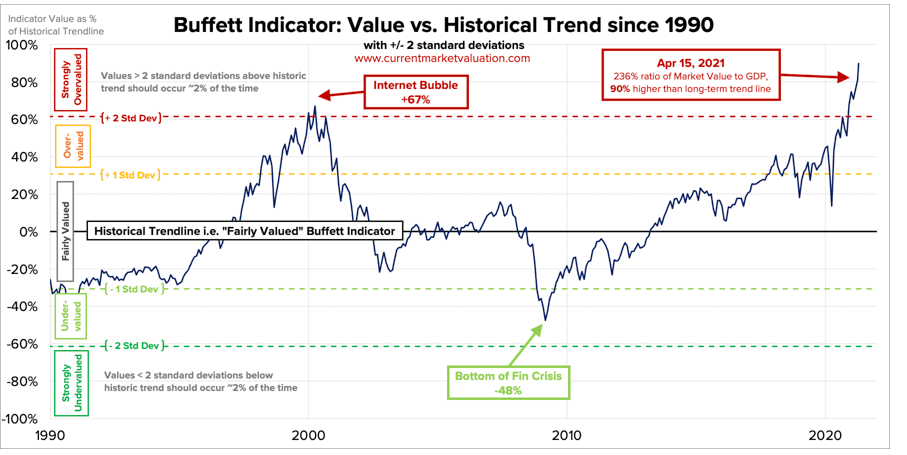
We are over 70% higher than the peaks that we experienced at the very height of the dotcom bubble.
Can we go higher? Sure, if the Fed runs the printing press!
Do you think monitoring money supply figures are important now? The only way these valuations can be maintained is if the Fed continues to devalue the currency. Will they?
Be prepared for volatility that is unlike anything the markets have ever experienced. Since we do not have Money Supply figure to rely upon any further, how are you going to make sense of what to do? What tools are you using to determine where to place your money?
What happened in Zimbabwe should alert you that when prices go up the value of your currency just might be going down!
How are you going to make your trading decisions in this environment?
As a trader the risk is very clearly defined by recognizing that your knowledge will always be limited by what you see and hear and understand.
This is why neural networks, machine learning, and artificial intelligence are a necessity for today’s trader. When what “SHOULD” happen aligns with what “IS” happening some pretty explosive outcomes can occur and that is where you want to be as a trader. That is the promise of A.I. can make to you today.
The challenge of trading is the organization of information so that effective decision making can occur? How good have your decisions been over the past year? How do you think your trading decisions compare to A.I.?
Mistakes are problematic for humans but for machine learning, it is the pathway to mastery and excellence. The real education in trading always lies in learning from the losers and completely understanding why something doesn’t work. More importantly, as a trader you want to focus your hard earned savings on what is proven to work.
Most humans have a really hard time learning from bad experiences. The ego gets in the way, each and every time.
Knowledge. Useful knowledge. And its application is what A.I. delivers.
Artificial intelligence is not “a would be nice to have” tool.
It is an “absolutely must have” tool to flourish in today’s global markets.
The beauty of artificial intelligence is that it looks at these global correlations for each asset statistically to uncover the best opportunities and trends.
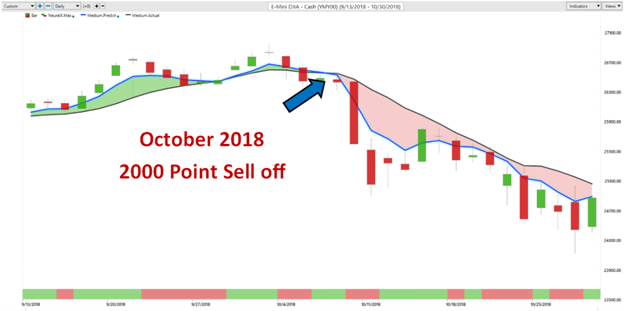
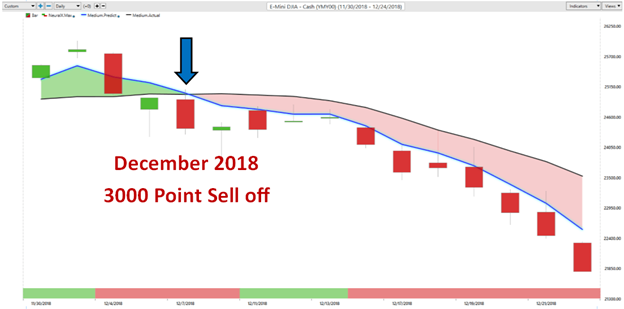
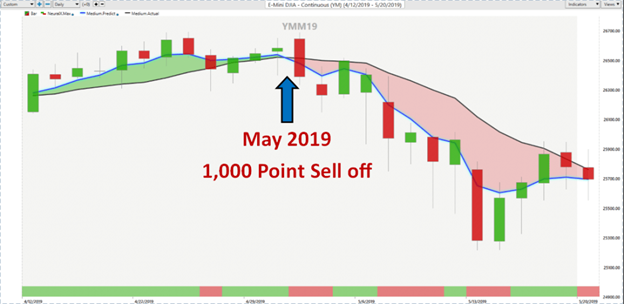
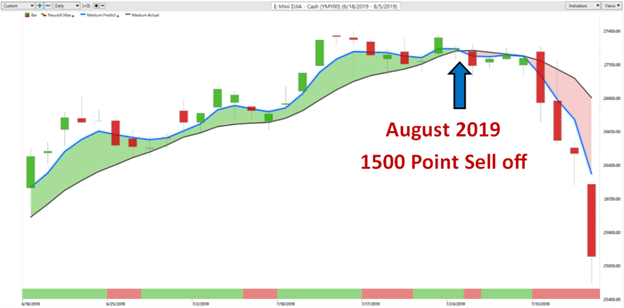
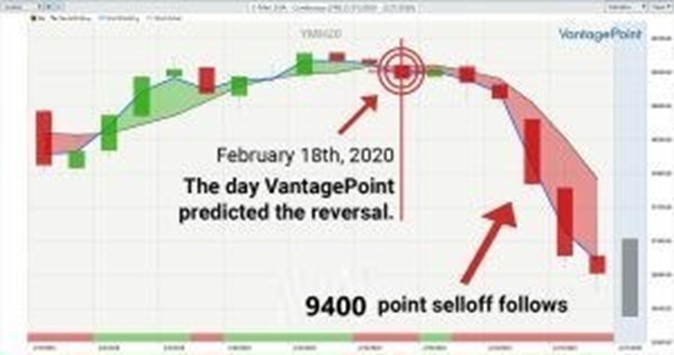
Here are the massive stock market selloffs that have occurred in the past three years and the Vantagepoint Artificial Intelligence forecasts.
Over the coming weeks, you can rest assured that Vantagepoint Power Traders will continue to build wealth one trend at a time, even in these volatile conditions.
I invite you to check it out at our Next Live Training.
It’s not magic. It’s machine learning.
Make it count.
THERE IS SUBSTANTIAL RISK OF LOSS ASSOCIATED WITH TRADING. ONLY RISK CAPITAL SHOULD BE USED TO TRADE. TRADING STOCKS, FUTURES, OPTIONS, FOREX, AND ETFs IS NOT SUITABLE FOR EVERYONE.IMPORTANT NOTICE!
DISCLAIMER: STOCKS, FUTURES, OPTIONS, ETFs AND CURRENCY TRADING ALL HAVE LARGE POTENTIAL REWARDS, BUT THEY ALSO HAVE LARGE POTENTIAL RISK. YOU MUST BE AWARE OF THE RISKS AND BE WILLING TO ACCEPT THEM IN ORDER TO INVEST IN THESE MARKETS. DON’T TRADE WITH MONEY YOU CAN’T AFFORD TO LOSE. THIS ARTICLE AND WEBSITE IS NEITHER A SOLICITATION NOR AN OFFER TO BUY/SELL FUTURES, OPTIONS, STOCKS, OR CURRENCIES. NO REPRESENTATION IS BEING MADE THAT ANY ACCOUNT WILL OR IS LIKELY TO ACHIEVE PROFITS OR LOSSES SIMILAR TO THOSE DISCUSSED ON THIS ARTICLE OR WEBSITE. THE PAST PERFORMANCE OF ANY TRADING SYSTEM OR METHODOLOGY IS NOT NECESSARILY INDICATIVE OF FUTURE RESULTS. CFTC RULE 4.41 – HYPOTHETICAL OR SIMULATED PERFORMANCE RESULTS HAVE CERTAIN LIMITATIONS. UNLIKE AN ACTUAL PERFORMANCE RECORD, SIMULATED RESULTS DO NOT REPRESENT ACTUAL TRADING. ALSO, SINCE THE TRADES HAVE NOT BEEN EXECUTED, THE RESULTS MAY HAVE UNDER-OR-OVER COMPENSATED FOR THE IMPACT, IF ANY, OF CERTAIN MARKET FACTORS, SUCH AS LACK OF LIQUIDITY. SIMULATED TRADING PROGRAMS IN GENERAL ARE ALSO SUBJECT TO THE FACT THAT THEY ARE DESIGNED WITH THE BENEFIT OF HINDSIGHT. NO REPRESENTATION IS BEING MADE THAT ANY ACCOUNT WILL OR IS LIKELY TO ACHIEVE PROFIT OR LOSSES SIMILAR TO THOSE SHOWN.