



This week’s AI stock spotlight is Apple Corporation
Apple has spent half a century proving that the shortest distance between “everyone says it’s over” and “new all-time highs” is one earnings report. The company began in a California garage in 1976 with two Steves and a dream that computers shouldn’t require an engineering degree. It evolved from a quirky computer maker into the world’s most profitable consumer technology company. Along the way it reinvented portable music, smartphones, app distribution, and wearable technology. Today Apple generates well over $450 billion in annual revenue, employs roughly 166,000 people, and sits near the top of the global market capitalization rankings. It still matters because when Apple sneezes, suppliers, chipmakers, software developers, and major stock indexes all reach for a tissue.
Apple is often described as a hardware company, but that misses the real story. Hardware gets customers through the front door. Services convince them to stay forever. The iPhone remains the company’s largest source of revenue and the center of its ecosystem. Surrounding it are Macs, iPads, Apple Watch, AirPods, Apple TV, Vision products, and a growing collection of subscription businesses that quietly collect money every month without asking permission.
That ecosystem has become Apple’s economic moat. Customers buy an iPhone, then an Apple Watch, then AirPods, then cloud storage, then Apple Music, then AppleCare. Before long they discover that leaving Apple would require replacing half the electronics in their home. That is not merely customer loyalty. That is customer inertia, one of the most valuable assets any company can own.
Apple is headquartered in Cupertino, California. The company is currently led by Tim Cook, with John Ternus scheduled to assume the CEO role on September 1. Its largest competitors include Samsung, Microsoft, Alphabet, Amazon, Meta, and a long list of Android device manufacturers. Yet Apple’s competitive advantage has never been about building the cheapest products or even the most advanced technology. It has been about building products people actually enjoy using while convincing them that switching brands feels about as appealing as moving to another country because your toaster broke.
Apple’s financial statements resemble what happens when accountants are allowed to write fairy tales. Revenue has resumed accelerating after several slower years. Net income is growing even faster than revenue, a sign that management continues squeezing additional profit from every dollar of sales. Gross margins have steadily improved while free cash flow remains among the strongest in corporate America. Apple also continues retiring enormous amounts of stock through share repurchases, allowing earnings per share to grow even faster than total earnings.
The balance sheet often confuses traders because they focus on Apple’s debt while ignoring its cash generation. Yes, Apple carries substantial debt. It also produces operating cash flow so consistently that servicing that debt resembles paying monthly utilities rather than financing a rescue mission. Apple intentionally uses leverage because borrowing often costs less than alternative financing options. It is a strategy available only to companies whose balance sheets inspire lenders to smile instead of sweat.
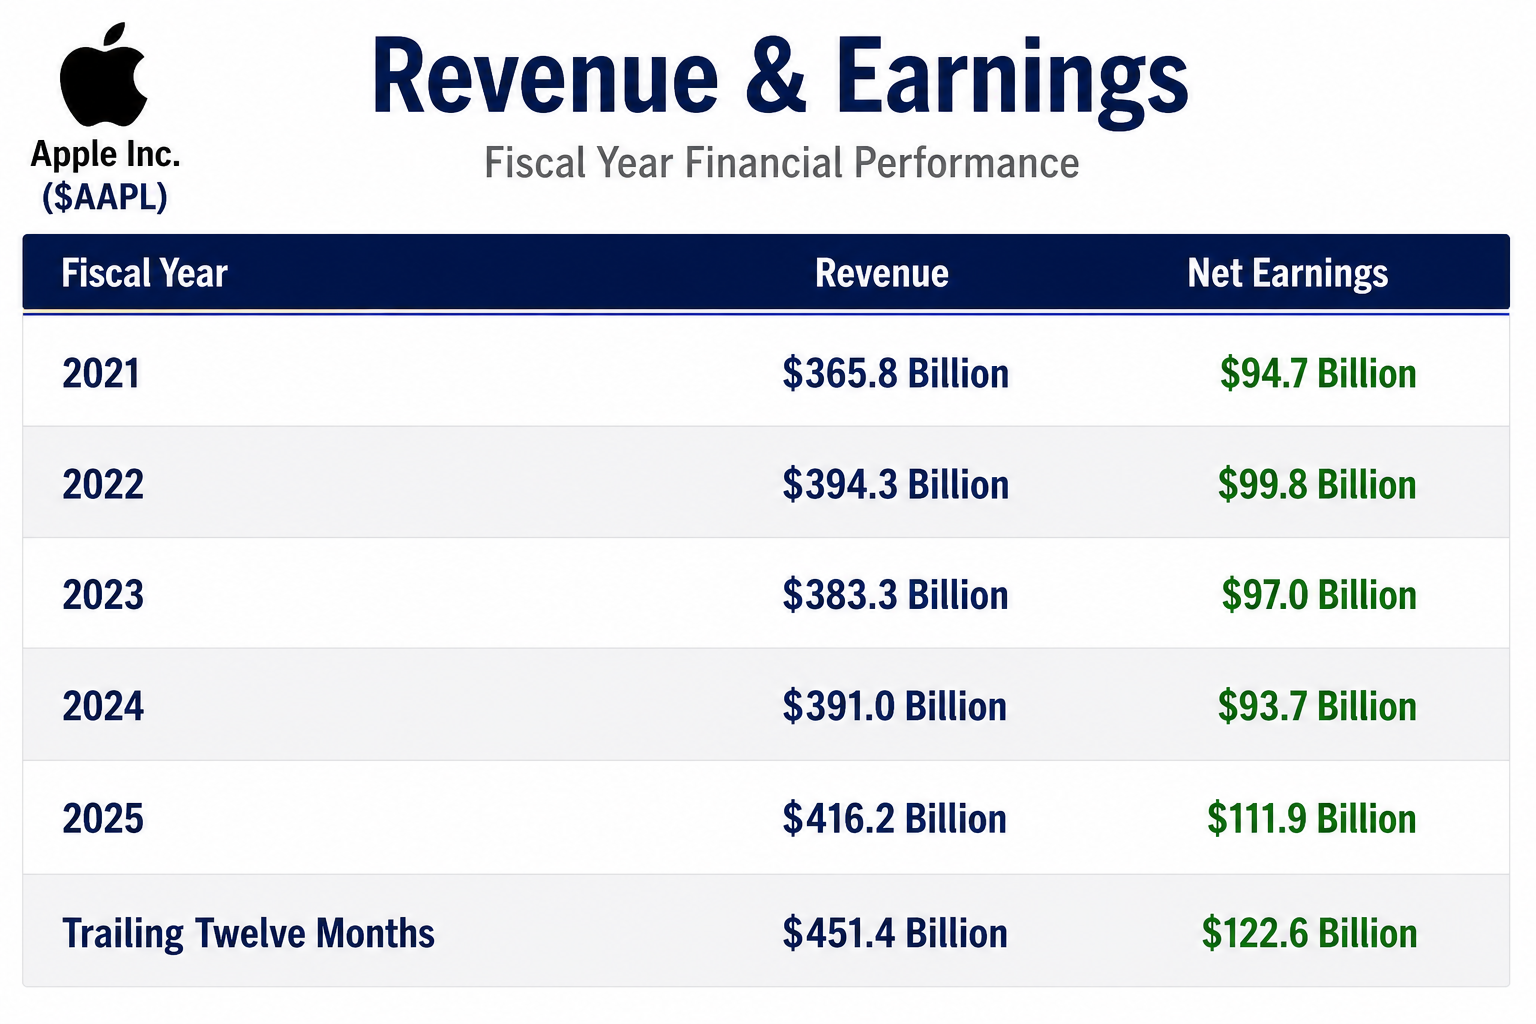
This revenue and earnings table tells traders something far more useful than earnings per share. Revenue briefly flattened before resuming growth. Earnings have accelerated much faster than sales. That combination tells you margins are expanding and management continues becoming more efficient. Markets reward companies that grow profits faster than revenue because it demonstrates pricing power and operational discipline.
Right now traders are obsessed with two questions. The first is whether Apple has finally positioned itself to monetize artificial intelligence without burning hundreds of billions of dollars chasing the latest technology fashion. Investors have watched competitors spend extraordinary amounts building AI infrastructure. Apple largely stayed on the sidelines. What once looked timid increasingly looks patient. The market is beginning to appreciate the difference.
The second question is whether iPhone demand can remain strong enough to justify Apple’s premium valuation. Investors know Services will continue growing. The real uncertainty is whether consumers continue upgrading devices often enough to keep feeding that ecosystem. A healthy upgrade cycle makes almost every other business segment stronger.
During the past thirty days Apple has reached fresh all time highs as investors rotated toward companies producing reliable earnings growth rather than simply promising future AI dominance. Analysts expect another strong quarterly report with double digit revenue and earnings growth. Investors will pay at least as much attention to forward guidance as to the headline numbers themselves because expectations have become extremely optimistic.
Much of the good news is already priced into the stock. Strong Services growth, healthy iPhone demand, disciplined capital spending, and continued buybacks are widely expected. What Wall Street may still underestimate is Apple’s ability to generate additional profit from its installed base without depending entirely on selling more hardware. Every additional subscription sold to an existing customer carries attractive economics.
Where analysts sometimes stumble is assuming every new technology cycle permanently changes Apple’s competitive position. History suggests otherwise. During the past twenty years Apple has supposedly been threatened by cheaper smartphones, cloud computing, streaming media, tablets, artificial intelligence, and countless hardware competitors. Most of those predictions aged about as well as unrefrigerated milk.
Apple has significantly outperformed both the broader market and the Technology Select Sector SPDR ETF over the past ninety days because investors increasingly favor companies delivering earnings today instead of merely promising them tomorrow. Year to date the stock has continued climbing because earnings expectations have risen, margins continue improving, Services remain strong, and management has demonstrated remarkable discipline with capital allocation. The popular narrative says Apple suddenly became an AI company. The actual financial statements suggest Apple simply remained Apple while everyone else became distracted.
The upside case remains compelling. Continued Services expansion, another successful iPhone cycle, disciplined AI integration, and additional share repurchases could easily support higher earnings over the next several years. The biggest positive surprise would be Apple successfully monetizing artificial intelligence features without materially increasing capital expenditures. Investors love nothing more than higher profits without proportionally higher spending.
The risks deserve equal respect. Slower iPhone upgrades, weaker Chinese demand, regulatory pressure on App Store economics, or disappointing guidance could quickly compress the valuation. The single biggest blind spot is believing that great companies cannot become expensive stocks. Every exceptional business eventually encounters a price at which future perfection has already been fully discounted.
The next three catalysts are straightforward. Apple reports fiscal third quarter earnings on July 30, 2026. Investors will immediately shift attention toward September quarter guidance. Finally, John Ternus officially assumes the CEO position on September 1, an event investors will monitor closely for any change in strategic direction.
Apple remains one of the finest stocks for momentum traders and position traders who prefer institutional sponsorship over speculative excitement. The trend remains healthy as long as revenue continues growing, Services continue expanding margins, and management maintains its discipline around spending. Trouble will probably not begin with a frightening headline. It will begin when revenue growth slows, margins stop expanding, and guidance quietly loses its confidence. Stocks rarely collapse because investors suddenly discover bad news. They usually fall because reality stops keeping pace with expectations. Apple has mastered expectations for decades. Traders should simply watch for the first signs that it no longer does.
The following are the indicators and forecasts that we will use in this stock study to better comprehend the price action of $EAT.
Wall Street Analysts Ratings and Forecasts
52-Week High and Low Boundaries
Best-Case / Worst-Case Scenario Analysis
VantagePoint AI Predictive Blue Line
Neural Network Forecast (Machine Learning)
VantagePoint AI Daily Range Forecast
Intermarket Analysis
Our Suggestion
At VantagePoint, every analysis begins with patented artificial intelligence, but it doesn’t end there. Markets can generate momentum for any number of reasons, some durable and some fleeting.
Wall Street Analysts Price Forecasts
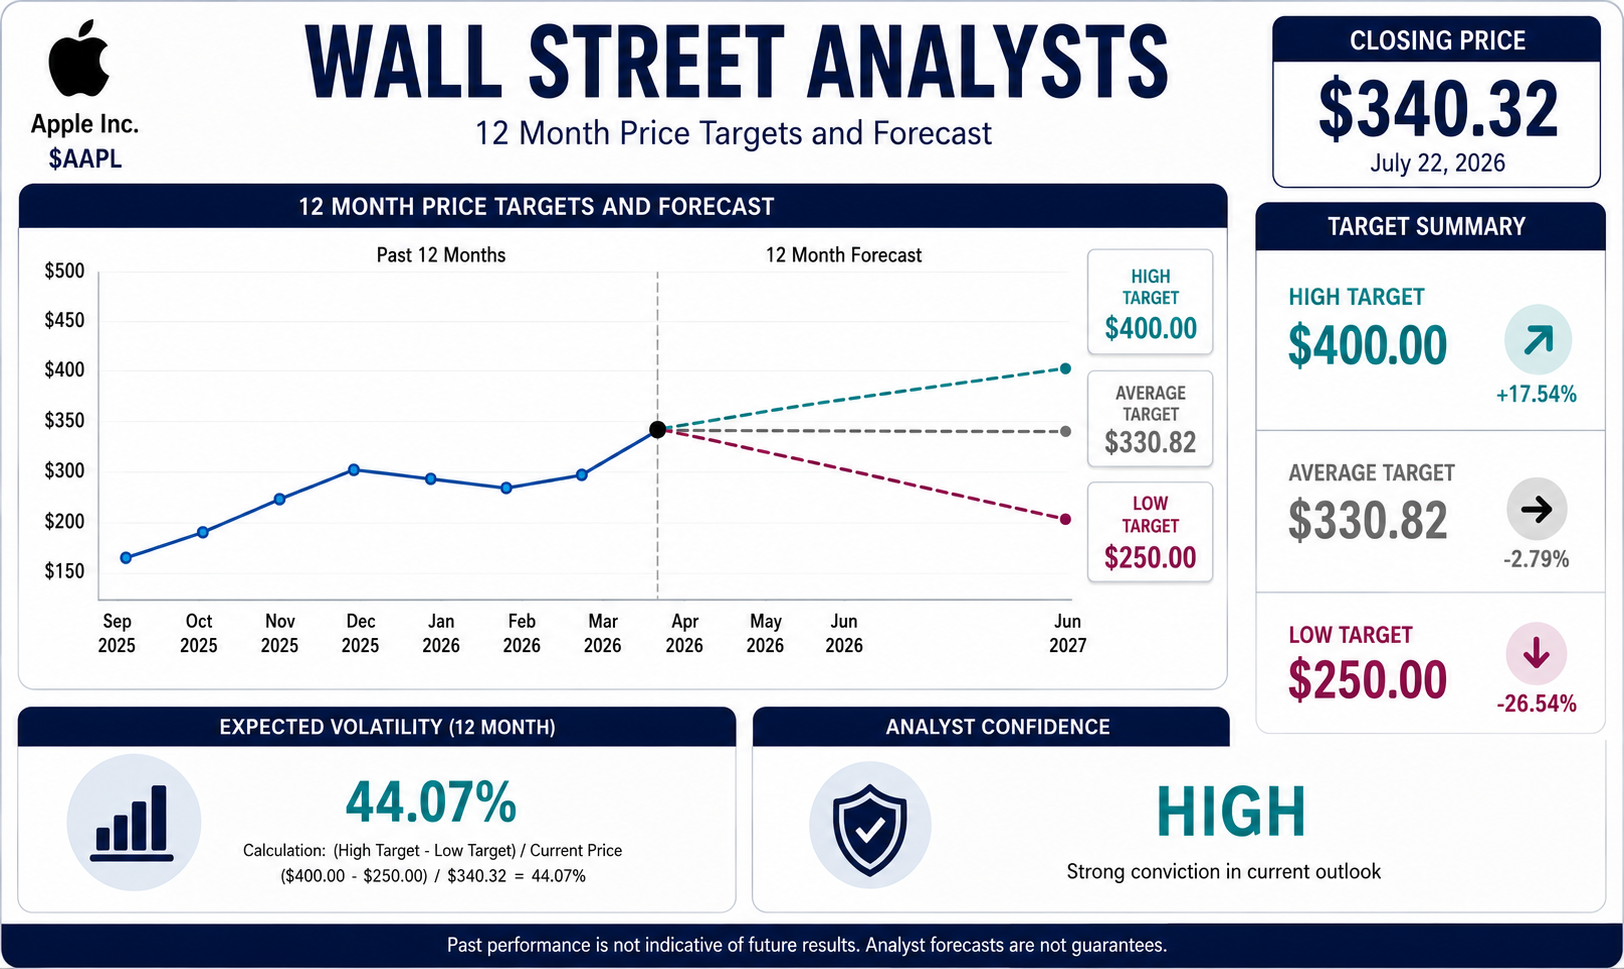
Wall Street analysts have a charming habit of pretending the future is merely an extension of their spreadsheet. Give them enough coffee, enough conference calls, and enough PowerPoint slides, and they’ll confidently tell you where Apple will be trading a year from now. This time the consensus is remarkably optimistic. With Apple closing at $340.32, analysts see a high target of $400, an average target of $330.82, and a low target of $250. That’s a remarkably wide field of possibilities, creating an expected 44.07% volatility range between the most optimistic and most pessimistic forecasts. If nothing else, Wall Street has demonstrated extraordinary confidence that… something will happen.
The interesting story isn’t the average target. It’s the disagreement. The average estimate actually sits slightly below today’s closing price, suggesting the consensus believes Apple is fairly valued after its impressive run. Yet the highest target still implies 17.54% upside, while the lowest projects a 26.54% decline. That’s not a forecast. That’s three different investment committees describing three different universes. One sees Apple continuing to dominate through artificial intelligence, services, and its ecosystem. Another believes expectations have simply gotten ahead of reality. The average lands politely in the middle, where careers are rarely ruined.
What deserves attention is the Analyst Confidence panel. Despite the broad range of price targets, conviction remains high. That tells you analysts largely agree on the quality of the business even if they disagree on what investors will be willing to pay for it twelve months from now. That’s an important distinction. Valuation is an opinion. Execution is observable. Apple has built an extraordinary record of generating revenue, earnings, free cash flow, and shareholder returns. The debate is not whether Apple is a great company. The debate is how much greatness has already been reflected in today’s stock price.
That is why experienced traders don’t outsource their decision-making to Wall Street, no matter how polished the research report or how expensive the suit delivering it. Analyst targets are useful because they reveal expectations, not because they predict the future. Markets have a habit of making very intelligent people look very surprised. At VantagePoint, patented artificial intelligence is designed to complement that fundamental research by measuring what the market is actually doing, not merely what analysts believe it should do. When improving fundamentals, institutional buying, and predictive market trends begin pointing in the same direction, that’s when the evidence becomes far more compelling than any single twelve-month price target.
52-Week High and Low Boundaries
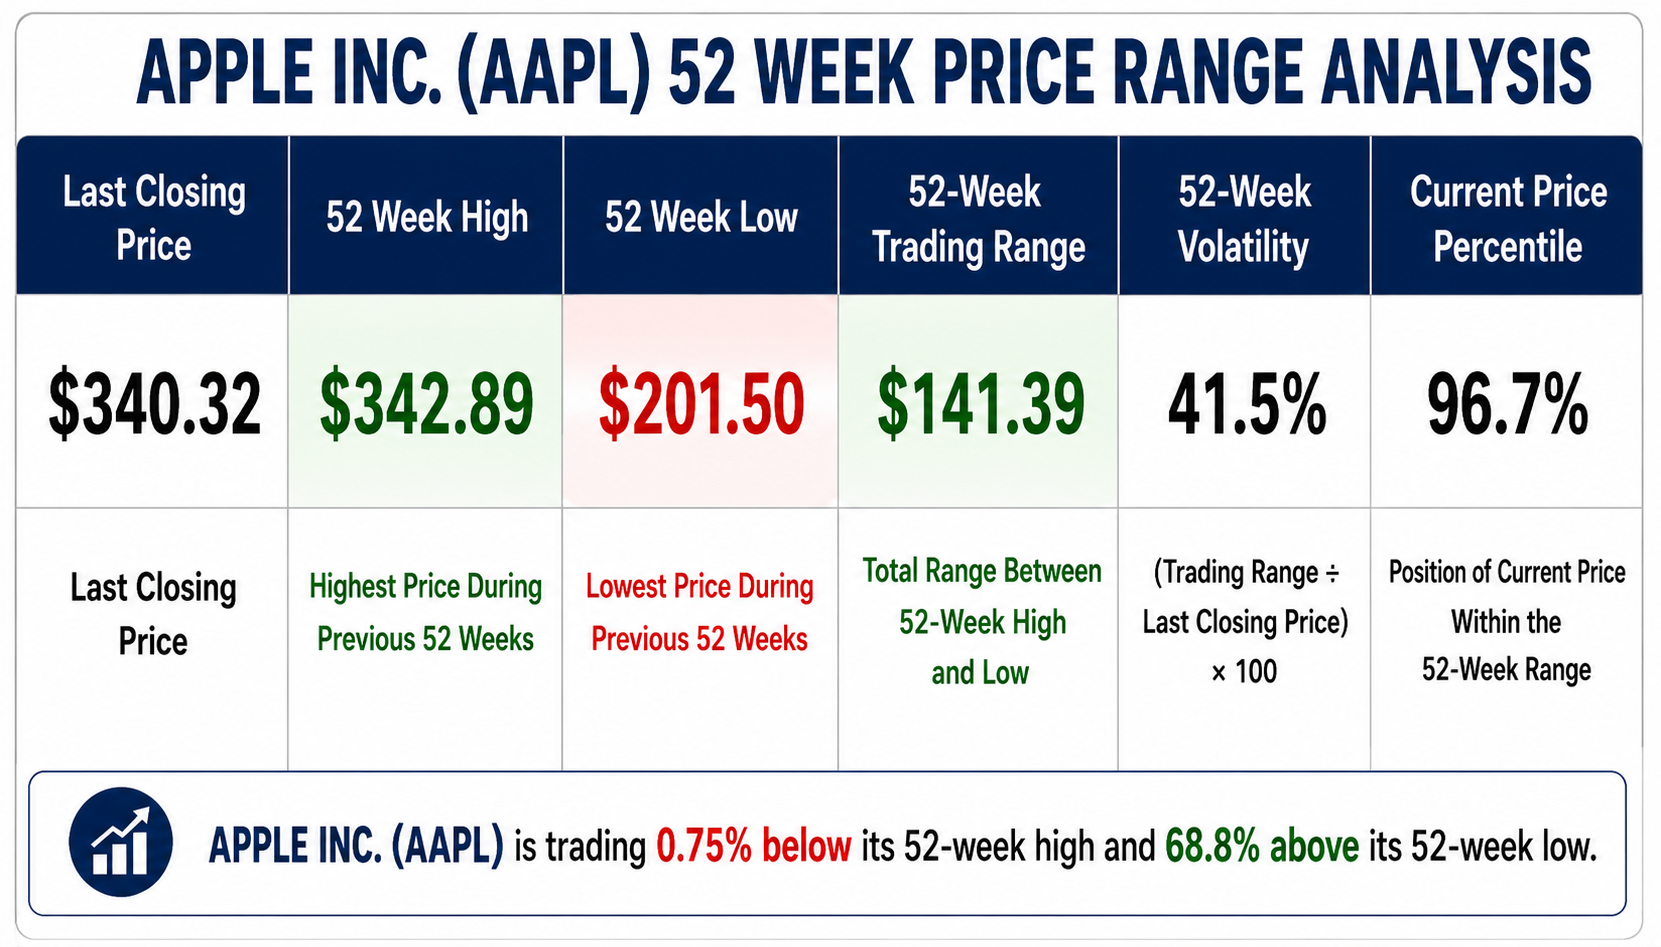
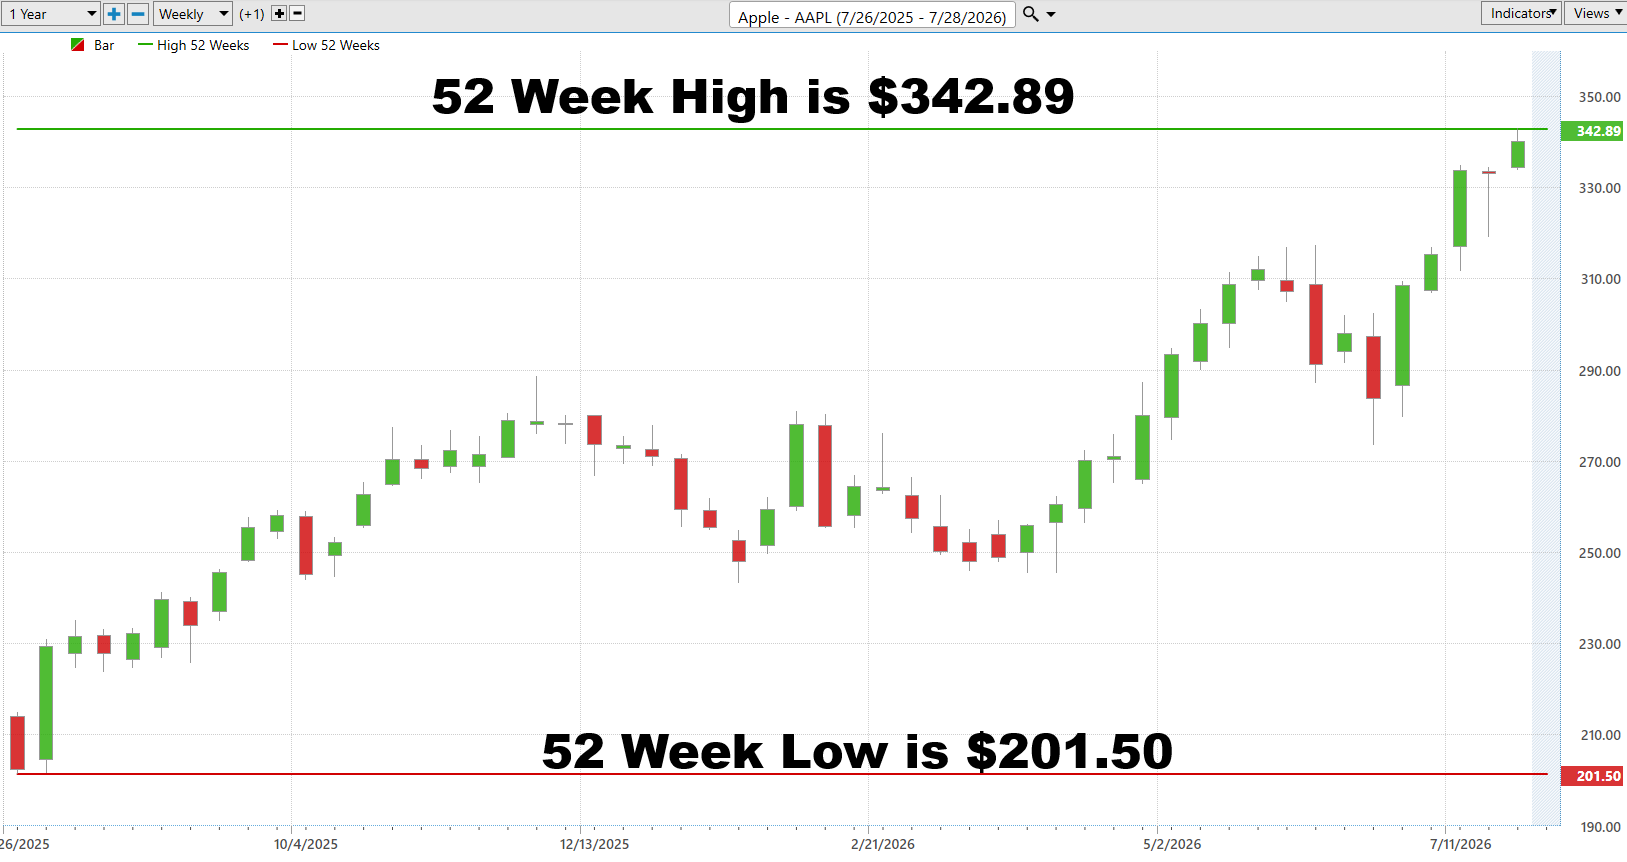
Most traders see a stock making new highs and immediately start asking the wrong question: “Isn’t it too expensive?” The market asks a different question entirely: “Who keeps buying?” Apple is now trading just 0.75% below its 52-week high of $342.89, while sitting 68.8% above its 52-week low of $201.50. That places the stock in the 96.7th percentile of its entire 52-week trading range. Those aren’t the fingerprints of a stock struggling to survive. They’re the fingerprints of one under persistent institutional accumulation.
The weekly chart tells the story even more clearly. Apple didn’t sprint from its lows to its highs in a straight line. It climbed, paused, corrected, consolidated, and then resumed its advance. Every pullback invited buyers back into the market. Instead of producing a lower high, the stock continued building a series of higher highs and higher lows until it challenged the very top of its annual range. That’s exactly the type of price behavior professionals look for because strong trends rarely announce themselves with excitement. They reveal themselves through consistency.
Another statistic deserves your attention. The entire 52-week trading range spans $141.39, representing 41.5% of the current share price. That tells you Apple is far from a low-volatility asset, yet despite experiencing meaningful swings throughout the year, buyers have repeatedly regained control. Volatility by itself isn’t the enemy. Direction is what matters. In Apple’s case, volatility has been the vehicle that carried the stock steadily higher rather than knocking it off course.
This is why experienced traders keep one eye on fundamentals and the other on the scoreboard. Stocks making or challenging new 52-week highs are often demonstrating something the headlines haven’t fully recognized yet: demand continues to exceed supply. That doesn’t guarantee Apple can’t pull back from these levels. Every trend eventually pauses or reverses. But until the market begins producing lower highs, lower lows, and sustained selling pressure, the weight of the evidence continues to favor the bulls rather than the bears.
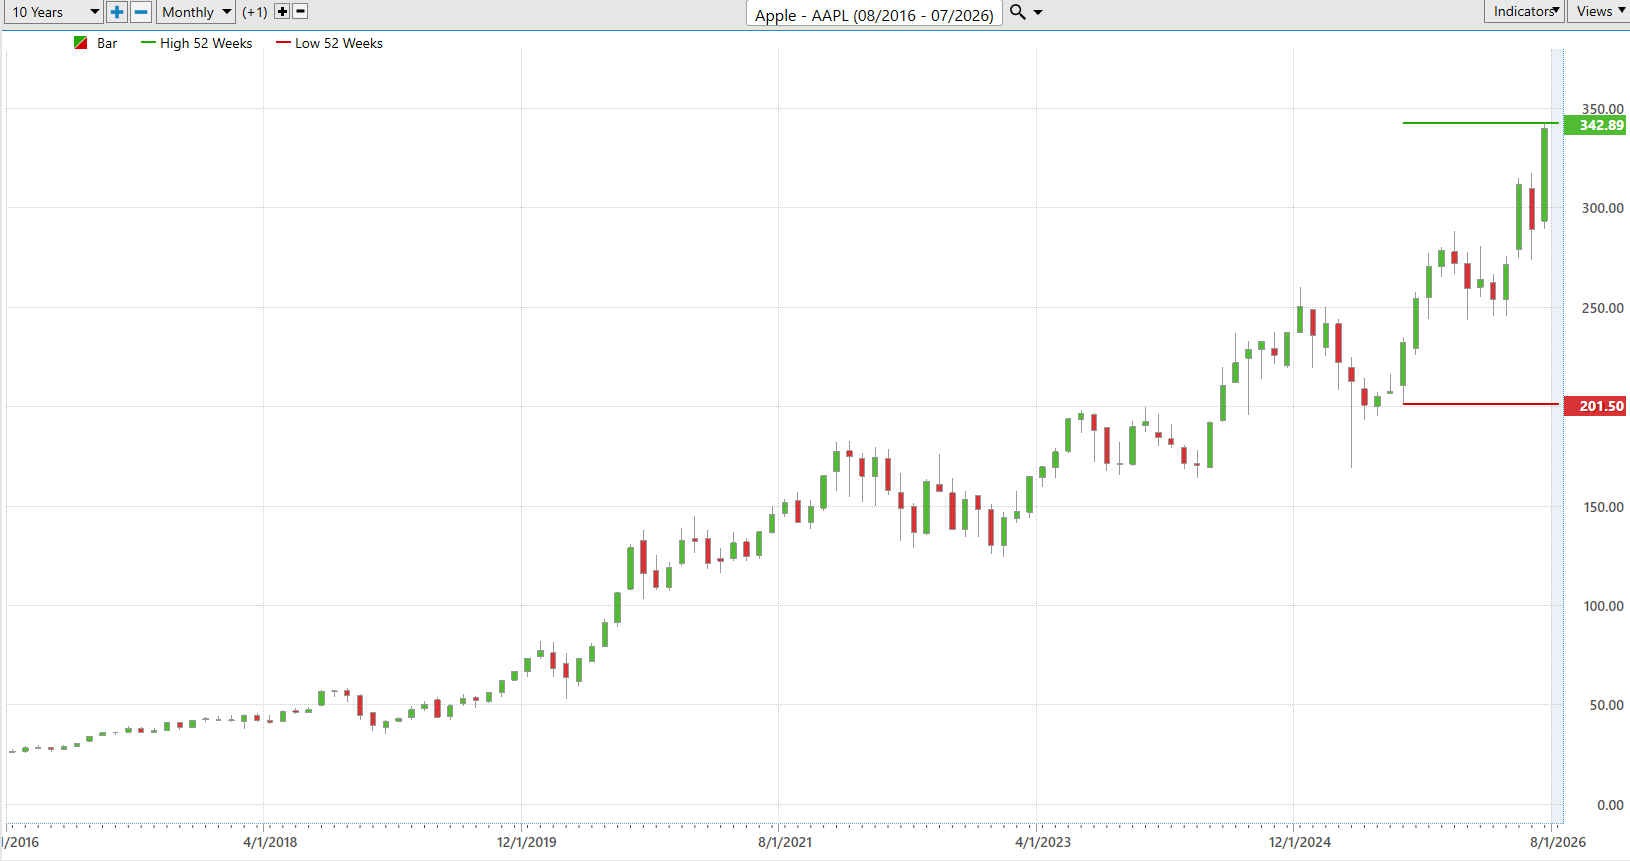
$AAPL is currently making new 52 week highs as well as new 10 year highs (all time highs). This is one of the most powerful momentum setups on Wall Street because it communicates that there is no overhead supply of the stock coming onto the market and that the stock is in price discovery.
When we zoom out on the chart and look at the 10 year monthly chart we zee the powerful journey $AAPL has been on over the past decade.
Best-Case/ Worst-Case Scenario Analysis
Volatility is one of the most misunderstood concepts in investing. It isn’t a theoretical statistic buried in a textbook. It’s the market’s daily reminder that opportunity and risk travel together. One of the fastest ways to appreciate both is to study what a stock has actually done during prior advances and declines. Apple’s weekly chart provides a clear roadmap. The stock has historically produced rallies ranging from 15.7% to 42.0%, with the two most recent advances delivering gains of 28.6% and 25.3%. Those moves did not occur in isolation. They developed after periods of consolidation and steadily expanding institutional demand, demonstrating how sustained buying pressure can translate into meaningful upside for patient traders.
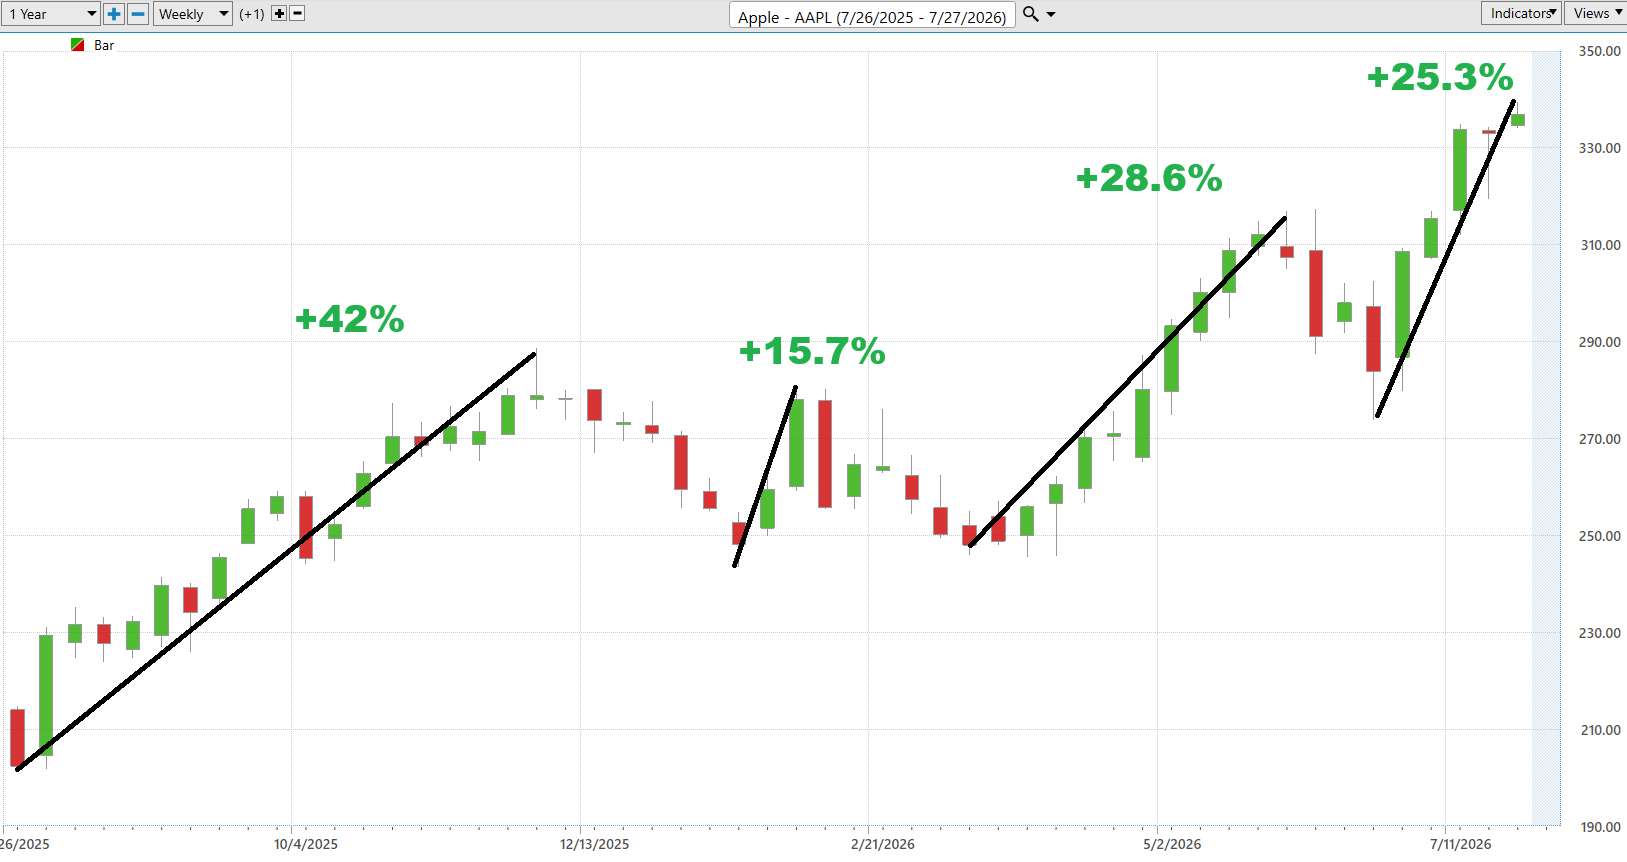
The lesson from those advances is not that Apple is destined to repeat them, but that the stock has consistently demonstrated the ability to generate substantial upside once buyers regain control. Historical best-case scenarios establish a realistic framework for setting expectations, planning profit objectives, and understanding what the market has already proven is possible. Today, with Apple trading just 0.75% below its 52-week high and sitting in the 96.7th percentile of its annual trading range, the long-term trend remains intact. As long as the pattern of higher highs and higher lows continues, history suggests the primary trend deserves the benefit of the doubt.
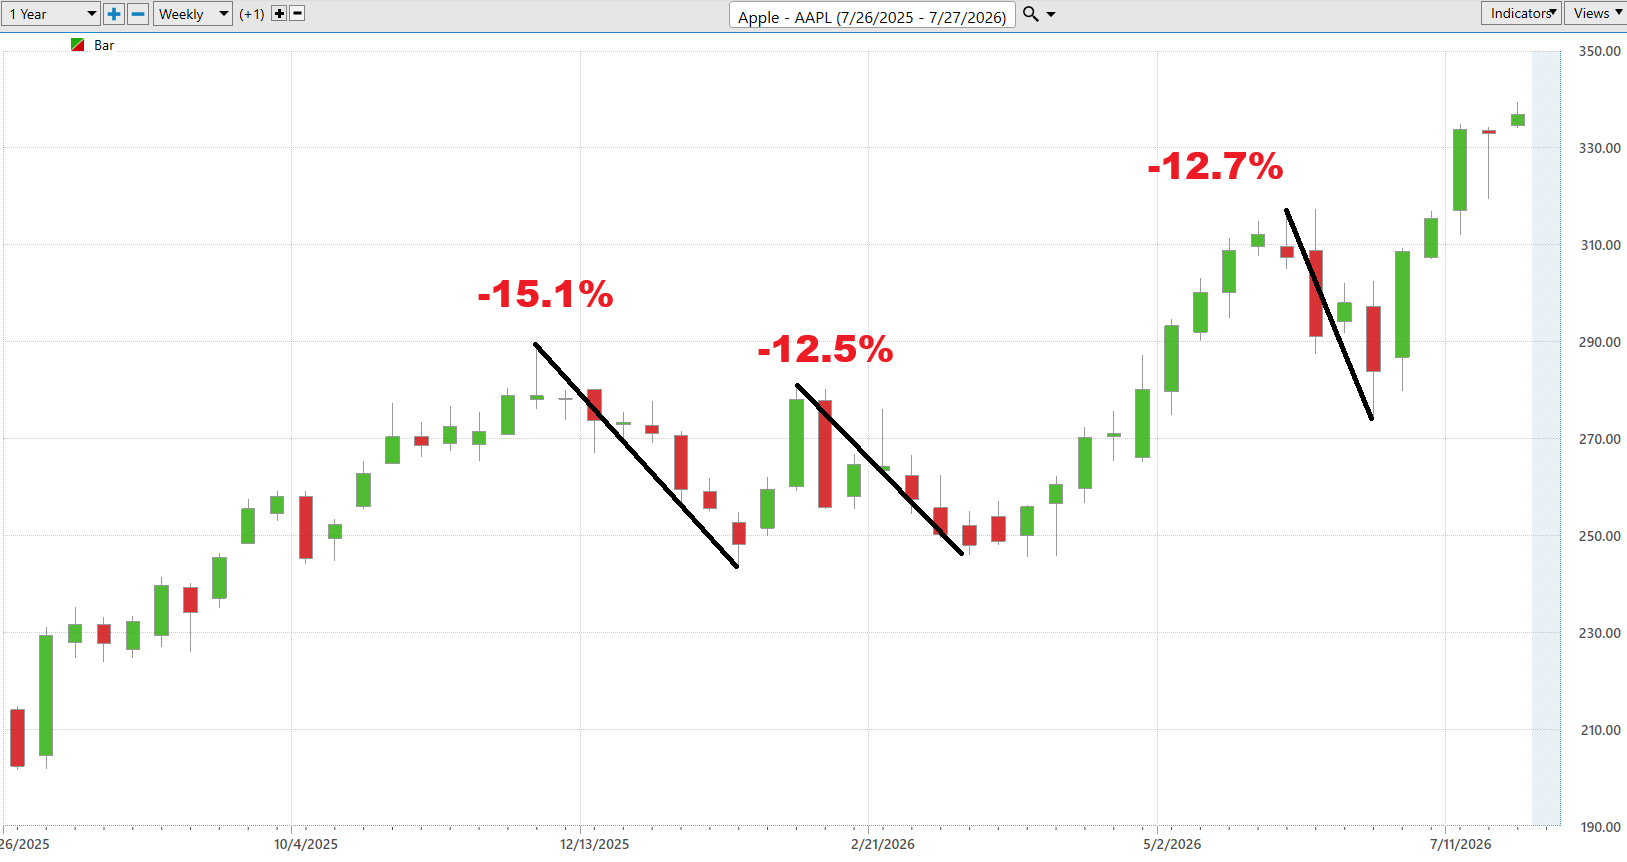
Of course, every successful trend experiences setbacks, and that brings us to the other side of the equation. Over the same period, Apple endured three notable corrections ranging from 12.5% to 15.1%. Those declines were large enough to test conviction, shake out short-term traders, and remind investors that even the strongest stocks rarely move in a straight line. Yet each correction eventually attracted buyers who stepped back in and drove the stock to fresh highs, reinforcing the broader uptrend.
That is why this exercise is so valuable. The historical record provides perspective rather than prediction. A correction similar to those seen over the past year would be uncomfortable, but it would not be unprecedented or, by itself, evidence that the long-term trend has broken. Likewise, another advance comparable to prior rallies is possible, but never guaranteed. The goal is not to forecast the next percentage move. It is to understand the range of outcomes the market has already demonstrated. Armed with that perspective, traders can make more informed decisions about position sizing, risk management, and profit expectations instead of reacting emotionally to every swing in price.
Most traders spend their lives chasing whatever is moving this week. Professionals spend their time asking a much harder question: Is this strength real? That’s where this comparison table earns its keep. Apple isn’t merely outperforming one benchmark or benefiting from a temporary burst of enthusiasm. It’s outperforming the S&P 500, the Nasdaq Composite, the Dow Jones Industrial Average, and the Russell 2000 simultaneously. That kind of broad-based leadership is uncommon because every benchmark represents a different slice of the market. When one stock consistently rises above all of them, it suggests institutional investors are making a deliberate decision to concentrate capital there rather than simply riding a rising market.
Now direct your attention to the Relative Outperformance section beneath the main table. Those numbers tell the story that matters most. Relative strength is what separates market leaders from stocks that are merely participating in a rally. Apple isn’t just generating positive returns. It’s creating a widening performance gap over every major benchmark, and that gap remains substantial regardless of whether you look at the recent past or the longer-term trend. Markets rotate. Leadership changes. Few stocks can maintain an advantage over every major average at the same time because institutional money constantly searches for the next opportunity. When a stock continues to distance itself from the field instead of giving back its lead, it’s a signal that demand is overwhelming supply.
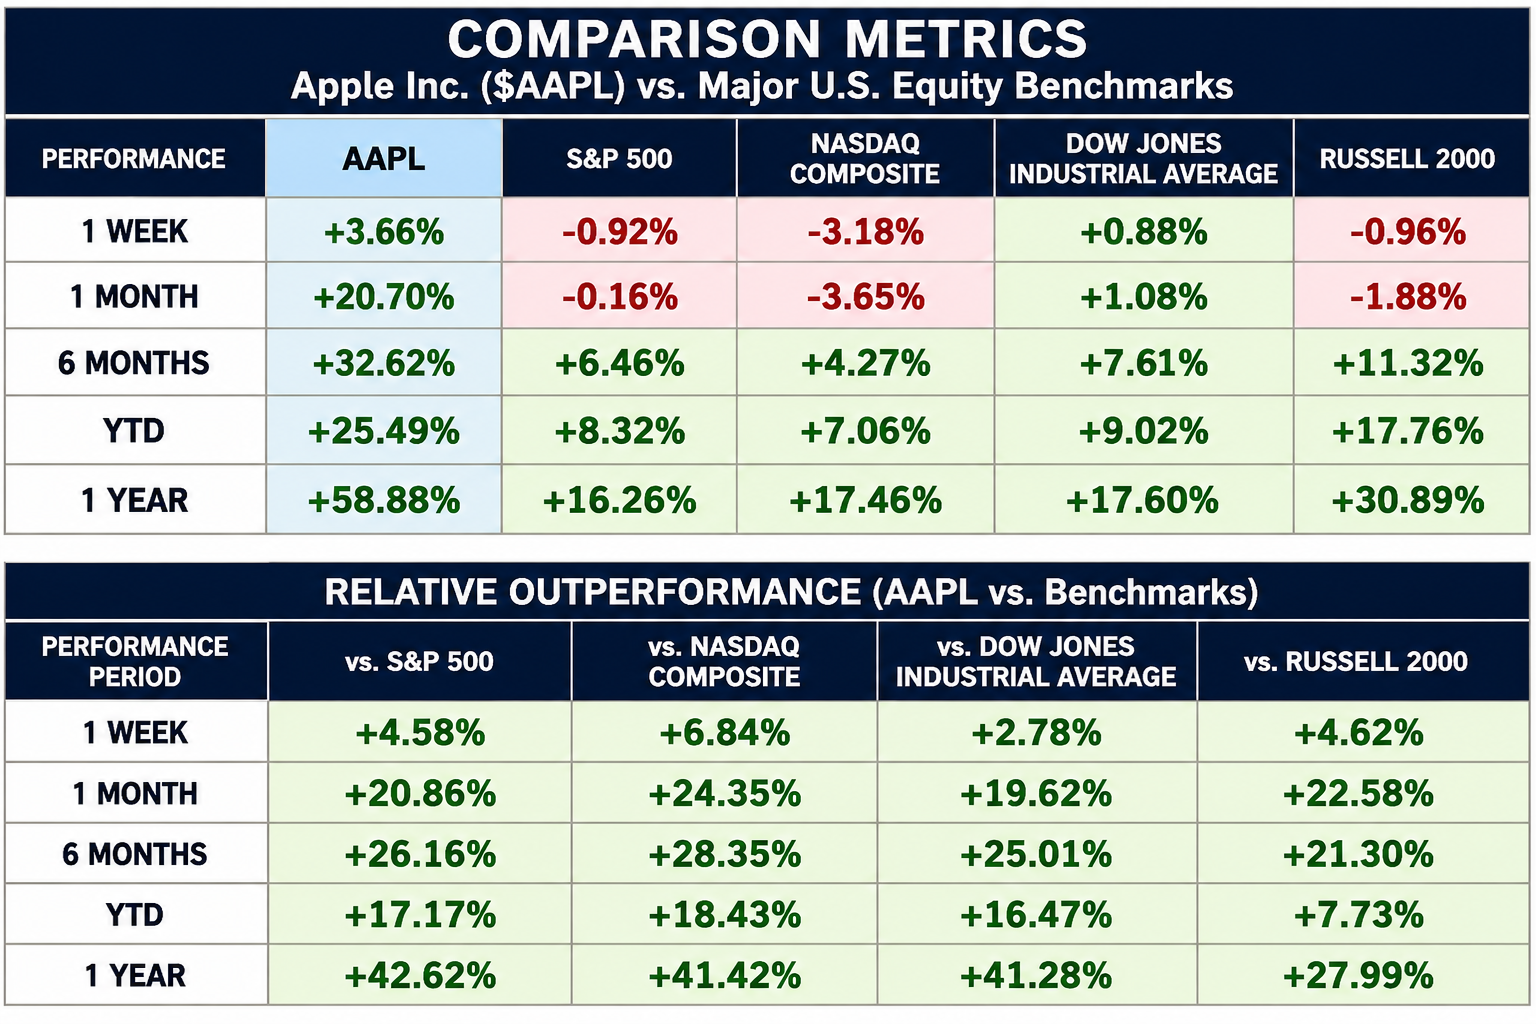
This doesn’t guarantee the trend will continue forever. No stock moves in a straight line. But history shows that exceptional winners often spend long periods outperforming before the broader investing public fully appreciates what’s happening. That’s why professional traders pay as much attention to relative performance as they do to absolute returns. The market is always voting with real money, and the Relative Outperformance table is the scoreboard. Right now, that scoreboard says Apple isn’t simply winning. It’s leading the race by a margin that deserves every trader’s attention.
Vantagepoint AI Predictive Blue Line
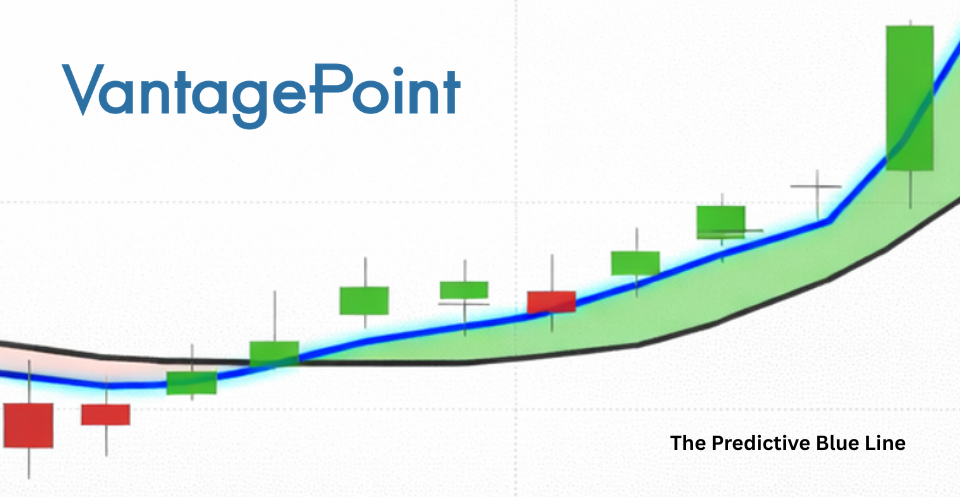
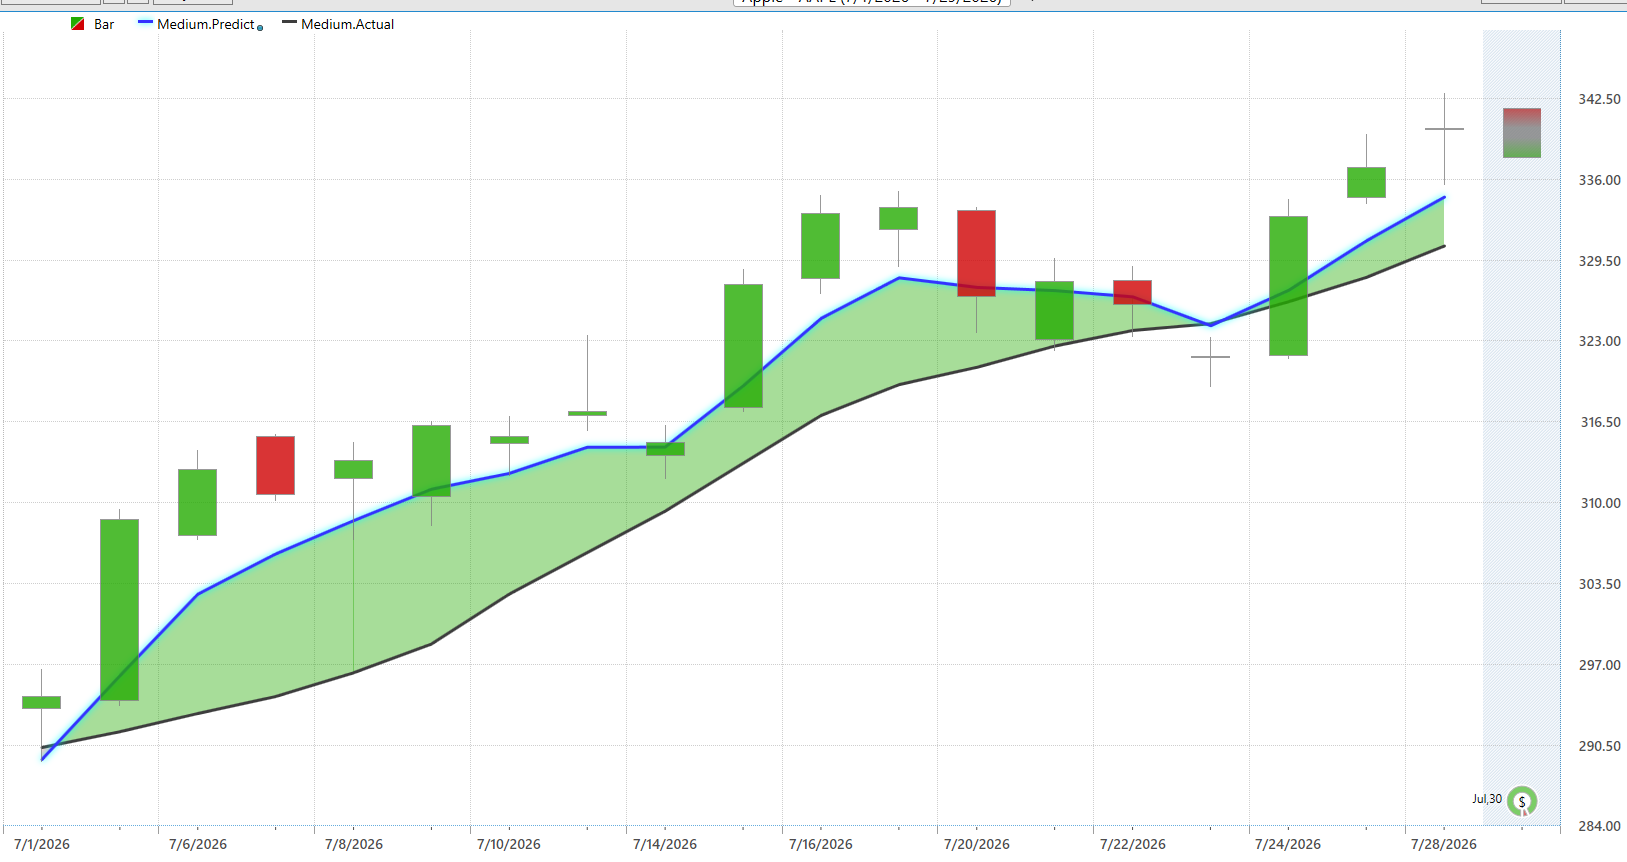
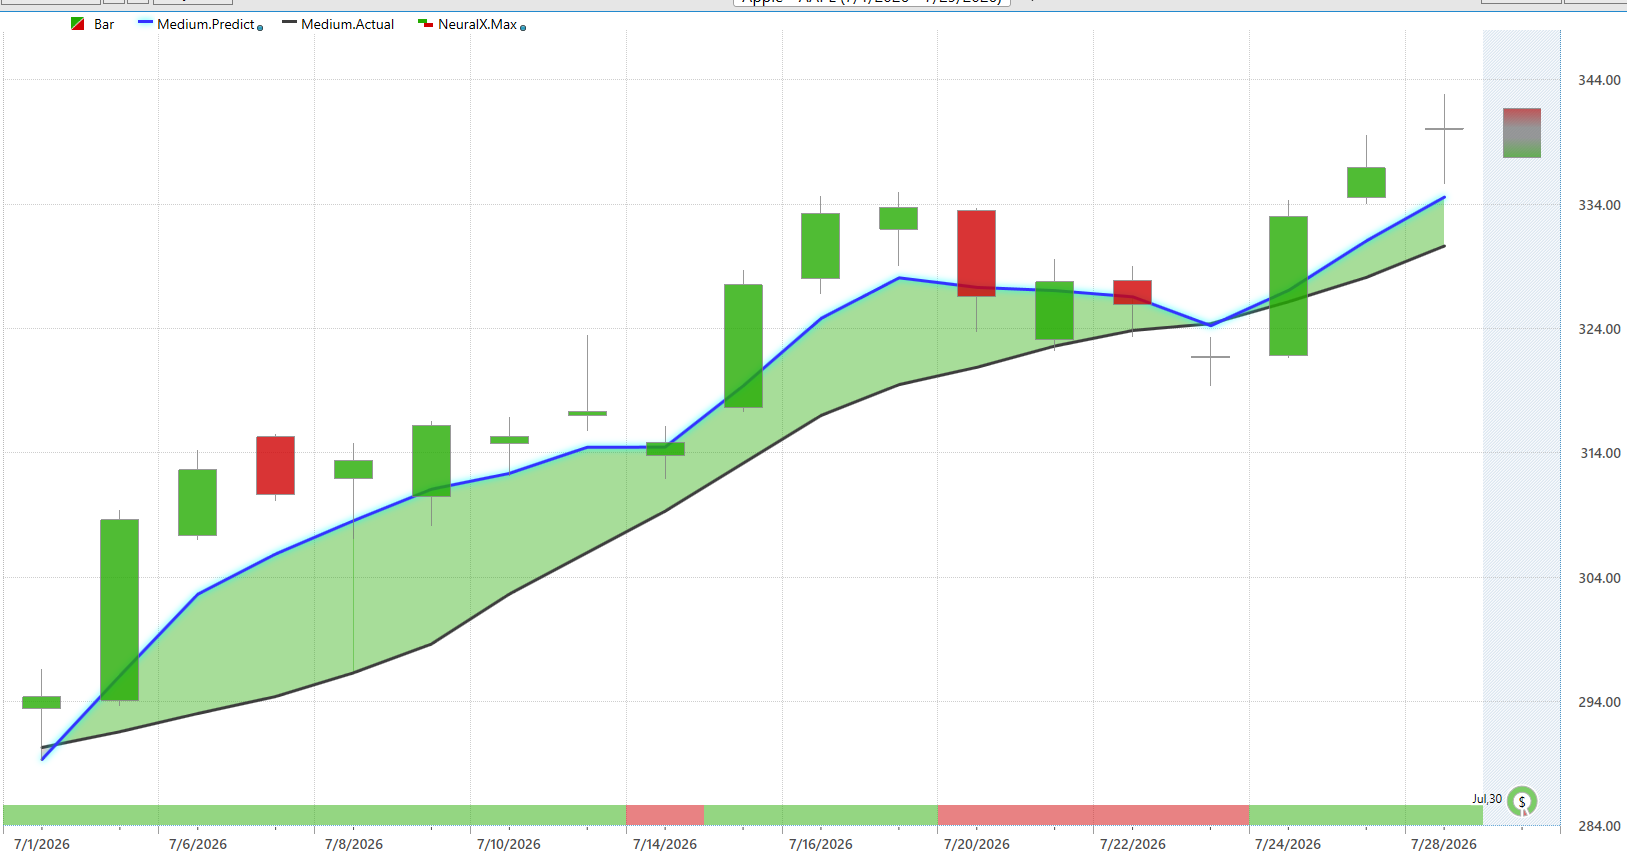
One of the quickest ways to determine whether a trend is strengthening or weakening is to compare where the market has been with where it is expected to go. That’s exactly what the Predictive Blue Line is designed to do. On Apple’s daily chart, the Predictive Blue Line remains firmly above the black actual moving average, and both lines are advancing higher. Just as important, the spread between the two remains positive, signaling that the market’s projected direction continues to lead the current trend rather than lag it. In practical terms, buyers remain in control.
There are two details on this chart that deserve special attention. First, every meaningful pause during July was met with renewed strength in the Predictive Blue Line before the actual moving average had fully caught up. Rather than rolling over, the blue line flattened briefly and then resumed climbing, allowing the black moving average to follow. That is exactly the behavior traders want to see in a healthy trend. Second, the most recent acceleration has pushed both lines to new highs together. When the predictive trend and the actual trend are rising in tandem, it suggests momentum is being reinforced rather than exhausted.
No indicator should ever be viewed in isolation, but the message from the Predictive Blue Line is difficult to ignore. Apple continues to exhibit a constructive technical profile characterized by rising projected values, a positive relationship between the predictive and actual averages, and price action that remains aligned with both. Until that relationship begins to deteriorate through a flattening or downward turn in the Predictive Blue Line, followed by a crossover beneath the actual moving average, the technical evidence continues to support the view that the path of least resistance remains higher.
VantagePoint AI Neural Index
The Neural Index is designed to answer a deceptively simple question: What are the odds that today’s trend is still intact over the next 48 to 72 hours? Price charts tell you what has happened. The Predictive Blue Line tells you where momentum is leaning. The Neural Index adds another layer by acting as a short-term confirmation filter. When it agrees with the prevailing trend, the probabilities improve. When it disagrees, experienced traders start paying much closer attention.
Apple’s chart has spent the overwhelming majority of July with the Neural Index locked on green, confirming the prevailing uptrend. There were only two brief interruptions where the indicator flipped to red, and neither lasted long enough to derail the larger advance. Instead, each red signal coincided with a modest pause or pullback before the Neural Index quickly returned to green. That behavior is important. A healthy bull trend rarely advances in a straight line. It breathes. What matters is whether buyers regain control before temporary weakness develops into something more significant. In Apple’s case, that’s exactly what happened.
The most recent signal may be the most encouraging of the group. Following a short period of consolidation, the Neural Index shifted back to green as both price and the Predictive Blue Line turned higher. That creates what VantagePoint traders often refer to as double confirmation: the predictive trend is rising, and the Neural Index is confirming that the near-term probabilities continue to favor higher prices. One indicator can be early. Another can occasionally be wrong. When they agree, the evidence becomes much more compelling.
Markets don’t ring a bell before they change direction. They whisper. The Neural Index is designed to help traders hear those whispers before they become obvious to everyone else. At the moment, Apple’s message remains straightforward. Institutional buyers continue to support the trend, short-term momentum has returned after only brief interruptions, and the weight of the technical evidence still favors the bulls. That doesn’t eliminate risk. It simply means that, until the Neural Index begins producing sustained red readings alongside deterioration in the Predictive Blue Line, the prevailing trend continues to deserve the benefit of the doubt.
VantagePoint AI Daily Range Forecast
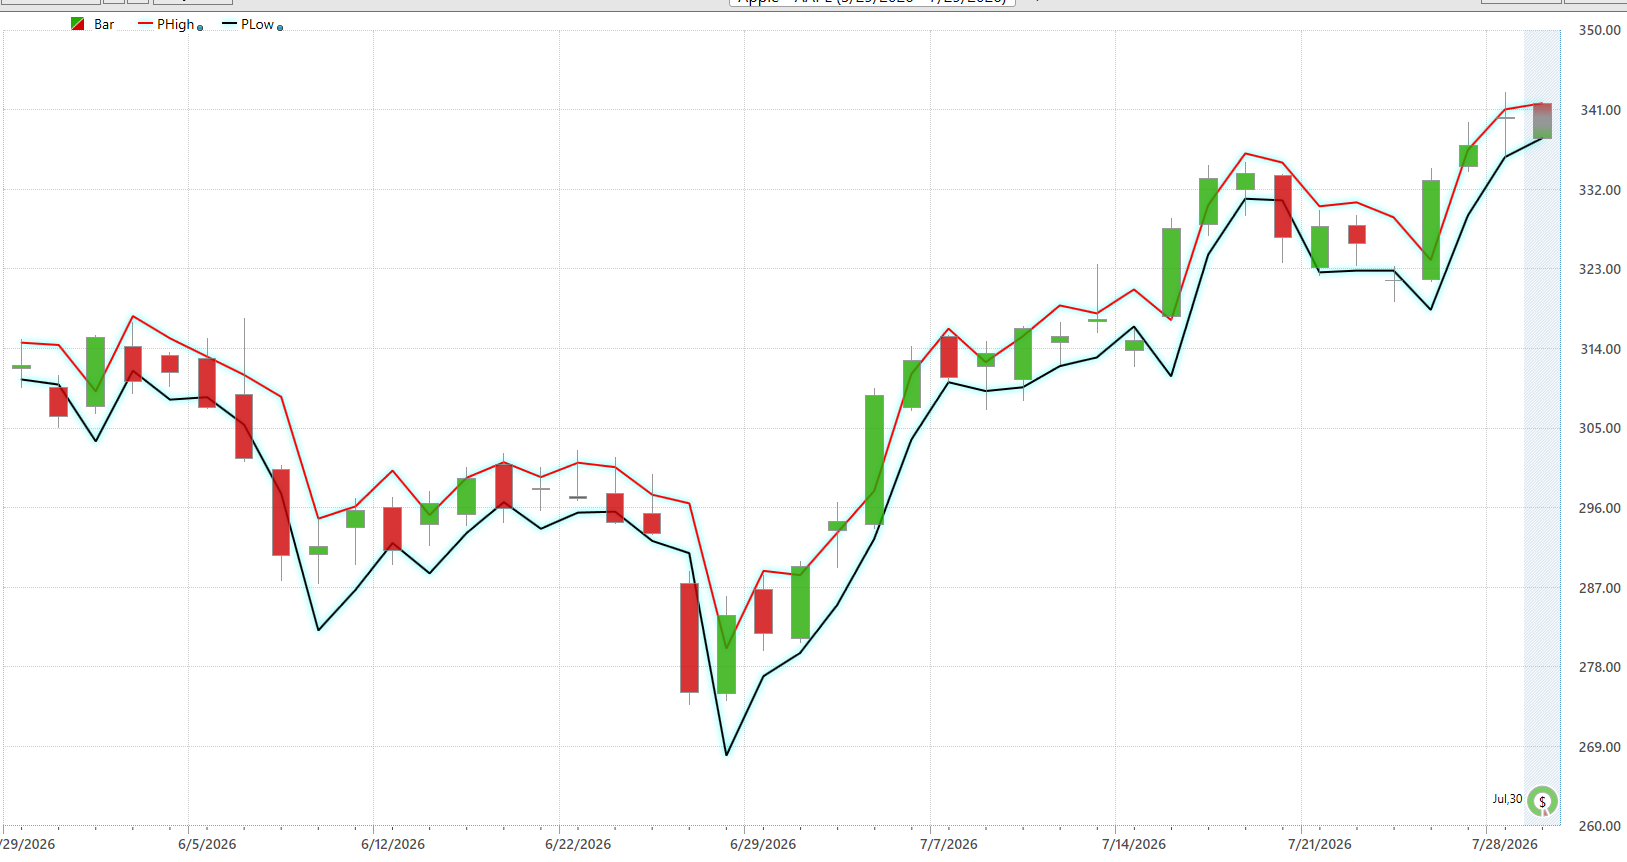
The Daily Range Forecast does something every trader wishes they could do with greater consistency: it shifts your attention away from predicting the next headline and toward preparing for the next trading session. Rather than asking whether Apple will be up or down tomorrow, the more productive question is this: Where is the market most likely to trade? The forecast bands provide that framework. They establish a probable high and low before the opening bell, allowing traders to think in terms of opportunity, risk, and execution instead of emotion.
Apple’s recent price action has respected that framework remarkably well. As the stock advanced from the late-June lows, the forecast high and forecast low climbed in lockstep with price, reflecting a market where both momentum and expectations have steadily improved. Even during the brief pause in late July, the projected range narrowed rather than collapsing, suggesting consolidation instead of deterioration. Now the forecast bands have resumed moving higher, matching the renewed strength in price and reinforcing the broader uptrend already evident in the Predictive Blue Line and Neural Index.
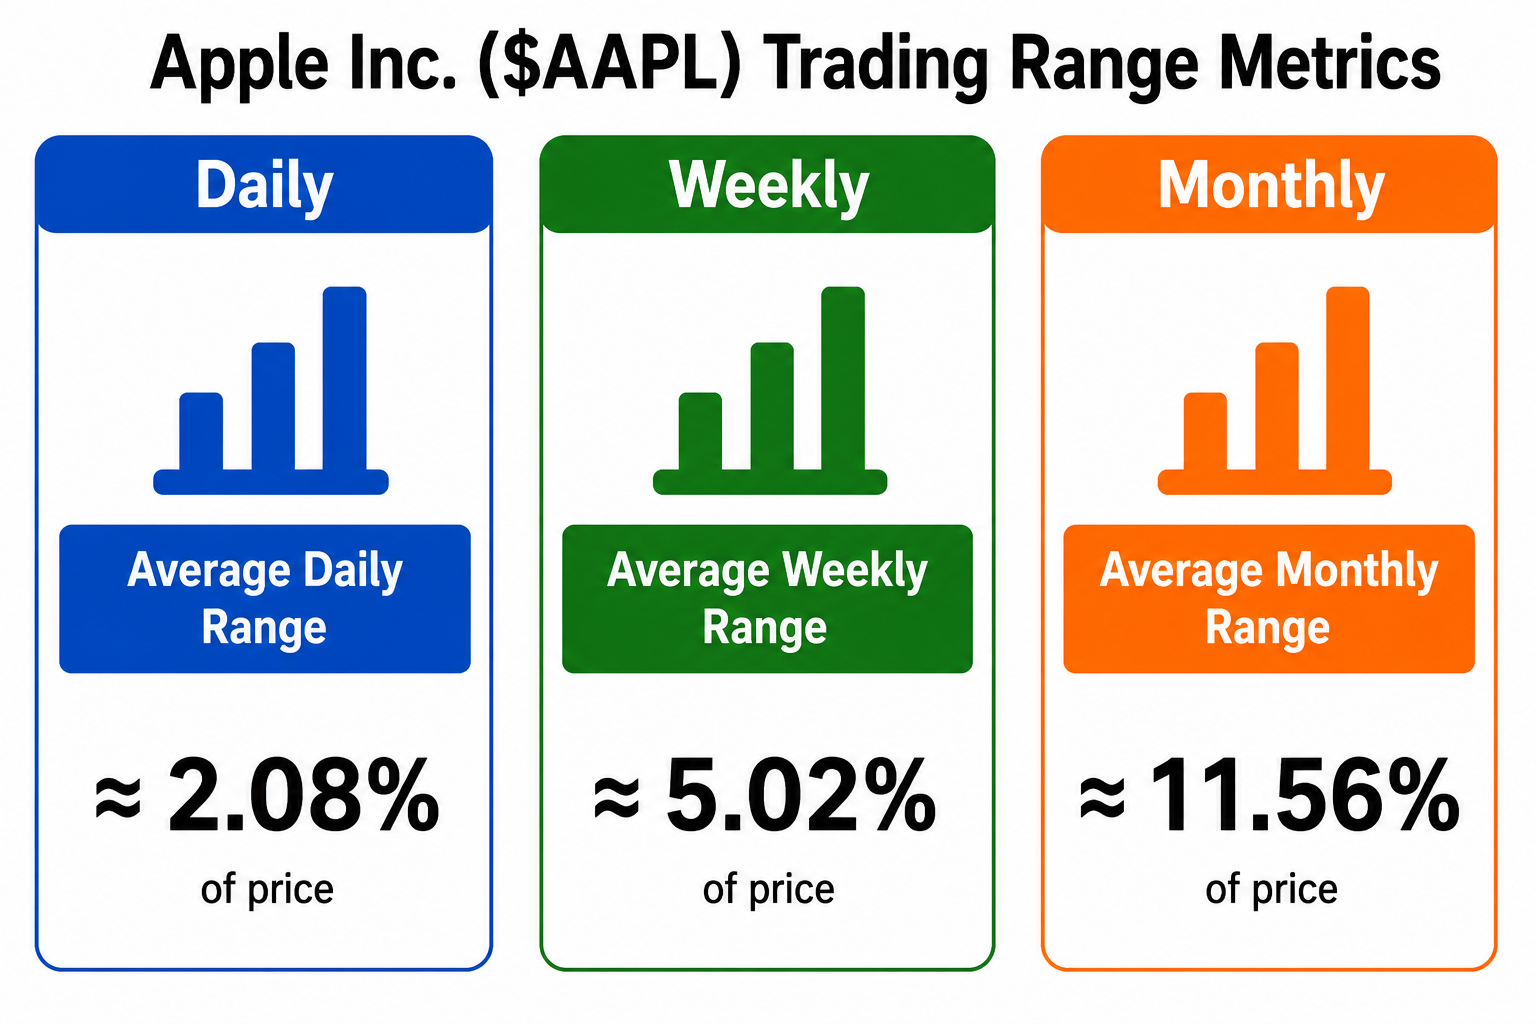
Equally important is the character of the trading ranges themselves. Your Trading Range Metrics show Apple typically moves about 2.08% in a normal day, 5.02% over a typical week, and 11.56% during an average month. Those historical averages provide valuable context for interpreting the Daily Range Forecast. When price approaches the projected high early in the session, it reminds traders that much of the day’s expected movement may already have occurred. Conversely, when price begins the session near the projected low while the broader trend remains constructive, history suggests there may still be room for buyers to assert themselves before the day is complete.
The Daily Range Forecast does not promise where Apple will close, nor does it eliminate uncertainty. Instead, it provides a disciplined framework for anticipating where buyers and sellers are most likely to engage. When that framework aligns with a rising Predictive Blue Line, a positive Neural Index, and a stock trading near its 52-week high, the evidence points toward a market where traders should remain focused on managing opportunity rather than fearing volatility.
VantagePoint AI Intermarket Analysis
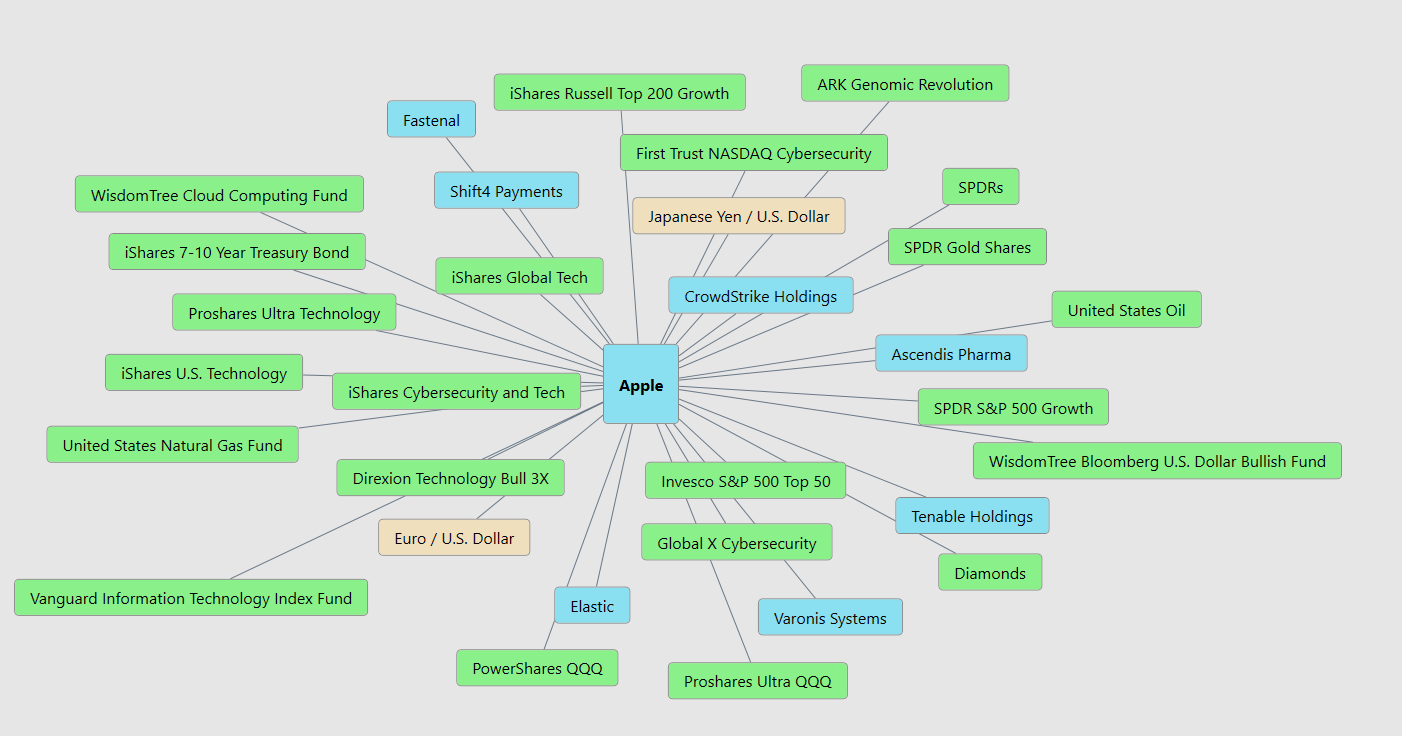
One of the biggest mistakes new traders make is believing that a stock moves all by itself. It doesn’t. Imagine Apple is the captain of a soccer team. Even if the captain is incredibly talented, the game is much easier to win when the rest of the team is playing well. Intermarket analysis is simply the process of looking at the “teammates” that influence Apple. Instead of studying only Apple’s chart, traders also watch related stocks, exchange-traded funds (ETFs), currencies, commodities, and other markets that tend to move with or against Apple. The goal is simple: if several related markets are pointing in the same direction, traders have more confidence that Apple’s trend is real rather than just a lucky bounce.
Apple’s intermarket network tells a very encouraging story. Many of its strongest relationships come from technology-focused ETFs like Invesco QQQ, Vanguard Information Technology ETF, iShares U.S. Technology, iShares Global Tech, and cybersecurity funds such as First Trust NASDAQ Cybersecurity and Global X Cybersecurity. Apple is also connected to individual technology companies including CrowdStrike, Fastenal, Shift4 Payments, Elastic, Varonis Systems, and Tenable. When many of these markets are rising together, it’s a bit like watching an entire flock of birds flying in the same direction. One bird might be wrong, but when the whole flock turns at once, there’s usually a reason.
The chart also reminds us that not every influence comes from technology. Apple is connected to the Japanese yen, the euro, gold, U.S. Treasury bonds, the U.S. dollar, oil, and natural gas. That may sound strange at first, but large global companies operate in dozens of countries, buy parts from suppliers around the world, and sell products in many different currencies. Changes in interest rates, currencies, or commodity prices can eventually affect profits, investor confidence, and ultimately Apple’s stock price. Professional traders study these relationships because markets often leave clues in related assets before those clues become obvious in Apple’s own chart.
This is why intermarket analysis is such a powerful decision-making tool. Instead of relying on a single chart, traders gather evidence from an entire network of connected markets. When Apple’s own price trend, its technology peers, sector ETFs, and related global markets begin telling the same story, confidence in that trend naturally increases. No single indicator is perfect, and no single market predicts the future with certainty. But when many independent markets start pointing in the same direction, traders gain something far more valuable than a prediction. They gain confirmation. And in trading, confirmation is often what separates a good idea from a high-probability opportunity.
Here are the 31 key price drivers of $AAPL.
Our Suggestion
Apple’s last two reported quarters delivered record revenue and earnings, record iPhone and Services results, expanding operating cash flow, and a still-growing installed base. Management was not making excuses or lowering the curtains. It was reporting that demand remained strong across products, services, regions, and devices. That is what winning looks like.
The larger business story is even harder to ignore. Apple is using its ecosystem, custom silicon, services platform, and enormous financial resources to deepen the moat around the customer. Siri AI is intended to place a more capable, conversational assistant across Apple’s hardware and operating systems, while the company is also expanding domestic chip production through a multiyear Broadcom agreement expected to exceed $30 billion. Add a higher dividend and another $100 billion share-repurchase authorization, and the message becomes clear: Apple is investing aggressively in future products while continuing to return substantial capital to shareholders. The opportunity is enormous, but so is the burden of execution. Apple must make its artificial-intelligence strategy useful, trusted, and commercially meaningful rather than merely fashionable.
Now comes the moment when Wall Street stops applauding the past and demands another performance. Apple’s fiscal third-quarter conference call is scheduled for July 30, 2026, at 5:00 p.m. Eastern Time. Investors will be listening for evidence that iPhone demand remains durable, Services continues producing dependable growth, margins hold up, and the new AI initiatives are advancing toward adoption rather than slipping into the familiar corporate swamp of promises and postponements. They will also be evaluating the leadership transition, with John Ternus named to succeed Tim Cook as chief executive and Cook moving to executive chairman. The next several quarters will test whether Apple can preserve its operating discipline while handing over the wheel of one of the world’s most valuable businesses.
Our suggestion is to respect the evidence without worshipping it. Apple is trading near the top of its 52-week range, the Predictive Blue Line is rising, the Neural Index is positive, and the stock has demonstrated exceptional relative strength against the broader market. Meanwhile, the underlying company continues producing record results and investing in the next generation of its ecosystem. That alignment between business strength and market strength is exactly what disciplined traders should look for. Traders should let the trend prove when it is finished rather than guessing at the top. Don’t chase this stock blindly. Instead analyze normal pullbacks and let the VantagePoint indicators to identify favorable entries. Practice great money management and always use the VantagePoint AI Daily Range Forecast to help identify favorable risk/reward opportunities.
It’s not magic.
It’s machine learning.
Disclaimer: THERE IS A HIGH DEGREE OF RISK INVOLVED IN TRADING. IT IS NOT PRUDENT OR ADVISABLE TO MAKE TRADING DECISIONS THAT ARE BEYOND YOUR FINANCIAL MEANS OR INVOLVE TRADING CAPITAL THAT YOU ARE NOT WILLING AND CAPABLE OF LOSING.
VANTAGEPOINT’S MARKETING CAMPAIGNS, OF ANY KIND, DO NOT CONSTITUTE TRADING ADVICE OR AN ENDORSEMENT OR RECOMMENDATION BY VANTAGEPOINT AI OR ANY ASSOCIATED AFFILIATES OF ANY TRADING METHODS, PROGRAMS, SYSTEMS OR ROUTINES. VANTAGEPOINT’S PERSONNEL ARE NOT LICENSED BROKERS OR ADVISORS AND DO NOT OFFER TRADING ADVICE.