





This week’s AI stock spotlight is Agios Pharmaceuticals ($AGIO).
Agios Pharmaceuticals is a commercial-stage biotechnology company based in Cambridge, Massachusetts. It is led by Chief Executive Officer Brian Goff, employs about 540 people, and has been a public company since its July 2013 listing. The business is built on one scientific idea: cellular metabolism. Agios designs and commercializes medicines that change how cells produce and use energy, with a near-term focus on rare hemolytic anemias, diseases in which red blood cells break down too quickly.
The lead medicine is mitapivat, an oral pyruvate kinase activator. Pyruvate kinase is an enzyme red blood cells use to generate energy. When it is missing, mutated, or simply under strain, those cells can fail. Mitapivat is designed to activate the enzyme, including both the normal form and various mutated forms. In the United States the same molecule is marketed under two names. PYRUKYND, first approved in 2022, treats hemolytic anemia in adults with pyruvate kinase deficiency. AQVESME, approved by the Food and Drug Administration on December 23, 2025, treats anemia in adults with alpha- or beta-thalassemia. Agios says AQVESME is the only FDA-approved medicine for anemia in both non-transfusion-dependent and transfusion-dependent alpha- or beta-thalassemia. The thalassemia brand carries a Risk Evaluation and Mitigation Strategy because of the risk of hepatocellular injury. The PK-deficiency brand does not.
That split is the business model in one sentence. Agios does not run a broad product portfolio. It is trying to turn one molecule into a franchise across three rare blood diseases: PK deficiency, thalassemia, and sickle cell disease. The third is not approved. On July 7, 2026, the FDA accepted the company’s supplemental application for mitapivat in sickle cell disease, for patients aged 16 and older, and granted it Priority Review. The goal date is November 1, 2026. The filing uses the accelerated approval pathway, which requires a confirmatory trial to be underway when the agency decides. If approved, Agios says mitapivat would be positioned as the first oral PK activator for sickle cell disease.
The company has already shown it will cut a program that does not separate itself. On July 21, 2026, Agios discontinued development of tebapivat in sickle cell disease after a mid-stage trial improved hemoglobin and hemolysis but did not show enough differentiation to continue. The stock fell 6.74% that day. That decision came two months after Agios stopped tebapivat in lower-risk myelodysplastic syndromes, so tebapivat is now discontinued in all indications. The company has added programs as well as cut them. On June 1, 2026, it licensed exclusive global rights to cevidoplenib, an oral SYK inhibitor from Oscotec, for immune thrombocytopenia, paying $25 million upfront with up to $140 million in development and regulatory milestones, and it plans to start Phase 3 in the first half of 2028. It has also moved AG-236 into Phase 2/3 development for polycythemia vera. Both programs are years from a commercial decision, so the near-term story still runs through mitapivat.
Agios also has a corporate history that still shows up in the income statement. On April 1, 2021, it closed the sale of its oncology business to Servier and refocused on rare genetic diseases. It competes for capital with other rare-disease biotechnology companies, including BioMarin, Ultragenyx, BioCryst, Ionis, and Sarepta. In sickle cell disease it is not the only company pursuing a pyruvate kinase activator. Novo Nordisk is advancing its own investigational compound in the same class. The differentiation is focus. Few peers have an approved oral PK activator already on the market in two indications, with a third decision dated. The risk is the same fact. If mitapivat stumbles, Agios does not have a second commercial franchise to fall back on.
On October 20, 2026, AGIO closed at $36.64, up 4.99%, or $1.74, from the prior close of $34.90. It opened at $35.04, traded between $35.02 and $37.00, and closed $0.36 below the session high. That followed an 11.43% gain on October 19, so the stock is up 16.99% in two sessions from the October 16 close of $31.32. Agios did not issue a press release on either day. The October 19 move came as two unrelated announcements lifted rare blood-disease stocks as a group: Disc Medicine reported that its Phase 3 APOLLO trial met all primary and secondary endpoints, and Merck KGaA agreed to acquire Silence Therapeutics for $20.00 per American Depositary Share, a 130% premium, in a deal built around a polycythemia vera therapy. Agios has the next scheduled regulatory event in that group. The November 1 FDA goal date is now 12 days from the October 20 close, followed by third-quarter results on November 5. The stock is relevant this week because a binary regulatory date is close, the last major trial readout in this disease cut the share price in half, and the chart has turned sharply higher into that date.
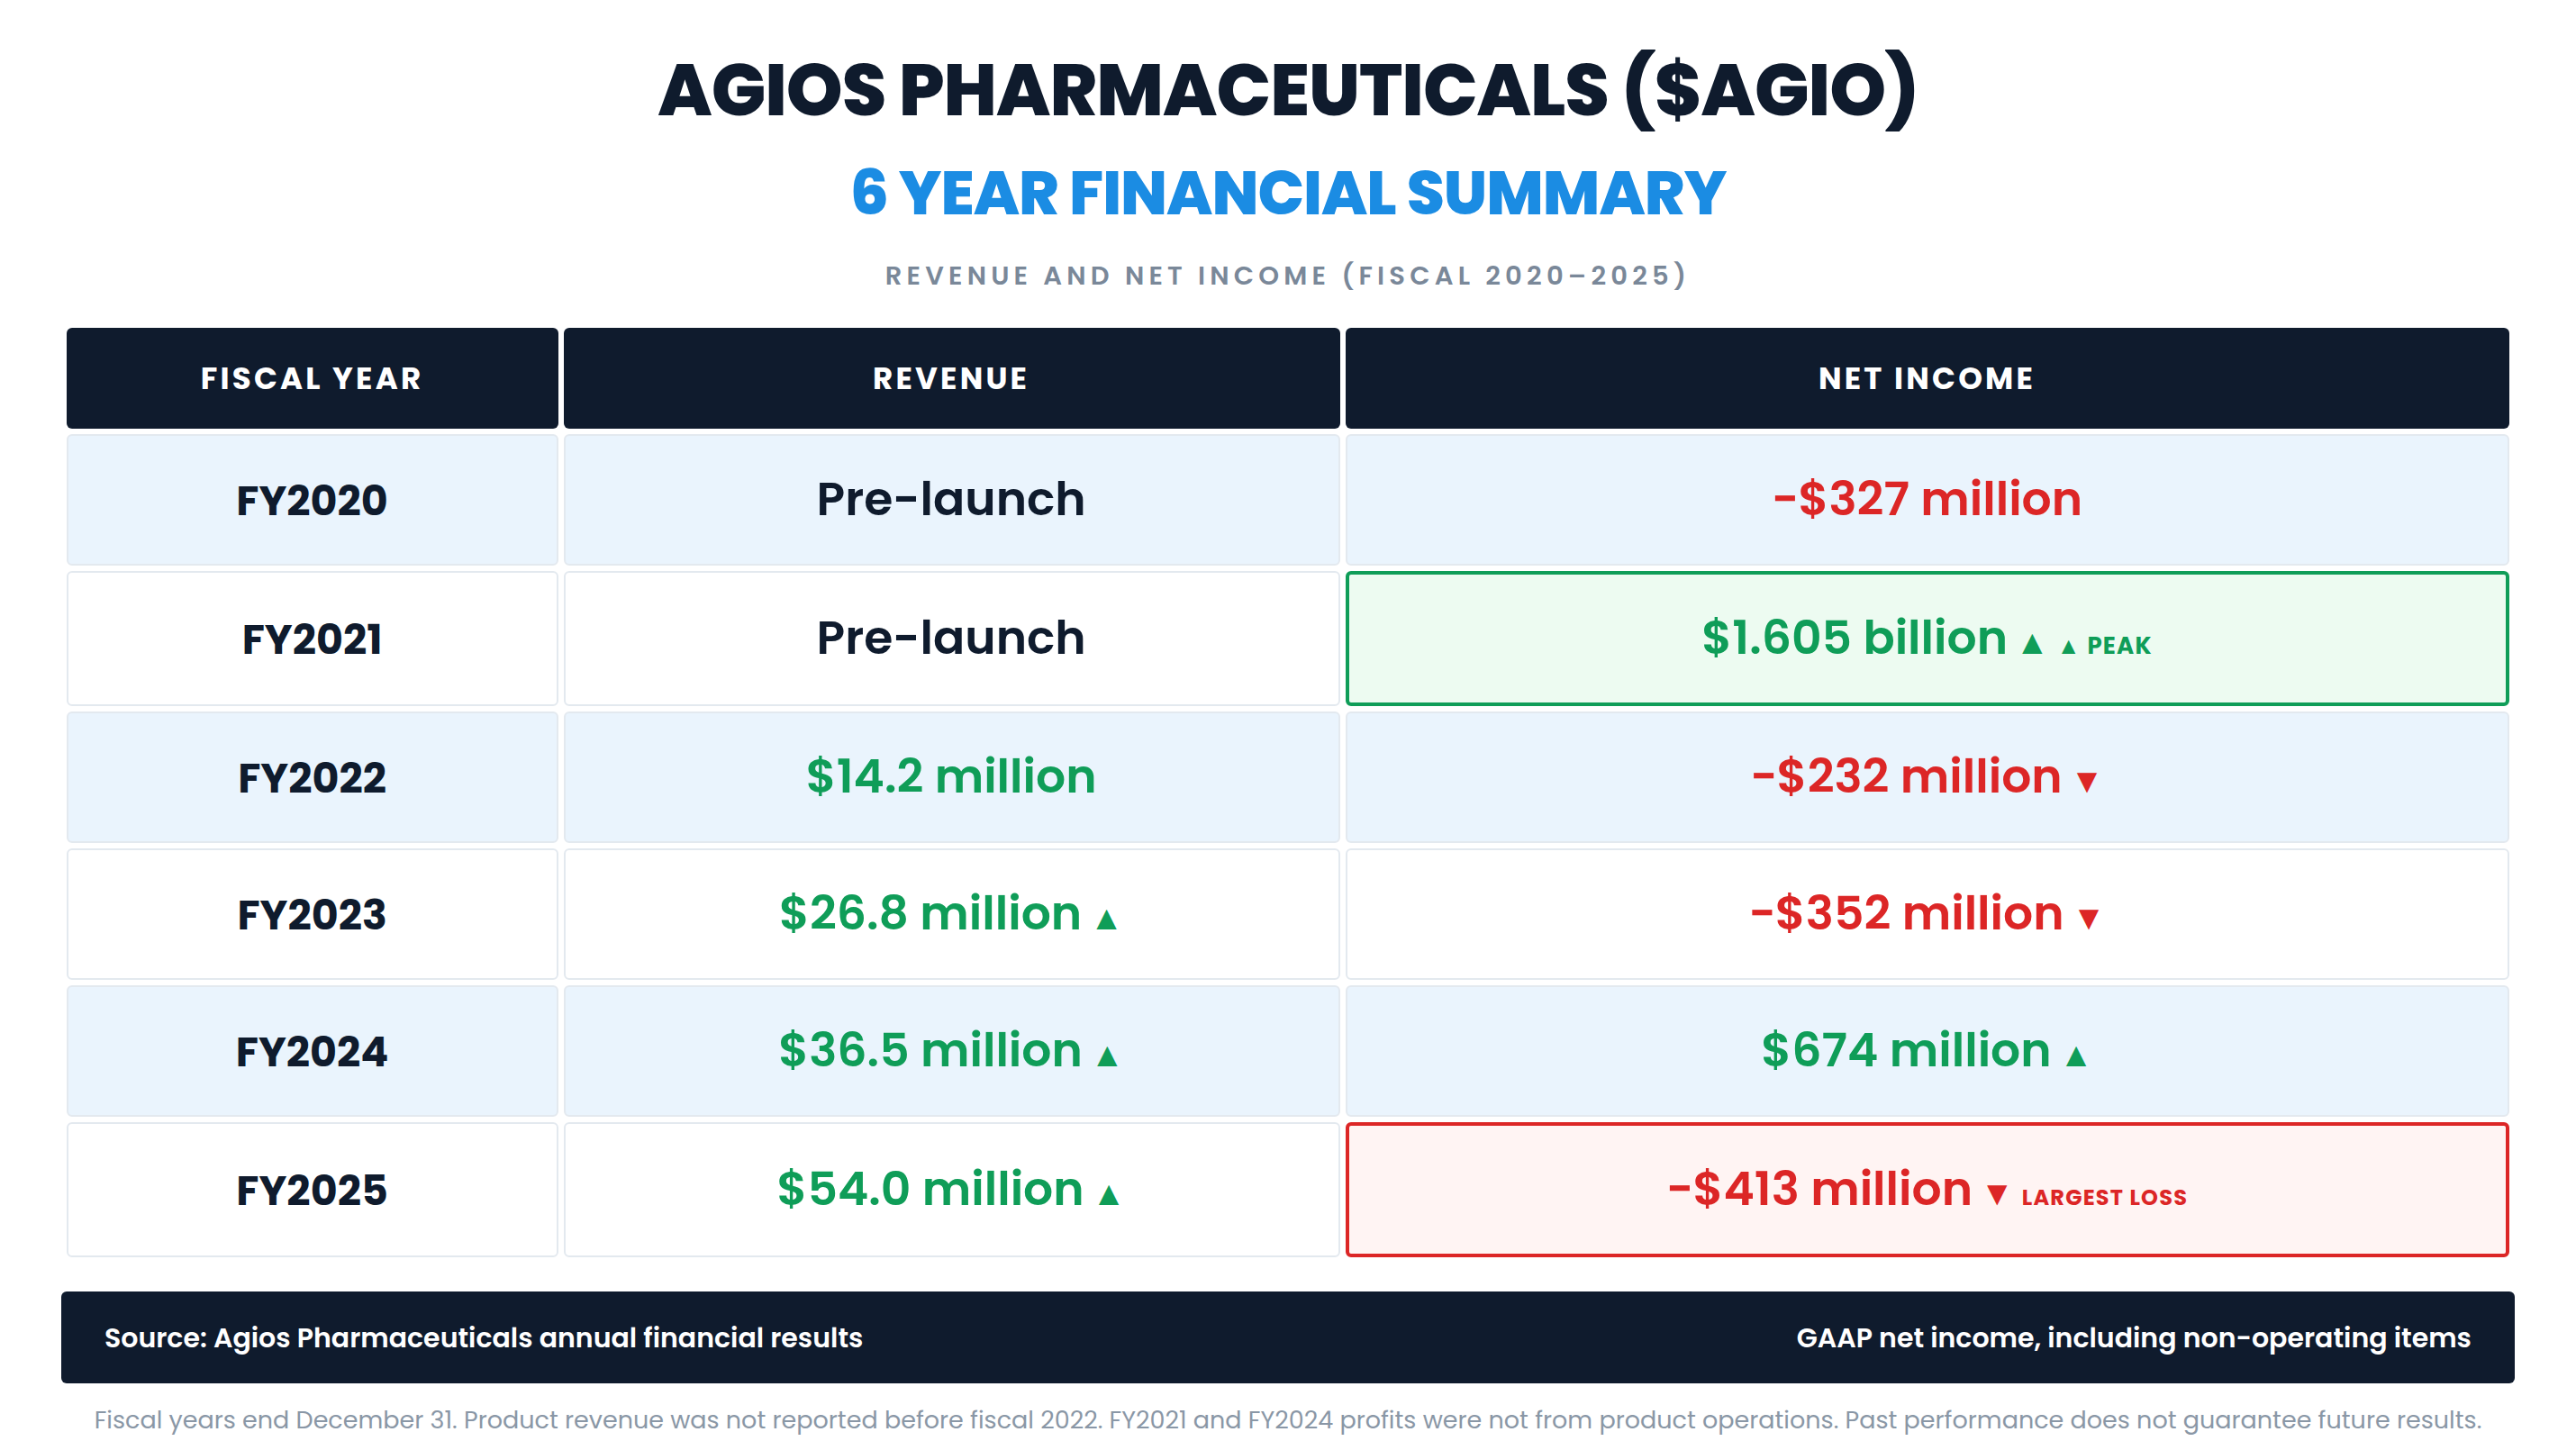
Agios uses a calendar fiscal year. Product revenue was not reported in fiscal 2020 or fiscal 2021, which were the last years before PYRUKYND reached the market. Revenue was $14.2 million in fiscal 2022, the first year of commercial sales. It rose 88.36% to $26.8 million in fiscal 2023, 36.07% to $36.5 million in fiscal 2024, and 48.03% to $54.0 million in fiscal 2025. From the first commercial year to fiscal 2025, product revenue nearly quadrupled. It is still a small revenue base for a company with a market value of about $2.19 billion at the October 20 close.
Net income does not follow that revenue line. Agios lost $327 million in fiscal 2020, then reported a profit of $1.605 billion in fiscal 2021, or $26.55 per diluted share, the peak in the table. It lost $232 million in fiscal 2022 and $352 million in fiscal 2023. Fiscal 2024 produced another profit, $674 million, or $11.64 per share. Fiscal 2025 swung back to a loss of $413 million, or $7.12 per share, the largest loss in the six-year table. The operating line never turned positive. The operating loss was $378 million in fiscal 2021, $426 million in fiscal 2024, and $472 million in fiscal 2025.
Here is the number the annual table hides. The fiscal 2024 profit of $674 million arrived in a year when the operating loss was $426 million. The distinction matters. That profit was not earned from the medicine business. After the FDA approved Servier’s vorasidenib, Agios received a $200 million milestone from Servier and a $905 million payment from Royalty Pharma under a royalty purchase agreement announced in May 2024. Fiscal 2021 has the same shape. The $1.605 billion profit arrived in the year the oncology sale to Servier closed, against a $378 million operating loss. A reader who stops at the profit column will think Agios has already proved it can earn money. The operating line says it has not.
The same gap shows up in spending. Fiscal 2025 research and development expense was $339.5 million, against $54.0 million of revenue. Research spending was 6.28 times revenue. Gross margin was about 88%, so the loss is not a cost-of-goods problem. It is the cost of developing and launching a rare-disease franchise that is still small.
The balance sheet is the offset. At June 30, 2026, Agios held $99.6 million in cash, $517.9 million in short-term investments, and $347.3 million in long-term investments, together $964.8 million. That is 44.11% of the roughly $2.19 billion market value at the October 20 close. The company has no debt in the reported balance sheet. It has said that cash, cash equivalents, and marketable securities, together with expected product revenue and interest income, are expected to fund the U.S. thalassemia launch, preparation for a possible sickle cell launch, and the existing clinical programs. It did not give a specific runway date. Operating cash outflow was $176.2 million in the first half of 2026. The cash pile lowers near-term financing pressure. It does not make a binary FDA decision a small event.
The second quarter of 2026, reported on July 30, is the first clear look at the thalassemia launch. Revenue was $44.7 million, up 259.25% from $12.5 million a year earlier, and equal to 82.82% of all of fiscal 2025 revenue in a single quarter. The company said U.S. mitapivat revenue was $40.9 million, driven by the AQVESME launch that began in late January, and ex-U.S. revenue was $3.8 million, including early European demand after a May 2026 thalassemia approval. By June 30, 442 cumulative AQVESME prescriptions had been written by REMS-certified U.S. physicians. The net loss narrowed to $100.7 million from $112.0 million a year earlier. Diluted loss per share was $1.69, better than the year-ago $1.93, but $0.04 worse than the consensus loss estimate of $1.65.
What the quarter proves is that thalassemia can move the revenue line by a large percentage off a small base. What it does not prove is that the franchise can cover its spending, or that the sickle cell application will clear the FDA. The pain-crisis result that cut the stock in half last November has not been replaced by a new pivotal trial. The company is asking the agency to accept a hemoglobin response, under accelerated approval, as enough to start.
Traders are really asking two questions now. First, will the FDA treat the hemoglobin response from the RISE UP trial as sufficient for accelerated approval on November 1, even though the trial missed statistical significance on pain crises? Second, if the answer is yes, can the thalassemia launch keep scaling fast enough to justify a market value that is still many times trailing revenue?
The bullish evidence is concrete. Product revenue has risen every year since the launch. The second quarter was larger than three of the four full commercial years that preceded it. The FDA has already granted Priority Review, and the stock rose 17.71% on July 7, the day that acceptance was announced. Thalassemia approval on December 23, 2025, was followed by an 18.63% gain on December 24. The company holds $964.8 million in cash and investments and carries no reported debt. Six analysts are in the current consensus, four of them bullish and none bearish, with an average target of $43.33.
That is also where the market could be wrong. The main risk case has three parts. The first is the trial itself. On November 19, 2025, Agios reported that RISE UP met its hemoglobin-response endpoint and missed statistical significance on the annualized rate of sickle cell pain crises. A key fatigue measure was also missed. The stock fell 50.89% that day, from a prior close of $45.49 to $22.34, and traded as low as $22.24 after a prior-day high of $46.00. Accelerated approval is a path around that miss, not a verdict that the miss did not matter. The second risk is concentration. Tebapivat is no longer a backup in sickle cell disease, so November 1 is a test of the only late-stage expansion Agios has. The third is the launch itself. Novo Nordisk’s competing PK activator, etavopivat, is also moving toward its own regulatory submission, so a first approval would not mean an uncontested market. AQVESME requires a REMS because of liver-injury risk, and 442 prescriptions is an early figure, not a mature franchise. The biggest risk is that the story is wearing a convincing disguise: a rising chart and a dated FDA decision can look like confirmation of a turnaround that the pivotal pain-crisis result has not delivered.
The catalyst calendar is short and specific. The FDA goal date for the sickle cell application is November 1, 2026. Third-quarter results are scheduled for November 5, 2026, before the open, with a conference call at 8:00 a.m. Eastern. Consensus calls for a loss of $1.24 per share on revenue of about $52 million, compared with a loss of $1.78 per share and revenue of $12.9 million in the year-ago quarter. Traders should watch U.S. AQVESME prescription growth, any comment on the REMS, ex-U.S. thalassemia demand, cash use, and whether management still frames November 1 as an accelerated-approval decision rather than a delay. Agios does not pay a regular dividend, and it has not paid a special dividend. There is no income cushion under the event.
This setup suits swing traders and event traders who can hold through a decision that has already produced a 50% single-day decline, and who size the position for that kind of move. Over the past 20 sessions, the average daily range was $1.39, or 4.30% of the prior close. It is a poor fit for anyone looking for a dividend, a slow compounder, or a stock whose next move depends on a routine earnings beat. The same shares fell 22.97% on April 20, 2026, rose 17.71% on July 7, and rose 16.99% across October 19 and 20.
The early-warning signal to watch is whether the two-day jump holds. On October 20 the stock opened at $35.04, just above the October 19 close, and its low of $35.02 stayed above that close, so the second session left no gap below. A close back below the October 19 close of $34.90 would be the first sign that the sector-driven move is fading. A close below the October 16 close of $31.32 would say the market has given the whole jump back, and a close below the October 14 low of $29.67 would erase the bounce and put the stock back at the bottom of its October range, with the FDA decision still ahead. Neither level matters as much as November 1. A positive decision can overwhelm a weak chart. A rejection can overwhelm a strong one.
So the picture heading into this week is a one-drug rare-disease company with a real launch, a large cash balance, a trial that missed the endpoint patients feel, and a share price that has risen sharply into the decision. The trend says stay interested. The volatility says stay alert. With that in mind, here is what the professional analyst community currently expects.
Wall Street Analysts Annual Forecasts
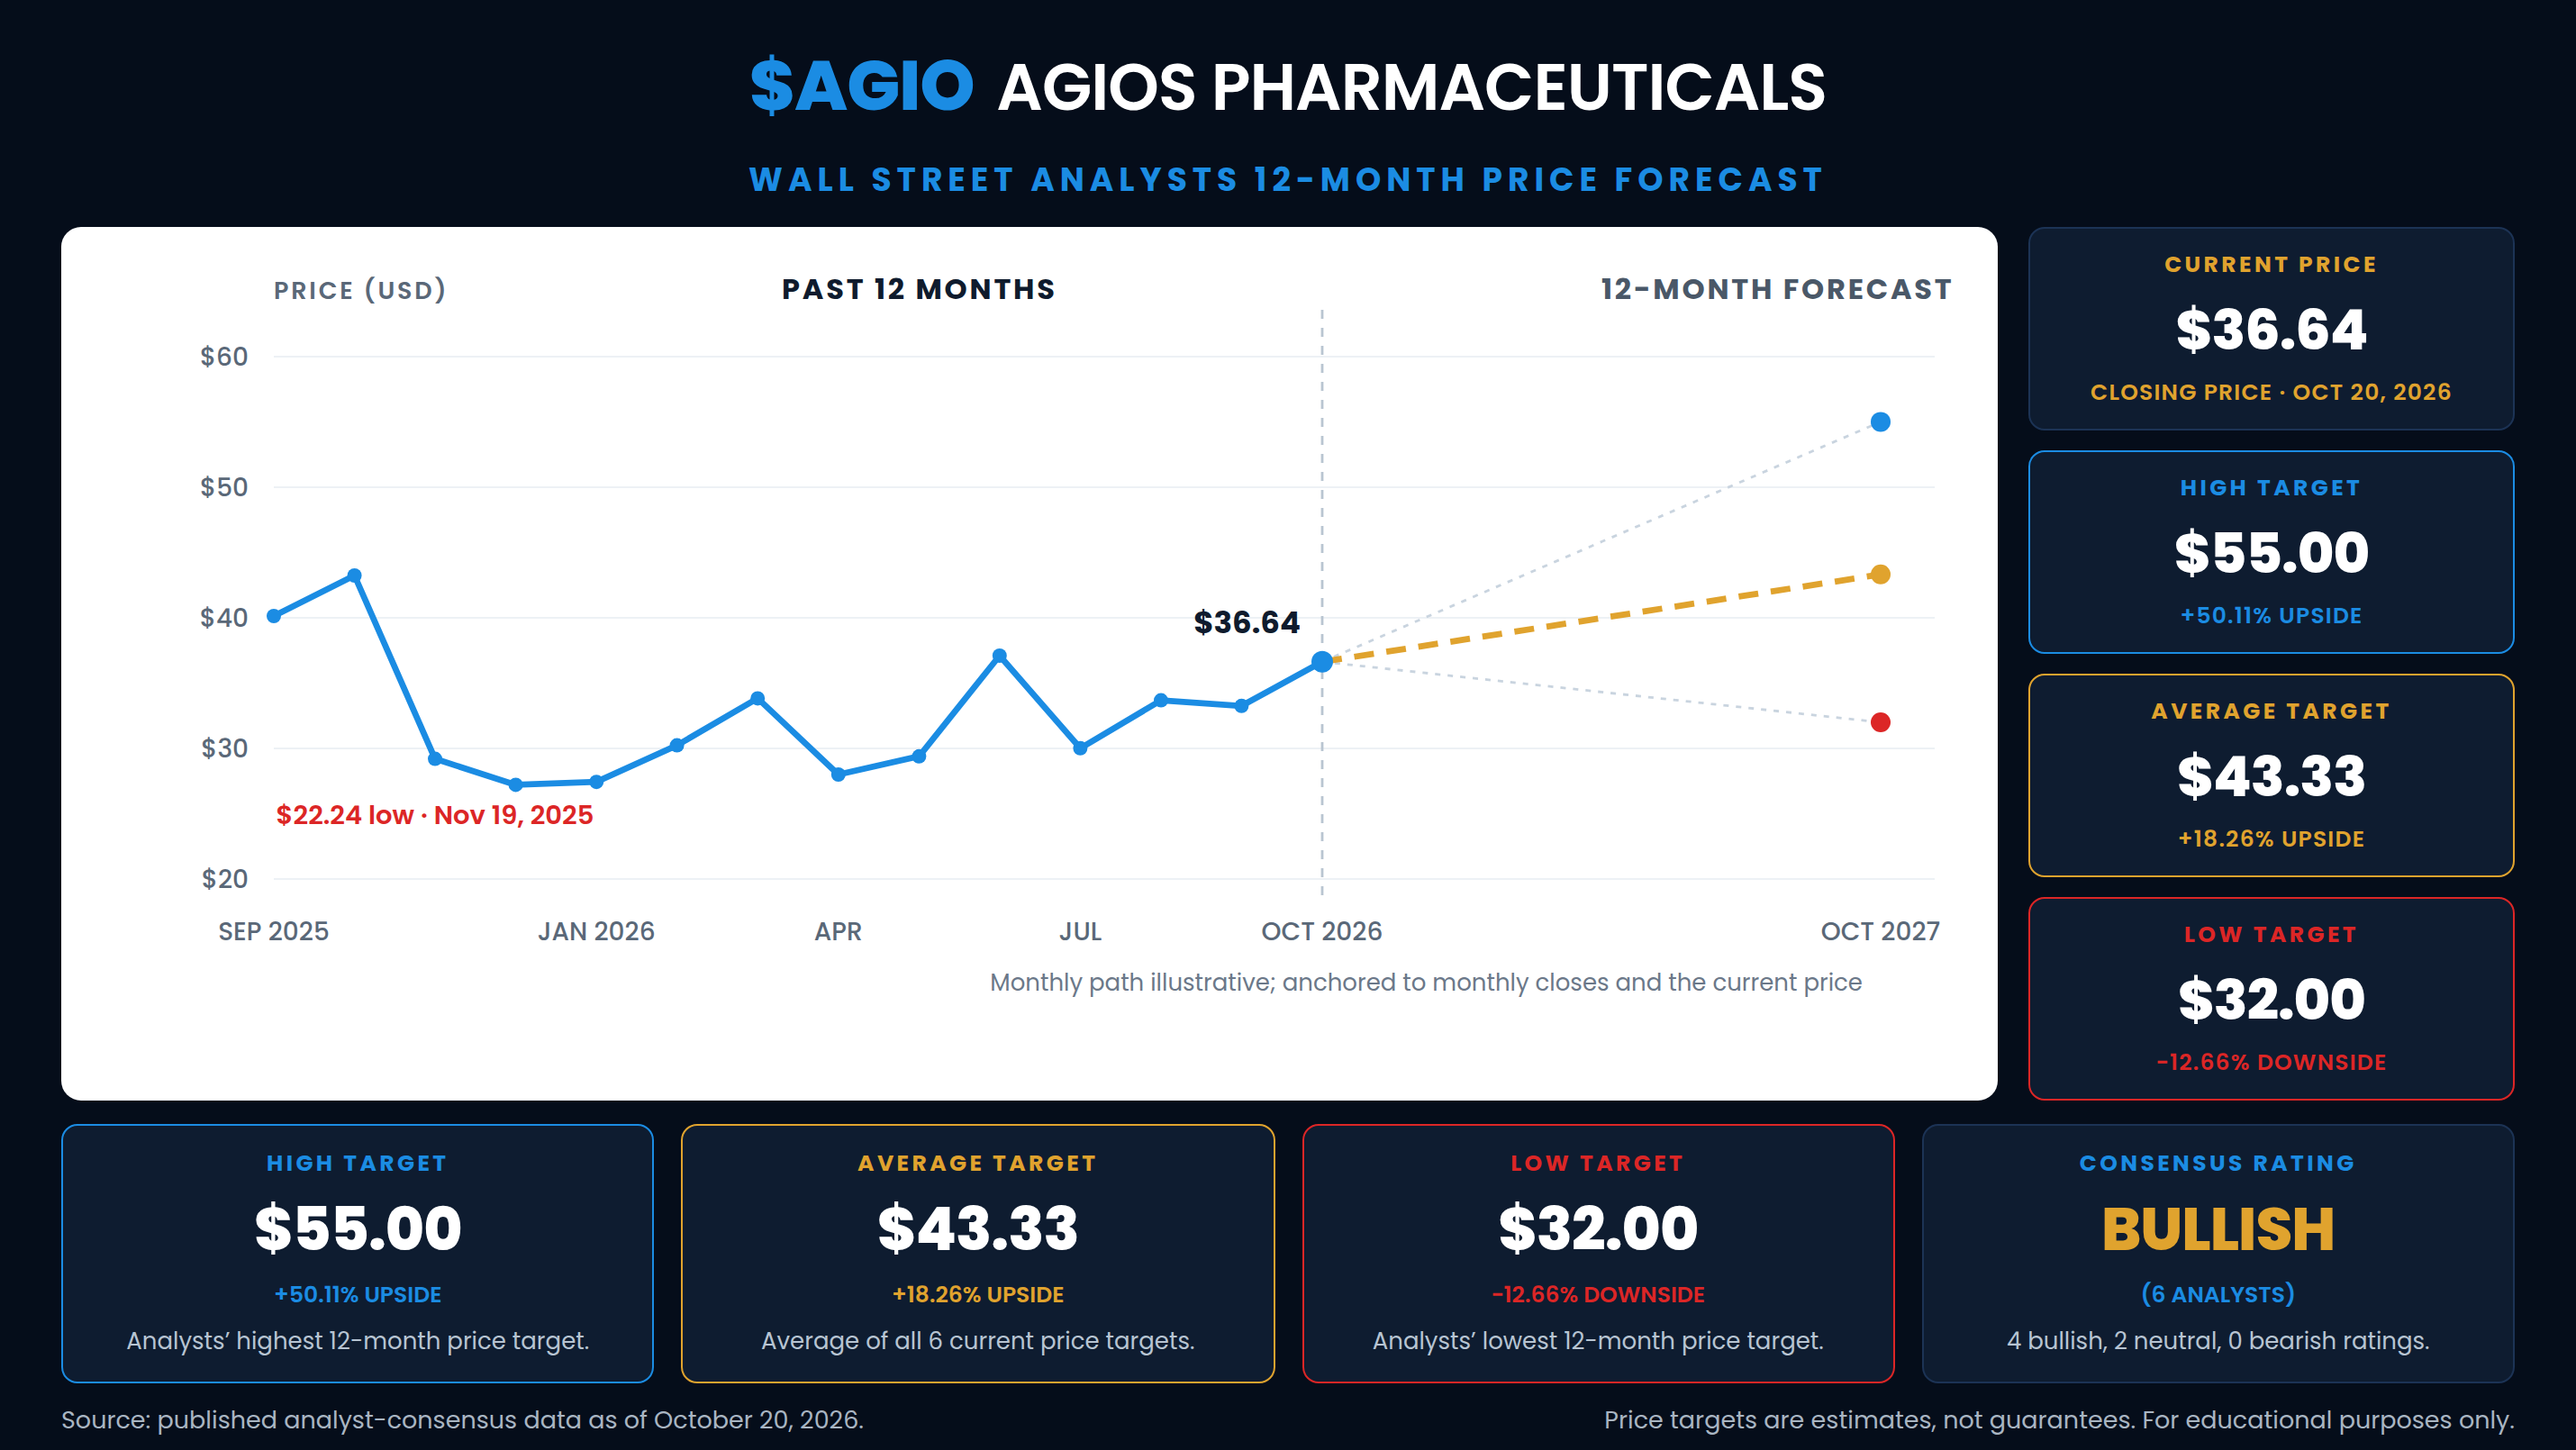
Six analysts are included in the current published consensus for Agios Pharmaceuticals, and the consensus leans bullish, with four bullish ratings, two neutral ratings, and no bearish ratings. The average 12-month price target is $43.33, the median target is $43.50, the high target is $55.00, and the low target is $32.00.
Measured against the October 20, 2026 close of $36.64, the average target implies an 18.26% gain. The median target implies an 18.72% gain. The high target implies a 50.11% gain. The low target implies a 12.66% decline. The spread between the high and low target is $23.00, which is 62.77% of the current share price.
The revision trail shows a split that the average conceals. The $55 high target belongs to HC Wainwright, which holds a bullish rating and raised its target from $52 to $55 on July 30, 2026, the day of the second-quarter report. Citigroup holds a bullish rating at $52, set on July 31. Bank of America holds a bullish rating at $50, raised from $46 on September 21. Truist holds a bullish rating at $37, cut from $39 on October 7. On the neutral side, JPMorgan holds a Neutral rating at $34, raised from $31 on August 7, and the $32 low target belongs to RBC Capital, at Sector Perform, raised from $28 on July 7. Older ratings from Leerink Partners and Goldman Sachs are no longer included in the current consensus, which is why the average rose even though no target has been raised since September.
The practical takeaway is that the stock has rallied through the lower end of the target range. Four of the six targets sit above $36.64, and two sit below it. JPMorgan’s $34 is 7.21% under the close and RBC’s $32 is 12.66% under it. Truist’s $37, the most recent revision, is now only 0.98% above the close. The large upside in the average comes from three targets at $50 or higher, all set in July or September, before this month’s bounce. If November 1 is an approval, those older targets may still be the right frame. If it is a delay or a rejection, the targets near the current price are the ones that already reflect skepticism. Price targets are estimates of what a security might be worth over a twelve-month horizon under a specific set of assumptions. They are not certainties.
52-Week High and Low Boundaries Analysis
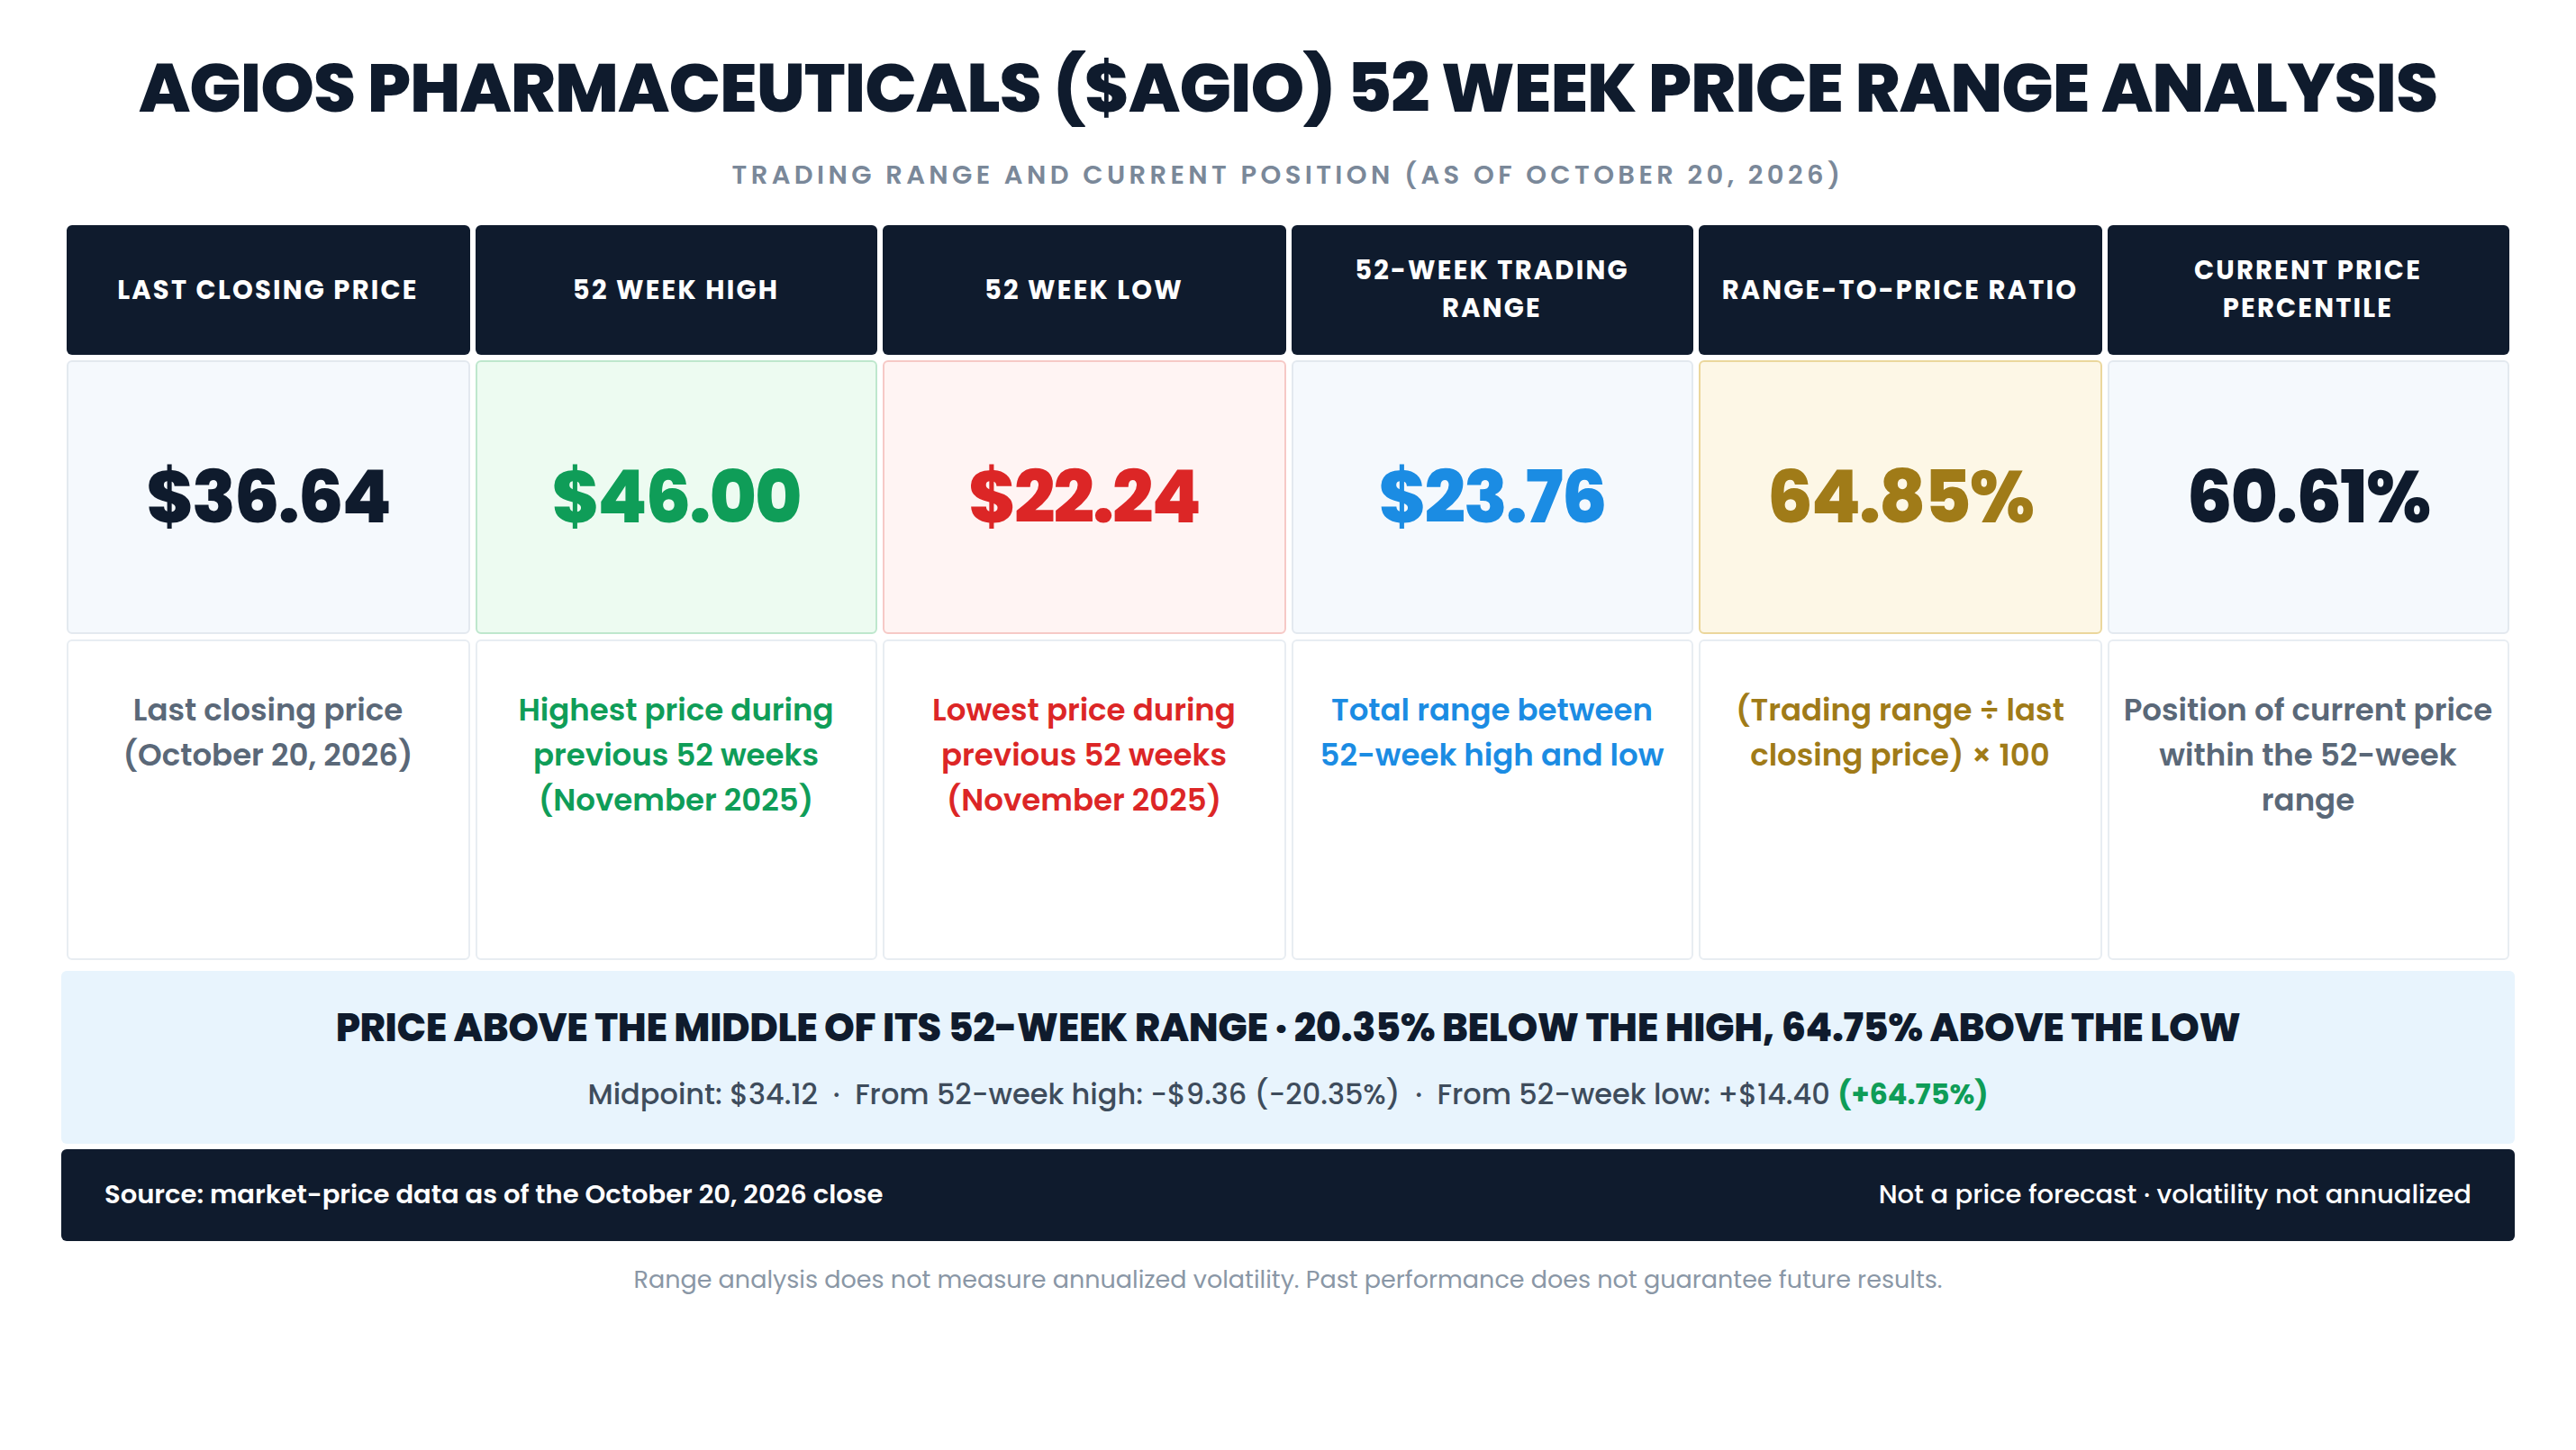
AGIO’s 52-week high is $46.00, set on November 18, 2025, and its 52-week low is $22.24, set on November 19, 2025.
The 52-week trading range is $23.76. Divided by the $36.64 closing price, that produces a range-to-price ratio of 64.85%, meaning the distance between the year’s high and low is close to two-thirds of today’s share price. The stock sits at the 60.61st percentile of its range. The midpoint of the range is $34.12, and the October 20 close is 7.39% above that midpoint, a gap of $2.52. The stock needs a 25.55% gain, or $9.36, to reach the 52-week high, and it is 64.75% above the 52-week low.
That combination is unusual. The high and the low were set on back-to-back sessions. AGIO is not grinding through a wide range built over a year. It is living inside a range that was created in two days, when the RISE UP readout took the stock from a $46.00 high to a $22.24 low. The October 20 close has climbed clearly above the mathematical middle of that shock. Reclaiming the midpoint is a start. It is not a recovery of the pre-readout price, which still sits 25.55% above the current close.
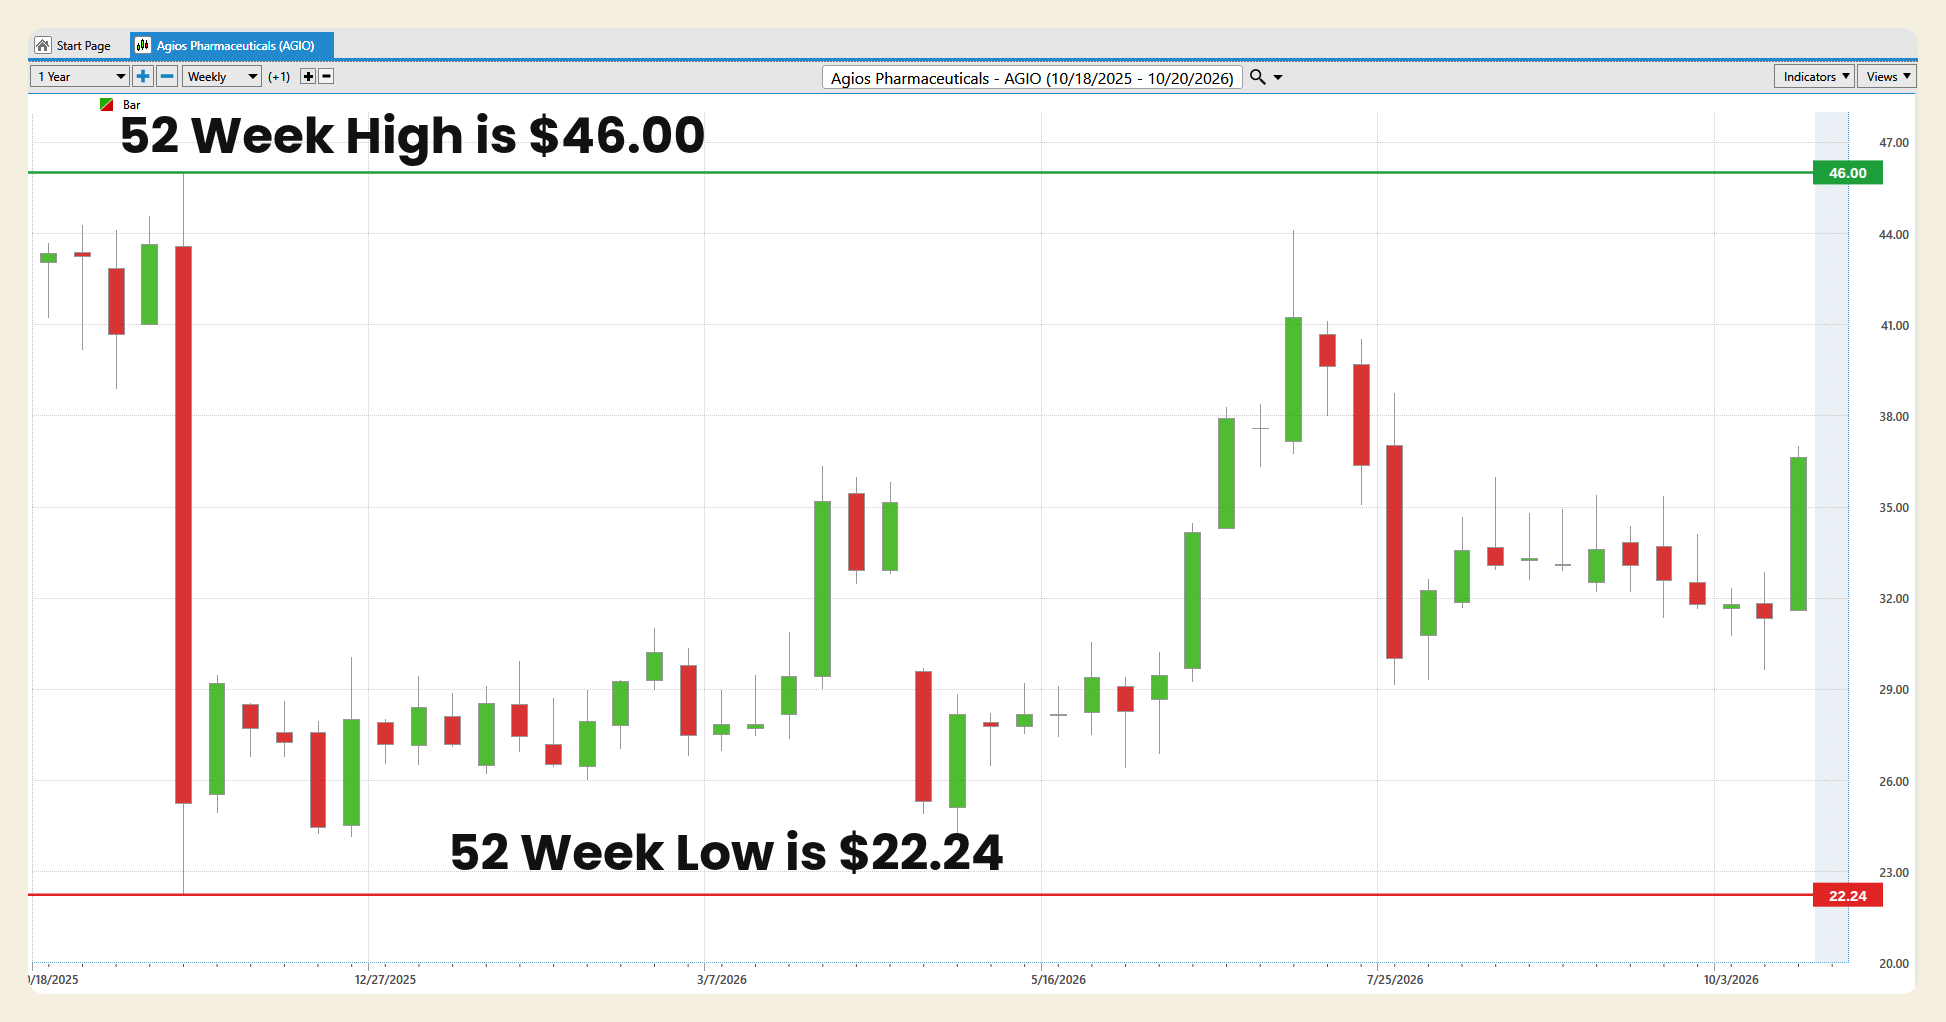
The one-year weekly chart is a crash, a base, a failed rally, and the start of another attempt. The left side of the chart shows the stock in the low $40s in October 2025. The next major feature is a single enormous red candle in November 2025, the week of the RISE UP readout, with a high at $46.00 and a low at $22.24. December and January based in the mid-$20s. The stock then worked higher through the spring, with a setback in April, and spiked in early July to a weekly high of $44.09 on the Priority Review announcement. That rally failed. July, August, and September gave back the spike, and early October pressed the stock down to an October 14 low of $29.67. The final candle turns up sharply. The current week, through October 20, has opened at $31.61 and traded as high as $37.00, its highest intraday level since July 28. The pattern is a stock that can reprice by half in a week, and that has not yet rebuilt the level it lost last November.
Best-Case/Worst-Case Analysis
The best-case historical moves are large. From its June 16, 2022 intraday low of $16.75, AGIO rose 273.61% to its November 11, 2024 high of $62.58. From the November 19, 2025 low of $22.24, it has gained 64.75% to the October 20 close, and it reached 98.25% above that low at the July 7, 2026 intraday high of $44.09. Single sessions have been enough to reset the chart: the stock rose 18.63% on December 24, 2025, the session after the thalassemia approval, 17.71% on July 7, 2026, and 11.43% on October 19, 2026, followed by another 4.99% on October 20.
The worst-case historical moves are faster. From the November 11, 2024 high of $62.58, the stock fell 64.46% to the November 19, 2025 low of $22.24. Inside that decline, the readout week did most of the damage in two sessions: from the November 18 high of $46.00 to the November 19 low of $22.24, a drop of 51.65%. The close-to-close decline on November 19 was 50.89%. More recently, the stock fell 22.97% on April 20, 2026, and 6.74% on July 21, 2026, the day tebapivat development in sickle cell disease was discontinued. From the July 7 close of $44.01 to the October 20 close, the stock is down 16.75%, even after this week’s jump.
Historical gains are not forecasts, and historical losses are not predictions. What these figures show is that this stock has real capacity for movement in both directions, and that a single trial headline has already cut it in half inside one session. Position sizing and an exit plan matter, particularly with the November 1 decision 12 days from the October 20 close and earnings four days after that.
The condition that keeps the bull case alive is a decision that matches the path management has described: accelerated approval on or near the November 1 goal date, followed by evidence that AQVESME prescriptions and revenue are still building, while the stock holds above the October 19 close of $34.90 and, at a minimum, the October 16 close of $31.32. The change of character that would invalidate the thesis is a close back below the November 19, 2025 low of $22.24. That would say the market has rejected both the launch and the approval path, and it would resume the decline that the last year has only partly repaired. A nearer warning, short of that break, is a close below the October 14 low of $29.67 before the FDA has even spoken.
The upside opportunity is substantial but contingent.
Relative Strength Comparison
AGIO has lagged the major U.S. benchmarks over the past year, led them since the start of 2026, lagged again over three months, and led over the past month and the past week. All figures are price returns.
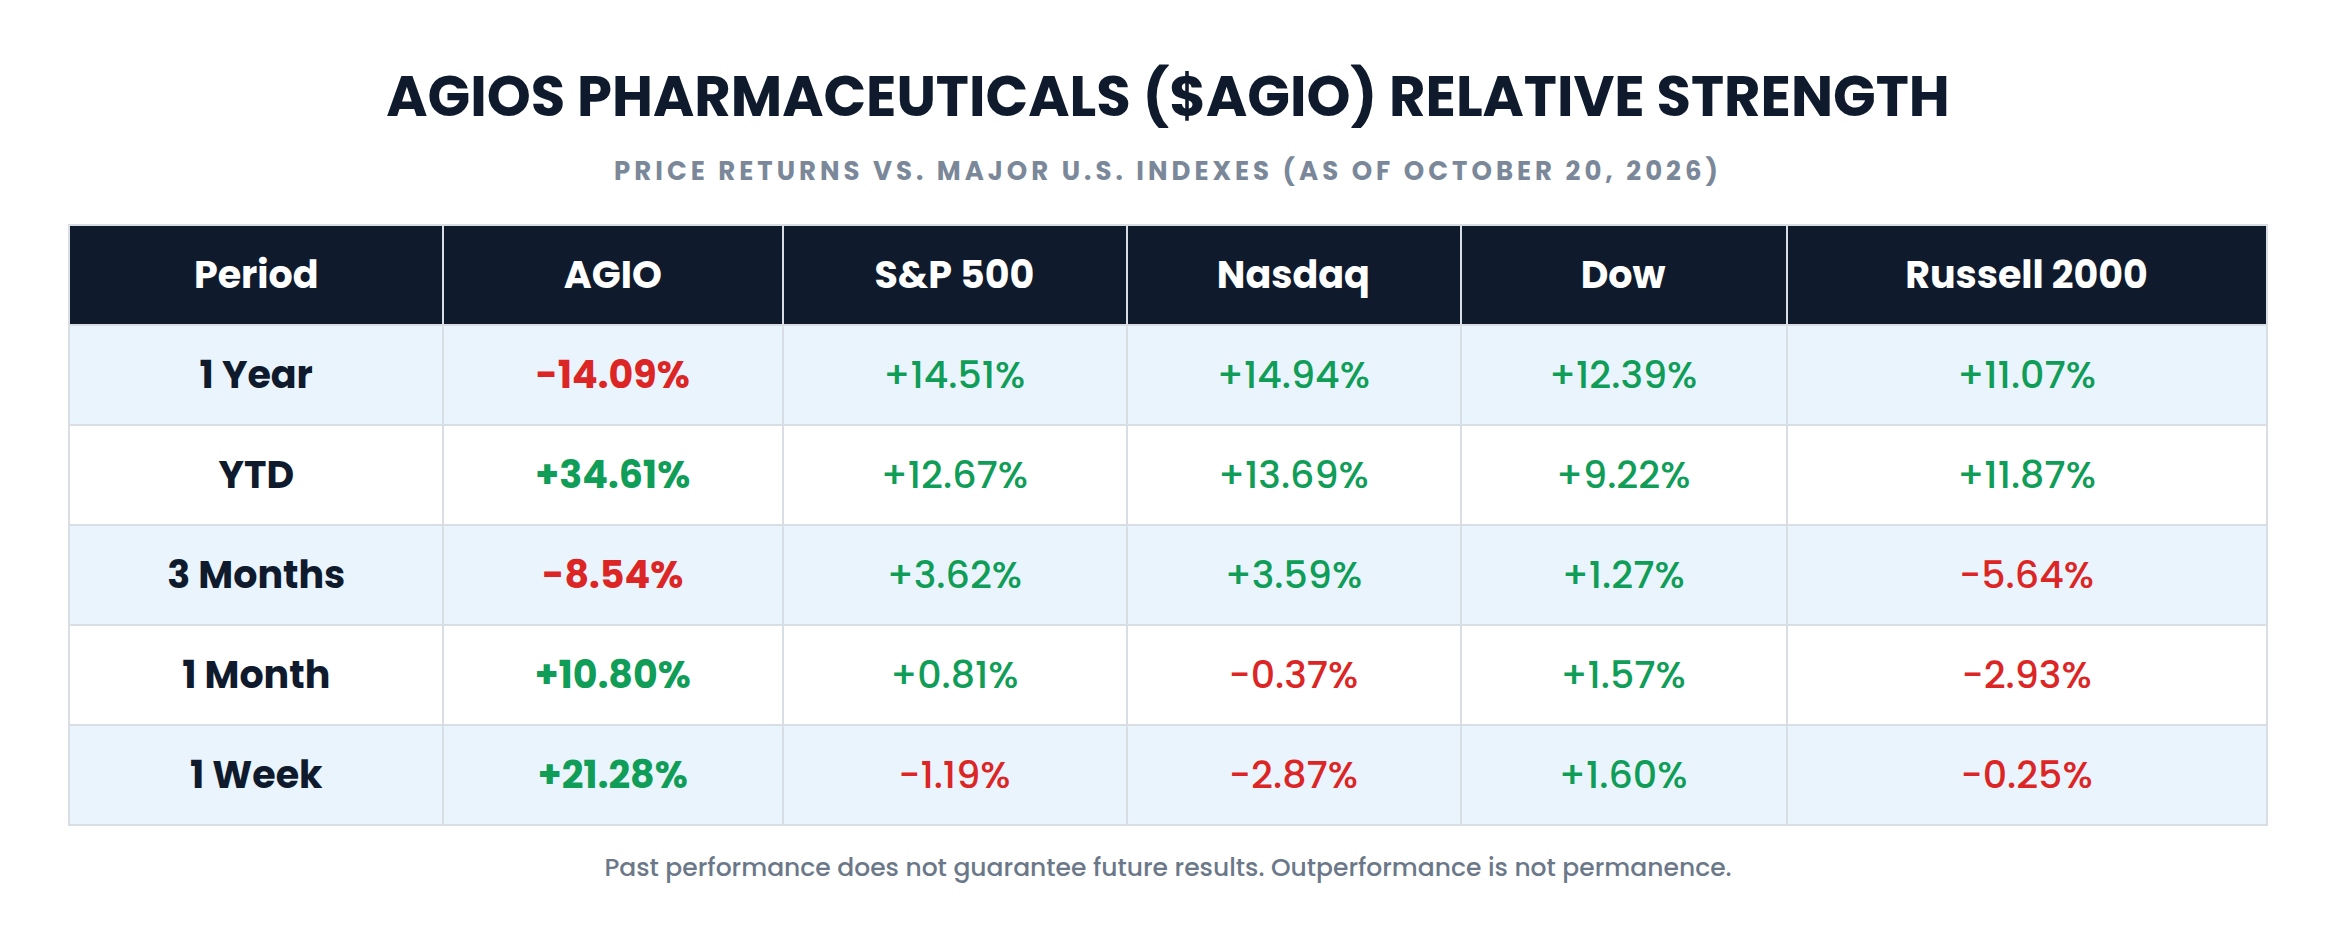
Returns are measured to the October 20, 2026 close from these starting closes: 1 Year, October 20, 2025; YTD, December 31, 2025; 3 Months, July 20, 2026; 1 Month, September 18, 2026; 1 Week, October 13, 2026. September 20, 2026 fell on a weekend, so the 1 Month window uses the prior session. S&P 500 refers to the S&P 500 Index, Nasdaq refers to the Nasdaq Composite, Dow refers to the Dow Jones Industrial Average, and Russell 2000 refers to the Russell 2000 Index.
This is a crash-and-repair pattern, not a steady leadership pattern. The one-year window starts at the October 20, 2025 close of $42.65, before the November readout. AGIO is down 14.09% over that year while the S&P 500 is up 14.51% and the Nasdaq is up 14.94%. The gap against the Nasdaq is more than 29 percentage points, and almost all of it was created in one week. Year to date, the window starts at the December 31, 2025 close of $27.22, after the crash. From there AGIO is up 34.61%, ahead of every index in the table by more than 20 percentage points. Over three months the lead disappears. The July 20 close was $40.06, the last session before the tebapivat discontinuation, and AGIO is down 8.54% from there while the S&P 500 is up 3.62%. Then the short windows flip again. Over one month AGIO is up 10.80% while no index gained more than 1.57%. Over one week it is up 21.28% while the Dow’s 1.60% was the only index gain.
It is worth being precise about what this kind of relative strength means. Most of the one-week lead came in two sessions, and the larger of them, October 19, was a sector move driven by news at Disc Medicine and Silence Therapeutics rather than an Agios announcement. A stock that has lagged for a year because of a trial miss can lead for a week because traders are positioning for the next headline. That can become a new trend. It can also be given back on the headline itself. Outperformance is not permanence.
VantagePoint AI Predictive Blue Line
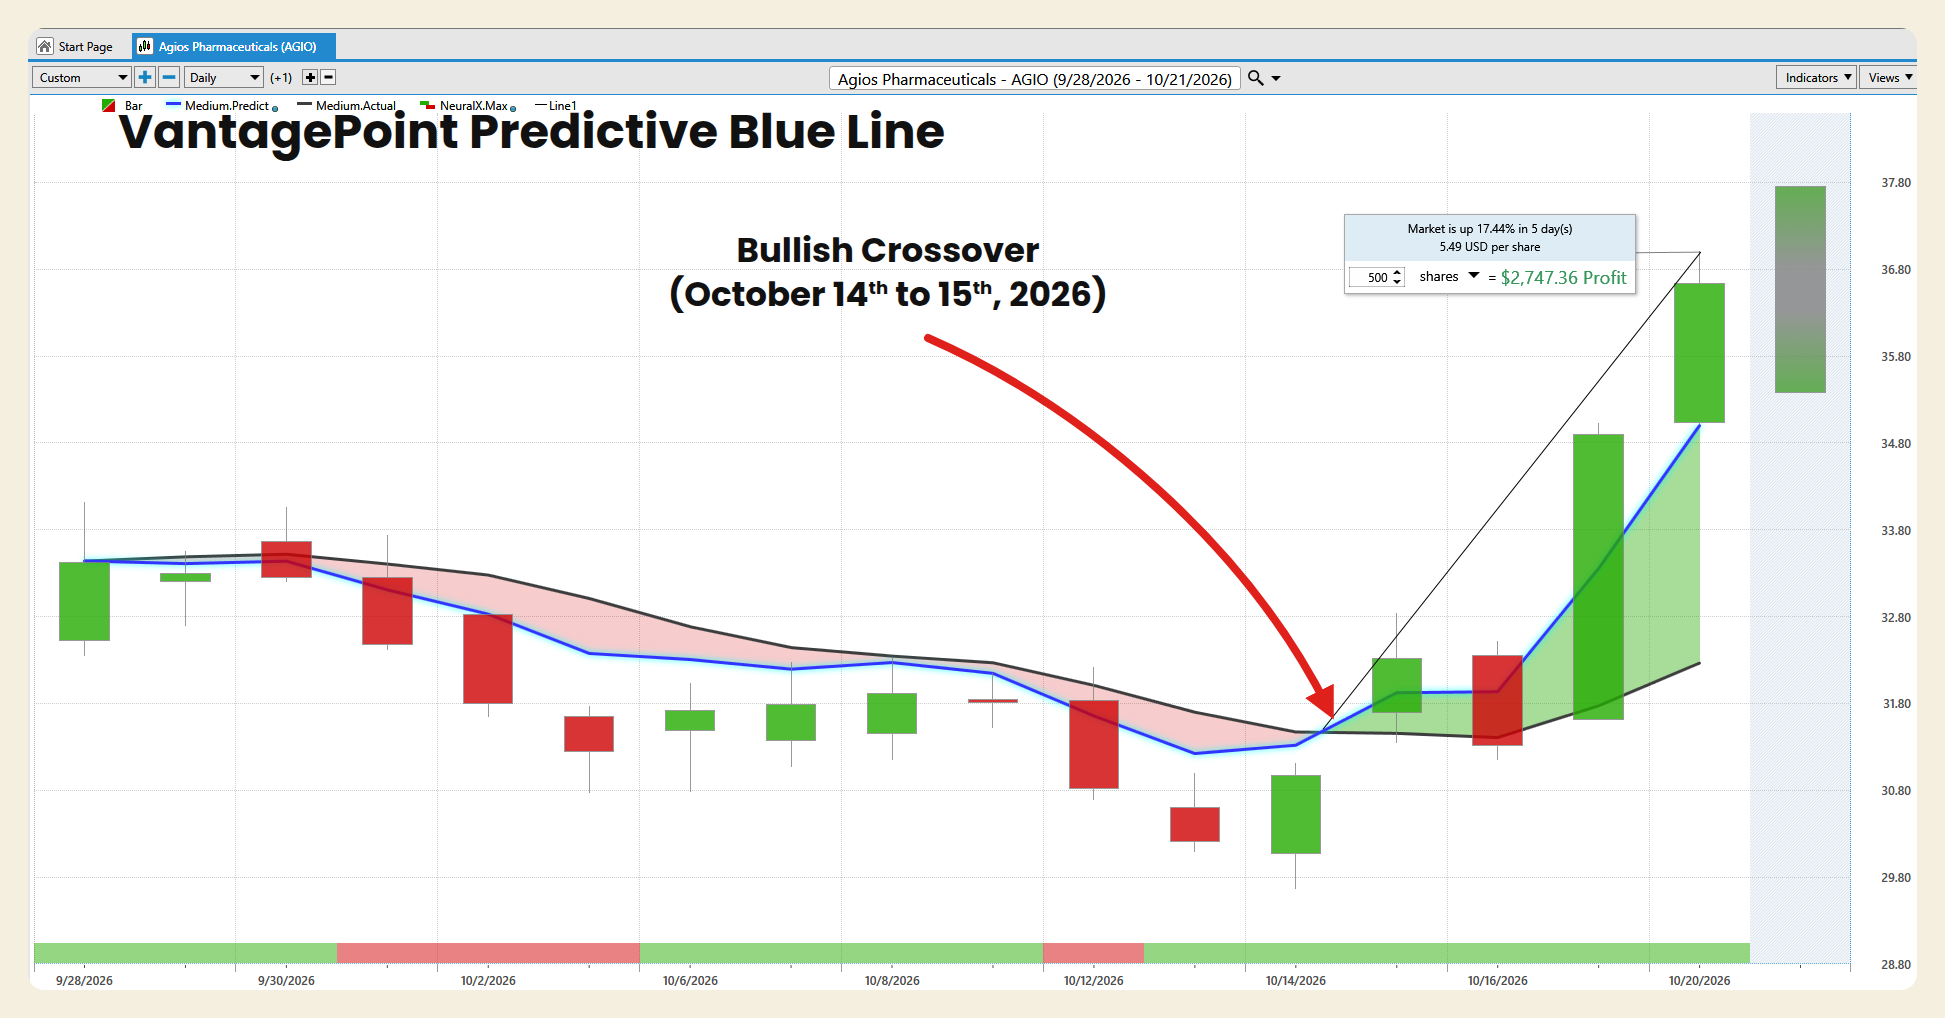
The VantagePoint AI Predictive Blue Line is a forecasted moving average that uses artificial intelligence to anticipate where the trend is heading, rather than simply reporting where it has been. The key reading is the relationship between the blue line and the black line, which represents the actual moving average of price. When the blue line is above the black line and rising, the forecast is pointing to strength ahead. When it crosses below, the forecast is warning of weakness.
The chart covers September 28 through October 20, 2026, with the forecast extending to October 21. From the start of the window through October 14, the Predictive Blue Line sat at or below the black actual moving average, and the band between them was shaded red as the stock drifted from the mid-$33s down toward $30. The two lines converged as the decline slowed. The blue line then crossed above the black line between the October 14 and October 15 sessions, and the shading turned green. That bullish crossover arrived while the stock was still closing near $31, two sessions before the October 19 jump, and more than two weeks before the FDA goal date.
Since the crossover, the blue line has stayed above the black line, and the green band has widened sharply as the blue line turned up through October 19 and 20. At the right edge of the chart, the blue line sits at approximately $35.00 and the black line at approximately $32.27, a separation of about $2.73. VantagePoint’s own measurement on the chart shows the market up 17.44%, or $5.49 per share, over 5 days from the crossover area. The October 20 close of $36.64 sits above both lines, which tells you price has run ahead of the forecasted trend as well as the actual one.
The distinction matters. The Blue Line turned before the October 19 jump, not because of it. The current reading is bullish, with a rising forecast and a widening separation. It is also a short reading. This chart covers about three weeks, not a completed trend. The reading that would change the picture is a flattening of the blue line followed by a cross back below the black line, especially if that cross arrives before November 1.
VantagePoint AI Neural Index
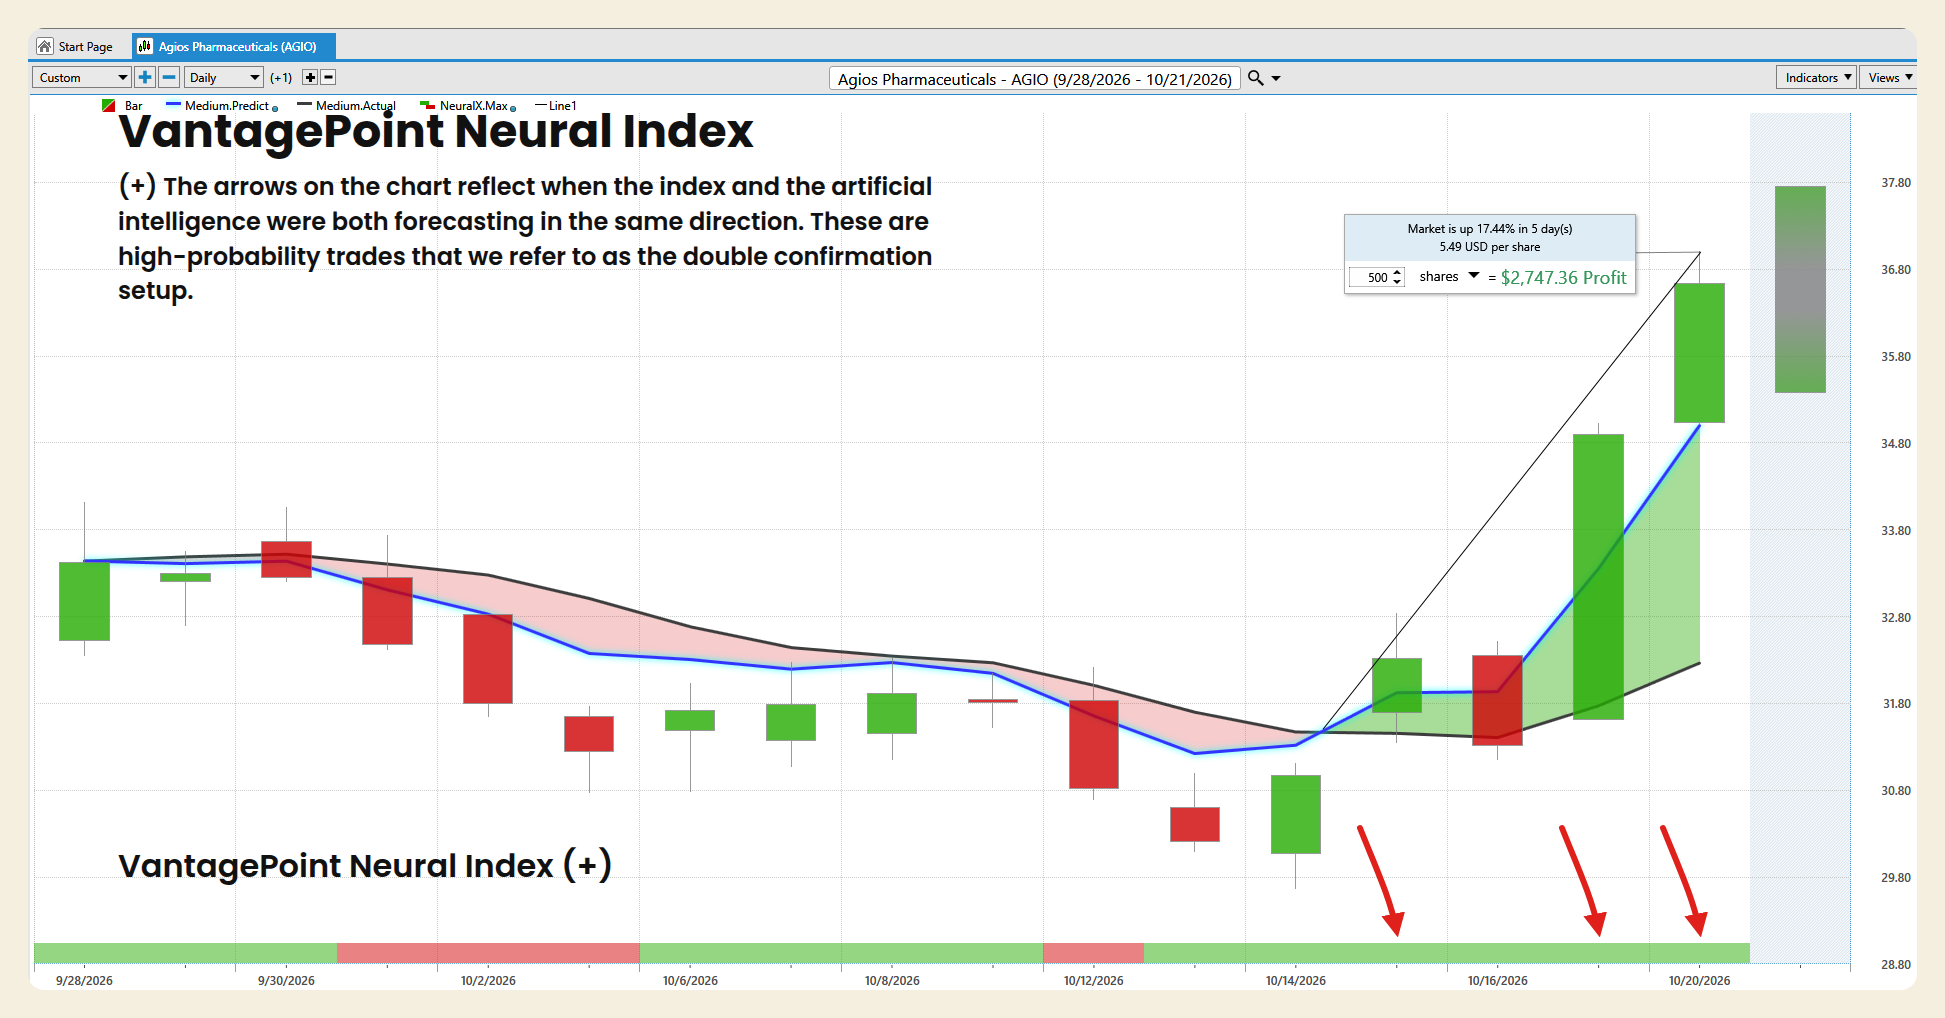
The VantagePoint AI Neural Index is a short-term strength indicator that forecasts whether the market is likely to be higher or lower over the next 48 hours. It appears as the colored strip along the bottom of the chart: green indicates predicted short-term strength and red indicates predicted short-term weakness.
The strip shows a change of character inside a short window, not a long trend. It was green on September 28, 29, and 30. It turned red for October 1, 2, and 5 as the stock slid toward $31. It was green again from October 6 through October 9, red for a single session on October 12, and then green from October 13 through October 20, six sessions in a row, covering the low and the full rebound.
When the Neural Index and the Predictive Blue Line agree, VantagePoint refers to the setup as a double confirmation. The blue line did not cross above the black line until between October 14 and 15. The green readings on October 13 and 14 therefore came before the crossover. The double confirmation window on this chart runs from October 15 through October 20, and the arrows mark October 15, 19, and 20. The item to watch is the next red reading. After a six-session green run and a 16.99% two-day gain, a red print would be the earliest sign that short-term momentum is cooling, even if the Blue Line still points higher.
VantagePoint AI Daily Range Forecast
The VantagePoint AI Daily Range Forecast projects a predicted high and a predicted low for the next trading session. The red line marks the predicted high and the dark line marks the predicted low. Together they frame where price is expected to trade, giving traders a structure for entries, exits, and stop placement.
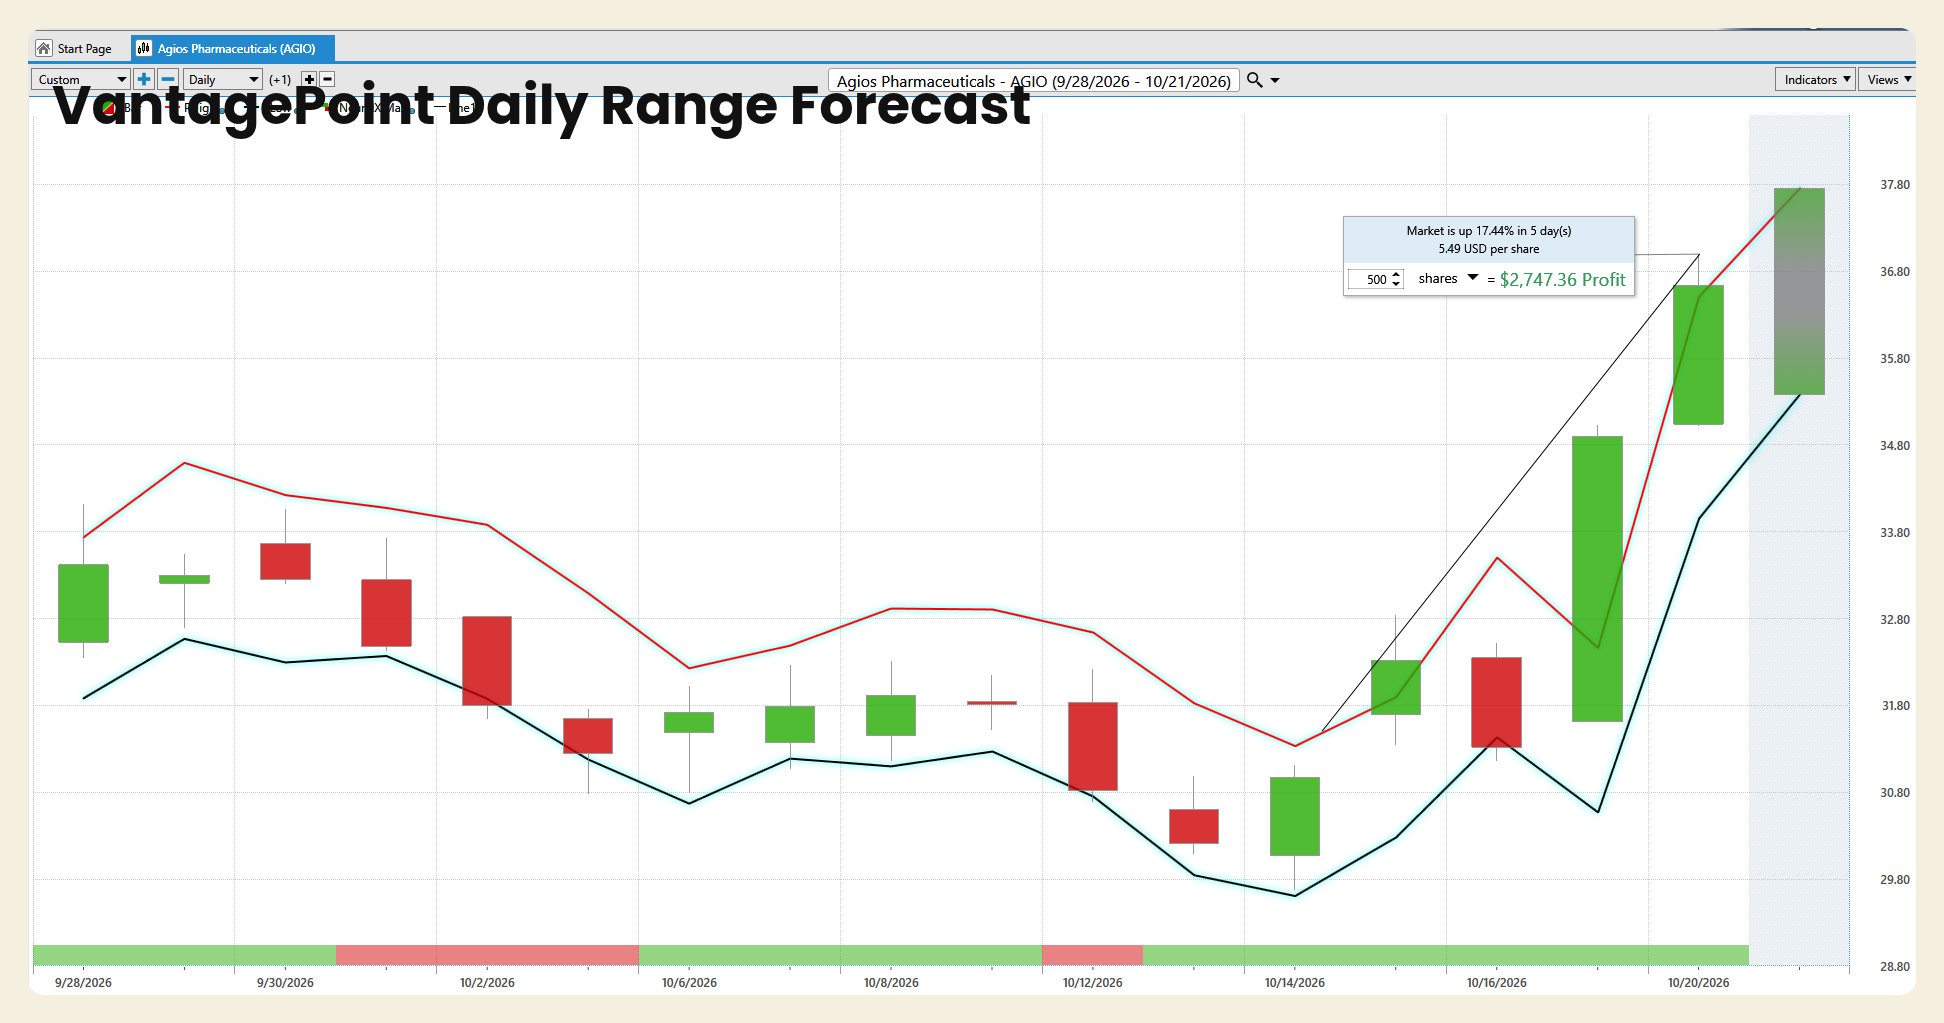
For October 21, 2026, the forecast bar spans from a predicted high of approximately $37.75 to a predicted low of approximately $35.38, a projected range of about $2.37, or 6.47% of the October 20 close. That is wider than the stock’s recent behavior. Across the past 20 sessions, the average daily range was $1.39, or 4.30% of the prior close. The forecast is expecting another active session. The October 20 close of $36.64 sits inside the band, about $1.11 below the predicted high and about $1.26 above the predicted low, close to the roughly $36.57 midpoint.
The more important observation is the direction of both boundaries. The predicted high and the predicted low have been rising steeply into the right edge of the chart, through the October rebound. When both boundaries rise together, the forecast is describing a trending market rather than a range-bound one. The projected band for October 21 sits almost entirely above the October 19 close of $34.90, which means the forecast is framing the next session around the new, higher price level rather than a return to last week’s range.
For a trader, the practical use is straightforward. A pullback toward the predicted low, near $35.38 for October 21, would be a test of the short-term trend rather than a break of it, and it would still leave the stock above the October 19 close. A close below the predicted low, especially on a day when the Neural Index turns red, would be the first sign that the rising structure is weakening. Upper-band trading near $37.75 is the zone where short-term traders tend to tighten stops rather than chase, particularly with a binary FDA date 12 days away.
Intermarket Analysis
No stock trades in isolation. VantagePoint’s Intermarket Analysis identifies the related markets whose price behavior has the greatest influence on the forecast for a given stock, and it feeds those relationships into the AI models behind the readings above.
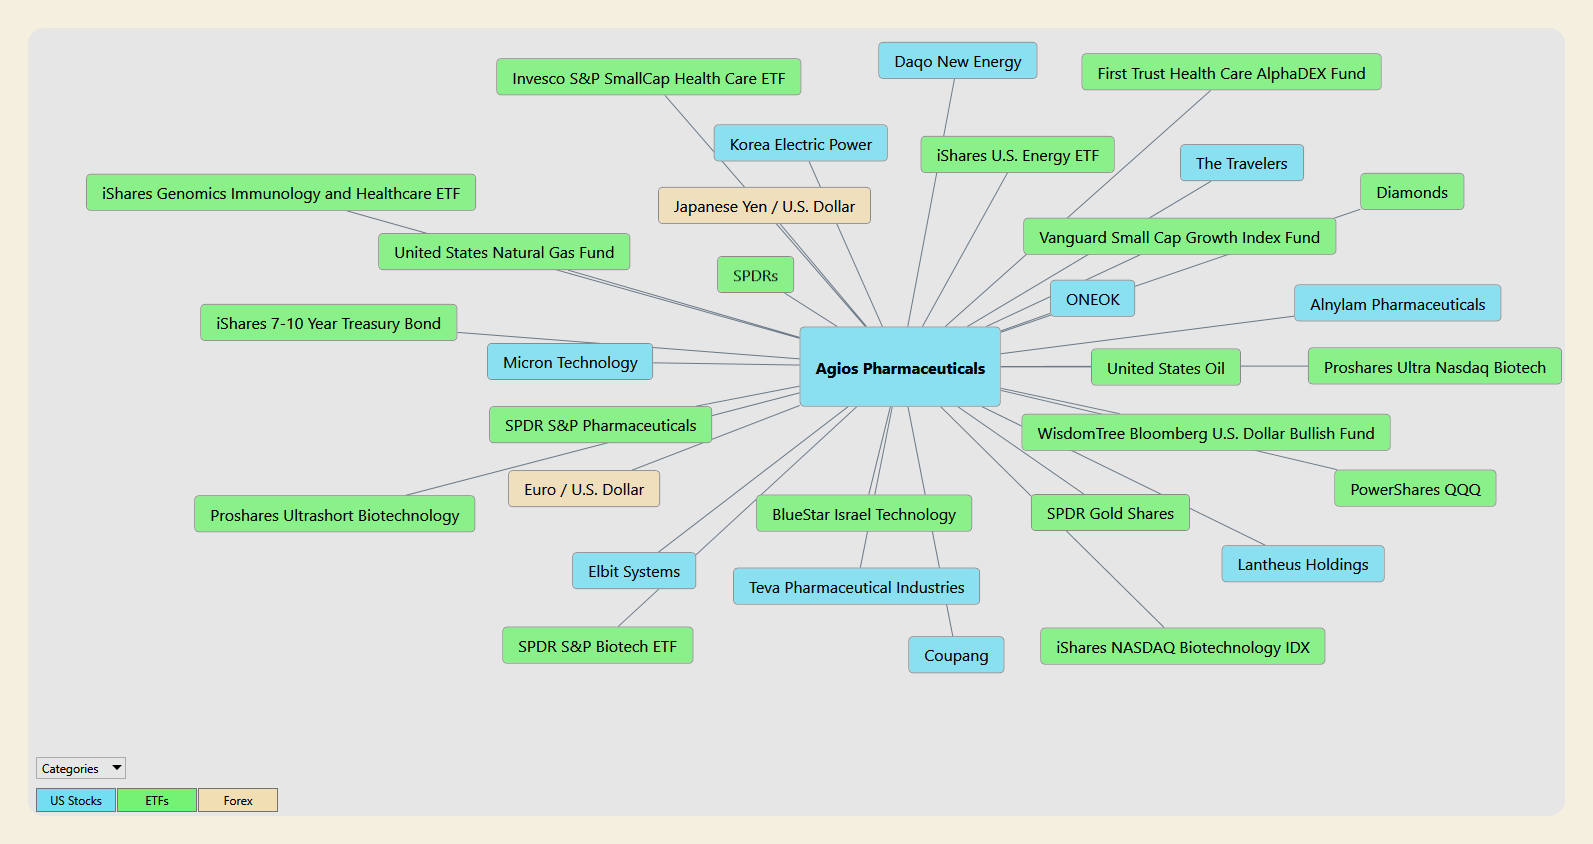
For Agios Pharmaceuticals, the map includes 10 U.S. stocks, 19 exchange-traded funds, and 2 currency pairs. The U.S. stocks are Alnylam Pharmaceuticals, Coupang, Daqo New Energy, Elbit Systems, Korea Electric Power, Lantheus Holdings, Micron Technology, ONEOK, Teva Pharmaceutical Industries, and The Travelers Companies. The ETFs are the BlueStar Israel Technology fund, Diamonds, the First Trust Health Care AlphaDEX Fund, the Invesco S&P SmallCap Health Care ETF, the iShares 7-10 Year Treasury Bond fund, the iShares Genomics Immunology and Healthcare ETF, the iShares NASDAQ Biotechnology Index fund, the iShares U.S. Energy ETF, PowerShares QQQ, ProShares Ultra Nasdaq Biotechnology, ProShares Ultrashort Biotechnology, SPDR Gold Shares, the SPDR S&P Biotech ETF, SPDR S&P Pharmaceuticals, SPDRs, the United States Natural Gas Fund, United States Oil, the Vanguard Small-Cap Growth Index Fund, and the WisdomTree Bloomberg U.S. Dollar Bullish Fund. The currency pairs are the euro against the U.S. dollar and the Japanese yen against the U.S. dollar.
What stands out is how much of the map is biotechnology beta, and how little of it is a direct competitor. Alnylam, Lantheus, and Teva are the healthcare names among the individual stocks. Around them sit the iShares NASDAQ Biotechnology fund, the SPDR S&P Biotech fund, SPDR S&P Pharmaceuticals, the iShares Genomics Immunology and Healthcare fund, the First Trust Health Care AlphaDEX fund, and the Invesco S&P SmallCap Health Care fund. ProShares Ultra Nasdaq Biotechnology and ProShares Ultrashort Biotechnology are the levered and inverse versions of the same bet. Taken together, the model is weighing whether money is moving toward or away from biotechnology, not only whether Agios has company-specific news. That fits a stock whose largest moves have come from trial and FDA headlines that also reprice the group.
The other clusters describe the backdrop rather than the business. The WisdomTree dollar fund, the euro, and the yen connect to currency translation, which matters now that Agios is reporting ex-U.S. PYRUKYND revenue after a European thalassemia approval. The iShares 7-10 Year Treasury Bond fund connects to interest rates, relevant for a company holding $964.8 million in cash and investments and no reported debt. United States Oil, the United States Natural Gas Fund, the iShares U.S. Energy ETF, and SPDR Gold Shares describe the commodity and inflation tape. Diamonds, SPDRs, PowerShares QQQ, and the Vanguard Small-Cap Growth fund capture broad equity direction and the small-growth style where a company of this size tends to trade.
The remaining individual names are not business peers. Micron, Coupang, Daqo New Energy, Elbit Systems, Korea Electric Power, ONEOK, The Travelers Companies, and the BlueStar Israel Technology fund are correlation inputs. Their presence on the map does not mean a memory-chip cycle or a Korean utility moves demand for a thalassemia drug. It means those markets have had a statistical relationship with AGIO’s price that the model treats as useful.
The distinction matters. Intermarket Analysis does not claim that any one of these markets moves AGIO on a given day. It recognizes that a one-product biotechnology company heading into an FDA decision is exposed to biotech-sector appetite, the dollar, rates, and the broader risk tape all at once, and it lets the AI weigh those influences together rather than asking a trader to track 31 charts by hand.
Our Suggestion
Agios Pharmaceuticals is a company where two stories are true at the same time. The first is a one-molecule biotechnology company whose pivotal sickle cell trial missed the pain-crisis endpoint, whose backup compound in that disease has been discontinued, which still loses about $100 million in a quarter, which faces a competing PK activator from Novo Nordisk, and whose stock has already fallen 50.89% in a single session on this exact debate. The second is a company that has taken the same molecule from no product revenue in 2021 to a $44.7 million quarter, holds $964.8 million in cash and investments, carries no reported debt, and has an FDA goal date of November 1 for a third indication. The market spent the last year giving more weight to the first story. Over the past week, helped by a rally across rare blood-disease stocks, it has started giving more weight to the second.
That is the trade in one sentence: $AGIO is a bet that a hemoglobin response is enough for accelerated approval in sickle cell disease, and that the thalassemia launch can carry the company while that decision is made, and the bet holds only if November 1 and the quarters after it confirm both.
The weekly chart frames the opportunity and the risk. AGIO sits at the 60.61st percentile of a 52-week range that was created in two sessions, 7.39% above the $34.12 midpoint, with 25.55% of room to the $46.00 high and 39.30% of room down to the $22.24 low. The stock has repaired about three-fifths of the distance from last November’s low, and it has not repaired the pre-readout price. A week of strength broke the early-October slide. It has not rebuilt the July high.
Taken together, the VantagePoint readings are aligned on a short window. The Predictive Blue Line crossed above the black line between October 14 and 15 and has widened its lead since. The Neural Index has been green from October 13 through October 20, which produced a double confirmation from October 15 onward once the crossover was in place. The Daily Range Forecast shows both boundaries rising, with a projected band of approximately $35.38 to $37.75 for October 21. The short-term forecasting tools are pointing in the same direction as the one-week relative strength data. They are not a substitute for the November 1 decision.
The risks are clear. The FDA goal date is 12 days from the October 20 close, and the readout headline on this drug produced a 50.89% single-day decline. The application rests on an endpoint the trial met and an endpoint the trial missed. Two of the six current targets already sit below the current price, and the most recent revision, Truist’s $37, is less than 1% above it. Part of the latest jump came from other companies’ news, and the close now sits above both the Predictive Blue Line and the actual moving average, which means price is stretched in the short term. Momentum is not safety, and a stock that can gain 16.99% in two days can give back more than that just as quickly, as it did when it fell 51.65% from the November 18 high to the November 19 low.
For traders, the disciplined approach is to let the VantagePoint readings define the risk rather than the headline calendar alone. A Neural Index turning red, a flattening Predictive Blue Line, or a close below the predicted low would each be a reason to tighten risk before November 1. A close back below the October 19 close of $34.90 would suggest the jump is fading, a close below the October 16 close of $31.32 would hand the whole move back, and a close below the November 19, 2025 low of $22.24 would indicate that the character of the trend has changed. Until then, the evidence favors respecting the rebound while keeping position size modest enough to absorb a decision-sized move in either direction.
Historical returns and technical signals are not guarantees of future results. They are tools for framing probability and managing risk.
Practice great money management on every trade, and use the VantagePoint AI Daily Range Forecast to identify short-term trading opportunities while keeping risk firmly under control.
It’s not magic.
It’s machine learning.
Disclaimer: THERE IS A HIGH DEGREE OF RISK INVOLVED IN TRADING. IT IS NOT PRUDENT OR ADVISABLE TO MAKE TRADING DECISIONS THAT ARE BEYOND YOUR FINANCIAL MEANS OR INVOLVE TRADING CAPITAL THAT YOU ARE NOT WILLING AND CAPABLE OF LOSING.
EXAMPLES ARE SUCCESS STORIES AND ATYPICAL. PAST RESULTS DO NOT GUARANTEE FUTURE PERFORMANCE.
VANTAGEPOINT’S MARKETING CAMPAIGNS, OF ANY KIND, DO NOT CONSTITUTE TRADING ADVICE OR AN ENDORSEMENT OR RECOMMENDATION BY VANTAGEPOINT AI OR ANY ASSOCIATED AFFILIATES OF ANY TRADING METHODS, PROGRAMS, SYSTEMS OR ROUTINES. VANTAGEPOINT’S PERSONNEL ARE NOT LICENSED BROKERS OR ADVISORS AND DO NOT OFFER TRADING ADVICE.