This week’s ai stock spotlight is Bloom Energy ($BE)
Bloom Energy ($BE) is not your daddy’s oil company. They’re not an oil company at all — and that’s the point. They’re building electric boxes that make old-world power look like rotary phones in the iPhone era. Founded in 2001, went public in 2018, now worth over $11 billion, Bloom slings solid-oxide fuel cells that run on natural gas, biogas, or hydrogen and spit out clean, reliable electricity — no smokestacks, no excuses. With 2,100 employees and Fortune 500 clients, they’re a serious player in a world where data centers can’t survive a blackout.
Financially, Bloom has been a mix of caution and surprise. Their latest earnings crushed expectations: $0.10 per share versus $0.01 consensus. Revenue jumped 19.5% year-over-year, proof of accelerating demand from hospitals, tech firms, and data centers desperate for resilience. Still, shares trade at a hefty premium, investors betting fuel cells will go mainstream like solar. It’s the classic Silicon Valley pitch applied to energy: growth ahead of scale.
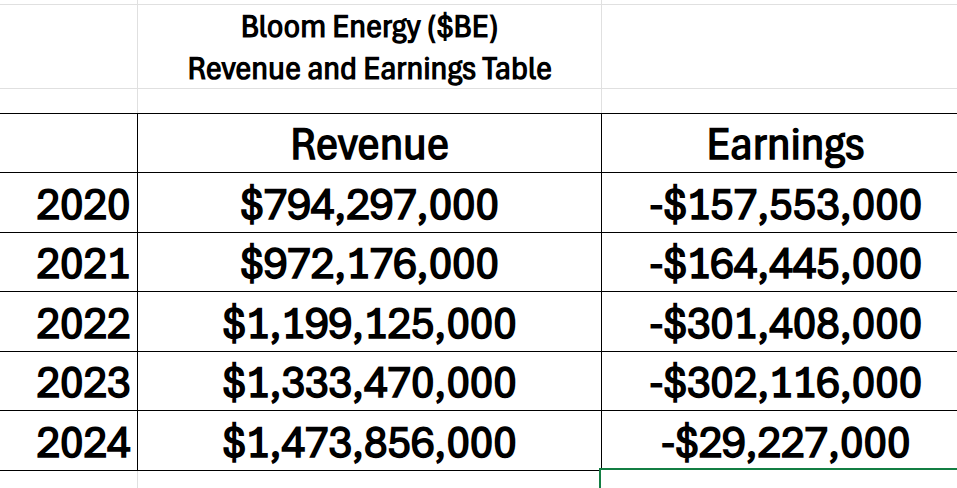
But the real fundamental issue for $BE is that over the last 5 years they have been losing money. The most recent earnings call positions the narrative that the worst is behind them, and the best is yet to come.
Here’s the real hook: Bloom sells control. Hospitals, data centers, and corporations don’t want to gamble on fragile grids that fail in hurricanes or rolling blackouts. They want power they own — on-site, always on. Bloom delivers that in a shipping container-sized box humming quietly outside the building. It’s not flashy. It’s freedom. And businesses will pay dearly for peace of mind.
But policy is the minefield. Governments and lobbyists argue while Bloom markets itself as the Silicon Valley magician — fuel cells promising to cut emissions, power A.I., and maybe keep the neighbor kid’s hoverboard from exploding. The tech works, but the politics are chaos. Everyone’s debating the map while Bloom is busy building the car.
Bloom stands at the crossroads of fossil fuels and American ingenuity. Headquartered in San Jose, it’s shipping technology that makes OPEC nervous. Today the servers run on natural gas; tomorrow, hydrogen. That’s leverage. With data centers exploding in size, hospitals expanding, and grids straining, demand for resilience is only climbing. Bloom isn’t a sideshow — they’re at the center of the new energy economy.
The numbers underscore both promise and risk. Bloom posted $1.47 billion in revenue last year and its first operating profit after years of red ink. Margins are improving, even turning non-GAAP profitable, a milestone for a company once accused of leaning too heavily on subsidies. A marquee partnership with Oracle to power A.I. data centers pushed the stock up 170% in a year. Yet insider selling — like SK ecoplant unloading half its stake — reminds Wall Street how fragile confidence remains.
The risks are obvious: dependency on tax credits, supply chain vulnerabilities, debt on the balance sheet, and tough rivals like Plug Power and Ballard Power. But so is the upside: if Bloom becomes the default power source for data centers, it could be one of the decade’s most consequential clean-energy players.
What makes Bloom intriguing is its evolution from a single “Bloom Box” to three profit streams: on-site power, long-term service contracts, and hydrogen electrolyzers. With over 1,000 deployments worldwide, the company sits squarely in two megatrends — decarbonization and exponential power demand. The question is whether it can scale fast enough to own its niche.
Investors must weigh hard truths. Costs remain high, the hydrogen economy is embryonic, and competitors are circling. Success will depend on scaling aggressively while defending its technological edge. Yet Bloom knows how to sell the intangibles: security, reliability, survival. CEOs don’t see a power plant, they see peace of mind, a guarantee their operations won’t fail. That emotional value translates into contracts worth millions.
The irony? Bloom sells freedom from the grid by tying customers into proprietary systems that still rely on natural gas or hydrogen. Capitalism in its purest form: customers feel virtuous, investors feel visionary, governments feel progressive. In that way, Bloom has built the Tesla of stationary power — equal parts brilliance and absurdity.
At its core, Bloom Energy isn’t just a company — it’s a bet on America’s future. While oil giants still dominate, Bloom is building parallel infrastructure rooted in innovation, not tankers and pipelines. In the energy market’s battle between old-world fossil fuel and new-world resilience, Bloom has chosen its side. And if history is any guide, America rewards those willing to bet big.
In this stock study, we’ll analyze the key indicators and metrics that guide our decisions on whether to buy, sell, or stand aside on a particular stock. These inputs serve as both our framework and behavioral compass, rooted in data and powered by predictive intelligence.
- Wall Street Analysts Ratings and Forecasts
- 52 Week High and Low Boundaries
- Best-Case / Worst-Case Scenario Analysis
- VantagePoint A.I. Predictive Blue Line
- Neural Network Forecast (Machine Learning)
- VantagePoint A.I. Daily Range Forecast
- Intermarket Analysis
- Our Suggestion
While our decisions are ultimately anchored in artificial intelligence forecasts, we briefly review the company’s fundamentals to better understand the financial environment it operates in. For $BE this context helps us assess the quality of the A.I. signal within a broader economic and industry backdrop.
Wall Street Analysts Forecast

Wall Street’s view of Bloom Energy is anything but settled. The chart tells the story: analysts see a high forecast of $48, a low of $20, and a median of $33.29 — all against a current price hovering just under $50. That spread alone is remarkable. The variance between the most bullish and most bearish view sits at $28 per share, which amounts to more than half the current market value.
In other words, analysts are looking at the same company and seeing two very different futures. On one end, Bloom is a clean-energy powerhouse ready to ride the A.I. and data-center boom; on the other, it’s a cash-hungry fuel-cell maker still tethered to subsidies and supply-chain uncertainty. This variance isn’t just noise — it’s the expected volatility investors should brace for.
For traders, the takeaway is clear: the market’s next move on Bloom Energy is unlikely to be subtle. A single earnings beat, a new policy shift, or another marquee customer could justify the bullish case. But a stumble on margins, a hiccup in deployments, or waning political support could just as easily vindicate the skeptics. The forecast range isn’t just a set of numbers — it’s a reminder that Bloom’s story remains high-risk, high-reward, and decidedly unresolved.
52 Week High and Low Boundaries
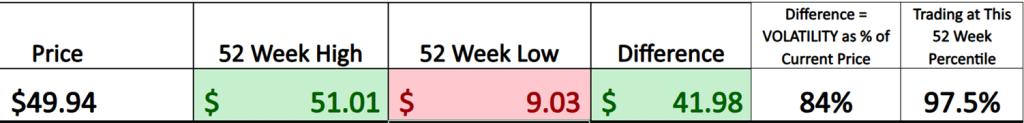
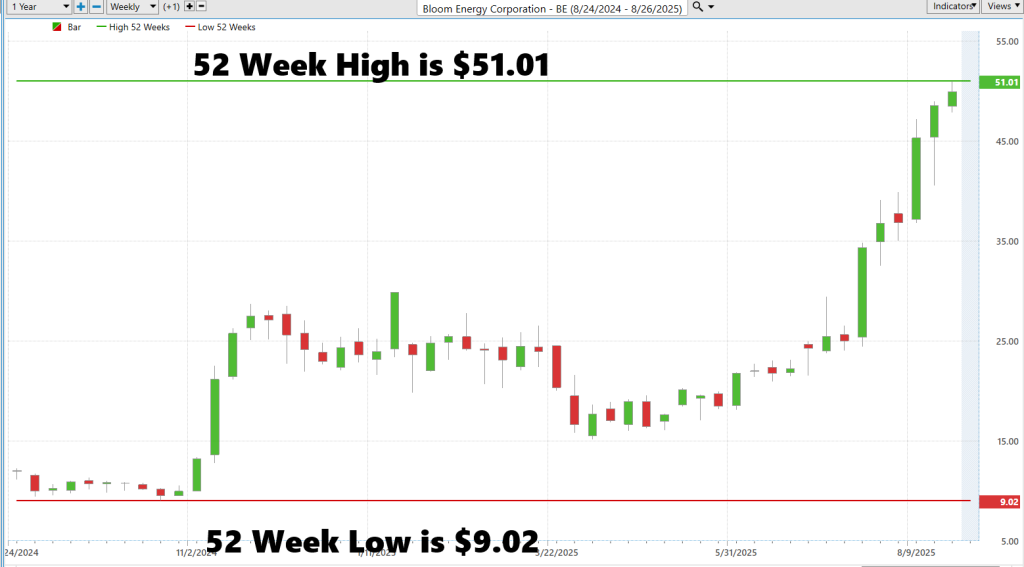
Bloom Energy ($BE) didn’t just drift higher — it blasted off like a rocket strapped to a bottle of Red Bull. Twelve months ago, this thing was rotting down at $9.03 a share. Traders wrote it off. Analysts shrugged. It was roadkill on Wall Street’s highway. Fast-forward to now, and it’s kissing its 52-week high at $51.01. That’s not just a move — that’s a five-bagger. And it didn’t creep there slowly. Look at the candles. Once momentum caught, this stock went vertical.
This is what volatility looks like in the flesh: a $41.98 difference between the low and the high — 84% of the current price. For traders, that’s both terrifying and intoxicating. Because volatility is opportunity. It’s the oxygen that keeps the fire burning. And Bloom’s chart is pure fire.
Now here’s why the 52-week boundaries matter. Every trader on the planet has those lines etched into their brain. The low is the line of shame — proof of how bad things can get. The high is the line of glory, the point where every short seller pukes and every momentum trader piles in. When a stock smashes through that ceiling and starts making new 52-week highs, it’s telling you something. It’s saying the market has flipped. Doubt has turned into belief. Weak hands are gone, strong hands are in.
And the lesson here? Stocks making new highs tend to keep making new highs. That’s the dirty little secret. Momentum doesn’t care about your feelings, your theories, or your valuation models. It cares about demand — and right now, demand for $BE is red-hot. Traders watch those 52-week highs because it’s like spotting a shark fin in the water. You either ride it, or you get eaten trying to fight it.
Bottom line: $BE isn’t whispering, it’s shouting. From $9 to $51 in a year, with the volatility dial cranked to eleven. If you want safe and boring, go buy a Treasury bill. If you want action, this is the kind of chart that makes traders lean in.
Best-Case/Worst-Case Scenario Analysis
Years ago, a trader told me markets are like riding a rollercoaster blindfolded. You know the track has highs and lows — you can even measure how steep the last drop was — but you never quite know when the next plunge or surge is coming. That’s volatility. It’s not a forecast; it’s the record of how wild the ride has been.
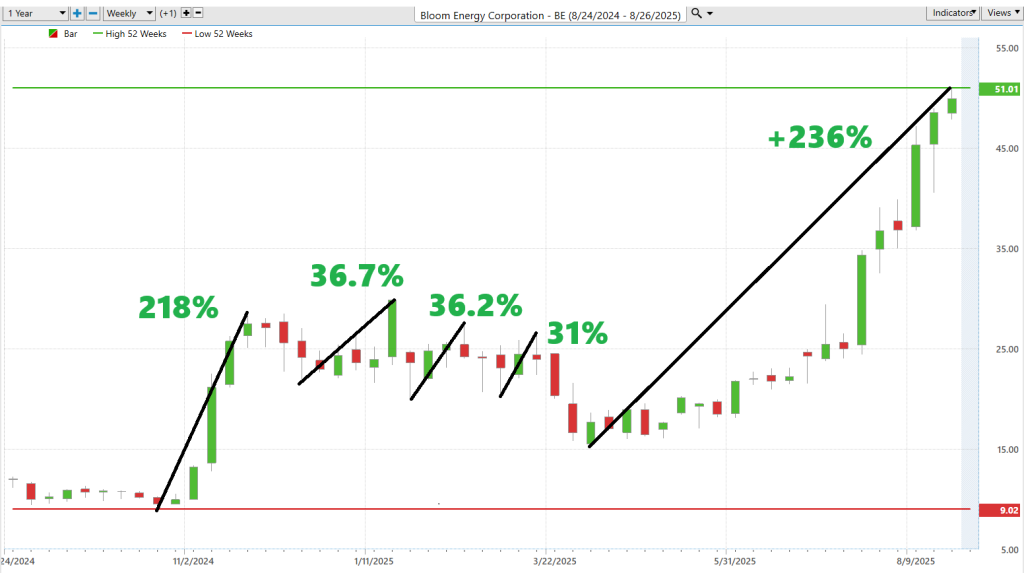
First, we measure the largest uninterrupted rallies:
Followed by the largest uninterrupted declines:
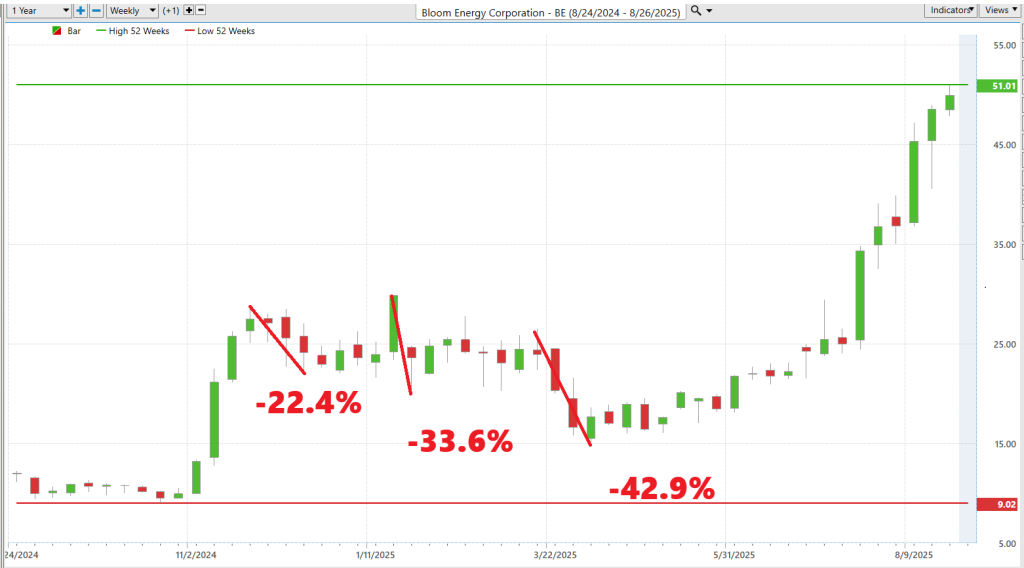
And Bloom Energy’s chart is a perfect case study. On the way up, you had uninterrupted rallies of 218%, 36%, 36%, 31%, and most recently a blistering 236% run. That’s not “momentum.” That’s a stampede. But look at the other side of the coin: drops of 22%, 33%, and 43%. In a blue-chip stock, those would be career-ending disasters. Here, they’re just another Tuesday.
This is what makes volatility a two-edged sword. On the one hand, it’s the thrill of seeing a position double, triple, quadruple — fast enough to make your broker stutter. On the other, it’s the risk of being on the wrong side of that same speed, watching your account balance vanish faster than a politician’s campaign promise. Opportunity and risk are conjoined twins in this game; you can’t have one without the other.
So, what’s the trader’s job? It’s not to predict the future with tea leaves and tarot cards. It’s to measure the past. To map out the magnitude of those rallies and declines. To accept that, if the near future behaves anything like the recent past, you should brace yourself for swings of 30% to 200% in either direction. That’s the market’s emotional bandwidth — fear, greed, capitulation, euphoria — all compressed into candlesticks.
Volatility isn’t noise; it’s the market speaking. Loudly. It tells you how far sentiment can stretch before it snaps back, how much conviction you need to hold a position, and how small you might want to size that position if you plan to survive the next downdraft.
The challenge — and it’s always the same challenge — isn’t whether volatility is good or bad. It’s whether you understand its scale. Because in Bloom’s case, “routine” means watching your stock plunge 40% and still being considered “in trend.” That’s the kind of math only traders who’ve done their homework can stomach.
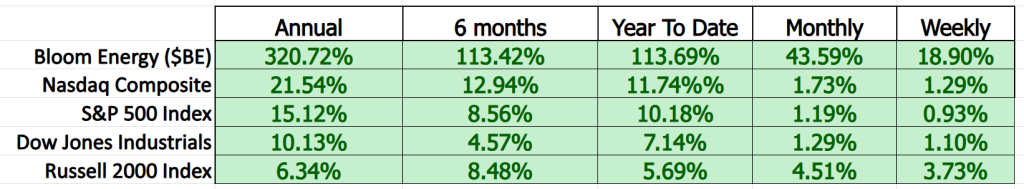
Bloom Energy’s performance grid tells the story in stark relief: 320% over the past year, 113% in just six months, and nearly 19% in a single week — numbers that put the Nasdaq, S&P 500, Dow, and Russell 2000 to shame. Traders don’t need a complicated model to see what’s happening here. By monitoring performance across multiple time frames — weekly, monthly, year-to-date — you spot the kind of outlier that changes portfolios. Bloom isn’t just beating the benchmarks; it’s lapping them. And when a stock separates itself this dramatically from the broader market, it should make every trader sit up and ask not just why it’s happening, but how long this kind of outperformance can last.
Vantagepoint A.I. Predictive Blue Line
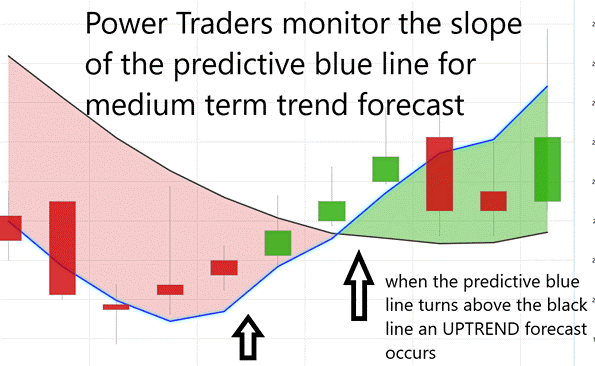
What you’re looking at here is the very definition of trend clarity. The Predictive Blue Line is not guesswork — it’s a daily roadmap. When the blue line slopes higher, it tells you the trend is up. When it flattens or rolls over, momentum is fading. And when it cuts below the black line, that’s the market saying, “brace yourself, the trend is down.”
Notice how, on this chart of Bloom Energy, the blue line has been consistently sloping higher for months — leading price, showing traders not just where the market has been but where it’s most likely going. The level of that line marks “fair value,” a benchmark for traders to know whether price is overextended or offering opportunity. Every time the blue line stayed above the black, it was a signal the trend was intact — and Bloom just kept powering higher.
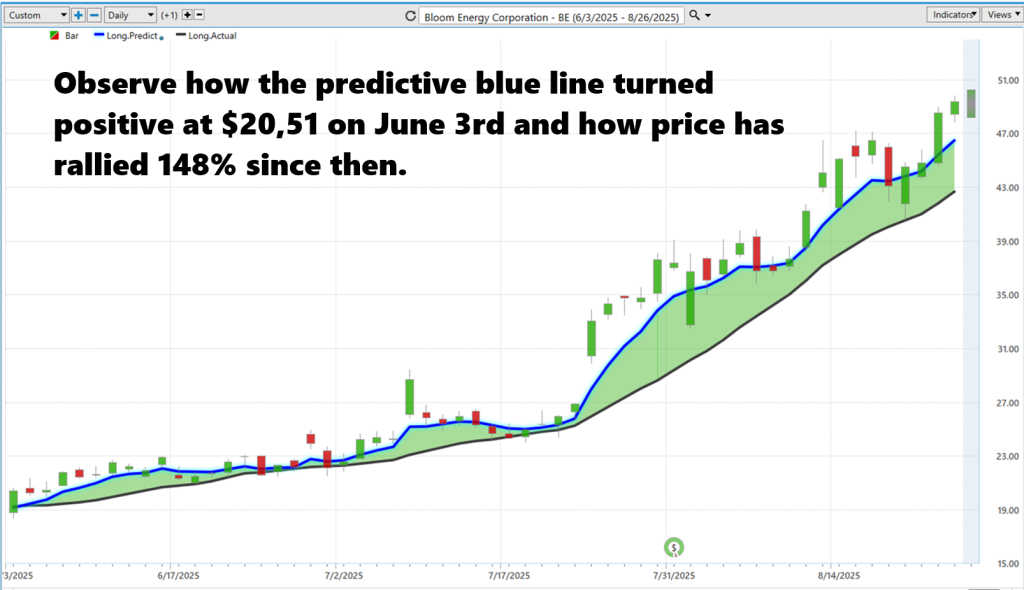
This is how VantagePoint empowers traders every day. It strips out the noise, the talking heads, and the guesswork, and puts focus where it belongs: on the trend itself. The message is simple: when the blue line is rising above the black, the odds are stacked in your favor. When it’s falling, it’s time to protect capital. In a market as volatile as Bloom Energy, that kind of clarity isn’t just useful, it’s indispensable.
Neural Network Forecast (Machine Learning)
In today’s markets, data is moving faster than ever, and so is the technology that processes it. For traders, that’s meant a clear transition: instinct and hand-drawn charts are giving way to neural networks — adaptive systems designed to recognize patterns long before the rest of the market catches on. Think of them as analytical engines modeled after the human brain, only faster, sharper, and tireless. By layering thousands of “neurons,” they process price action, trading volumes, macro indicators, and cross-market relationships, constantly refining themselves to anticipate shifts in momentum and trend.
What makes neural networks increasingly critical is their ability to filter out the noise and strip away the bias that often clouds human decision-making. Millions of data points get compressed into a single forward-looking signal — giving traders not just a view of where markets have been, but where they’re likely headed. That turns reaction into anticipation, allowing active investors to step into trades earlier and with more conviction.
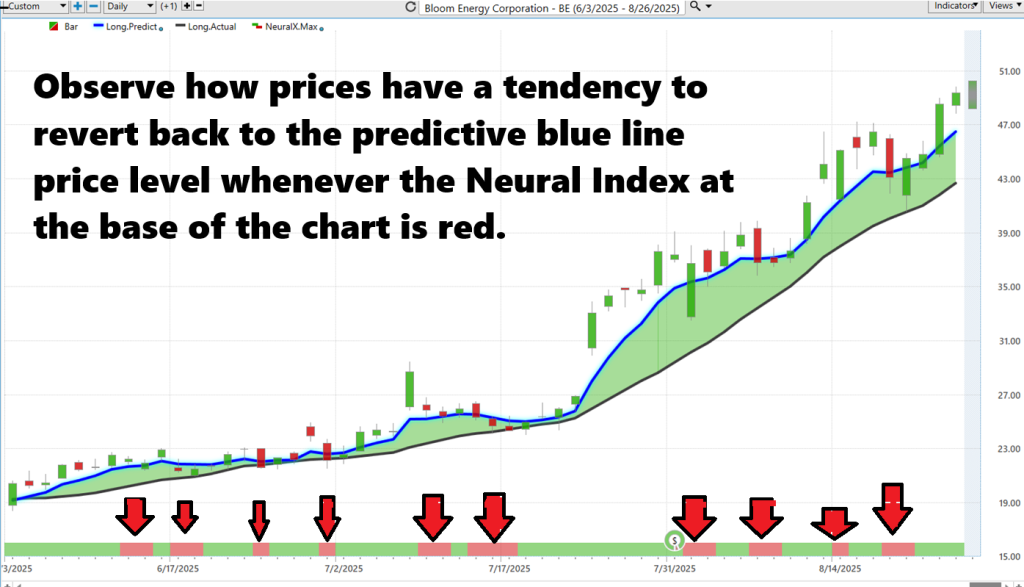
Paired with tools like the Predictive Blue Line and the Neural Index, the effect is striking. The Blue Line maps the direction of the trend, while the Neural Index gauges whether short-term momentum is aligned. When both indicators point the same way, it creates what amounts to a high-probability setup. In practice, this means traders aren’t just riding waves of volatility — they’re positioned to catch the move before it breaks. In an environment where news can shift sentiment in seconds, neural networks aren’t simply an advantage. They’re quickly becoming the standard for those who want to stay one step ahead of the crowd.
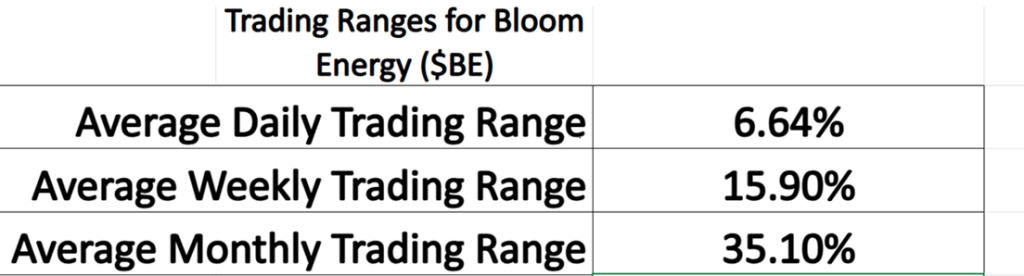
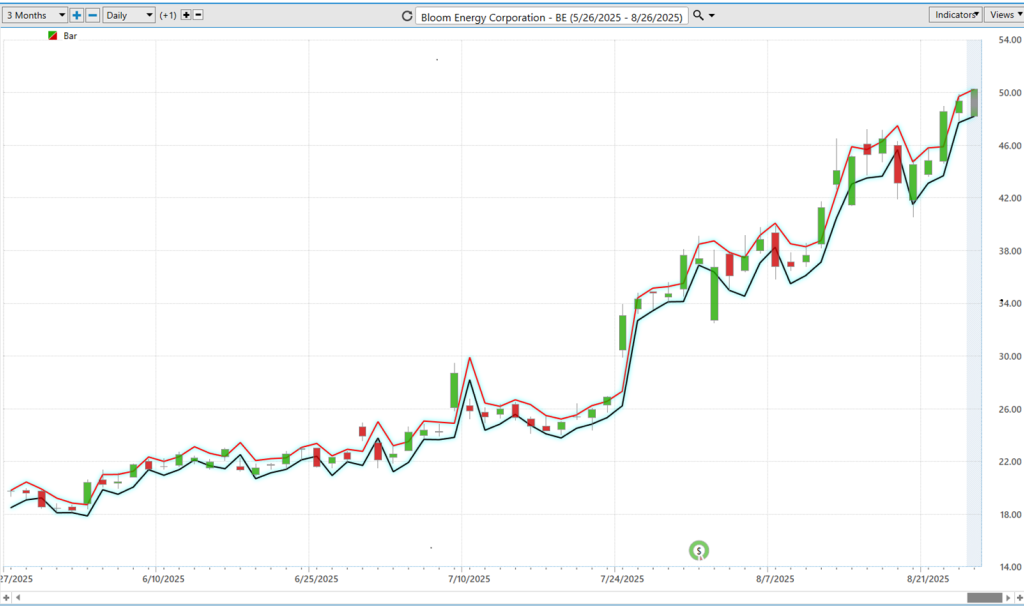
VantagePoint A.I. Daily Range Forecast
When you talk about Bloom Energy ($BE), you don’t need to convince anyone that volatility is hot — the numbers do it for you. A stock with an average daily trading range of 6.6%, a weekly swing near 16%, and a monthly range north of 35% is not a sleepy name. That’s white-knuckle territory. And you can see it in the chart: wide bars, sharp moves, big gaps. This is the kind of stock that can hand you a fortune in a week — or take it right back if you’re not careful.
But here’s where it gets powerful. Despite all that noise, look at how the VantagePoint A.I. Daily Range Forecast navigated it. Those projected ranges have consistently wrapped price action, giving traders a tactical map for when to step in and when to step aside. That’s not luck — it’s machine learning digesting mountains of intermarket data to pinpoint where volatility is most likely to land. In a stock like $BE, that precision is the difference between chasing chaos and trading with confidence.
The takeaway is simple: $BE is red-hot, yes, but the smart money isn’t just betting on direction — it’s managing volatility. And the traders using A.I. aren’t blindsided by 6% daily swings; they’re anticipating them, positioning around them, and capitalizing on them. That’s the edge. In a market this unforgiving, having the ability to see tomorrow’s trading range today isn’t just helpful — it’s a game-changer.
Intermarket Analysis
Imagine you’re at a big birthday party. There’s cake, soda, balloons, and music. Now, if the music gets louder, kids start dancing. If kids eat more cake, they drink more soda. If one balloon pops, everybody jumps. That’s how markets work too, everything is connected. Intermarket analysis is simply watching how one thing (like oil prices, gold, or the U.S. dollar) affects another thing (like stocks, bonds, or Bloom Energy). Traders use this to see the “big picture”—because no market moves all by itself.
Bloom Energy doesn’t live in a vacuum — it breathes in a world of connections. Look at the graphic and you’ll see it tied to currencies, commodities, ETFs, and peer companies. When the U.S. dollar rises, it can make Bloom’s exports more expensive overseas, muting demand. But when the U.S. Natural Gas Fund or United States Oil shift, it changes the cost of fuel that Bloom’s fuel cells can use — directly impacting margins and adoption. These intermarket links are the “hidden gears” behind every price move.
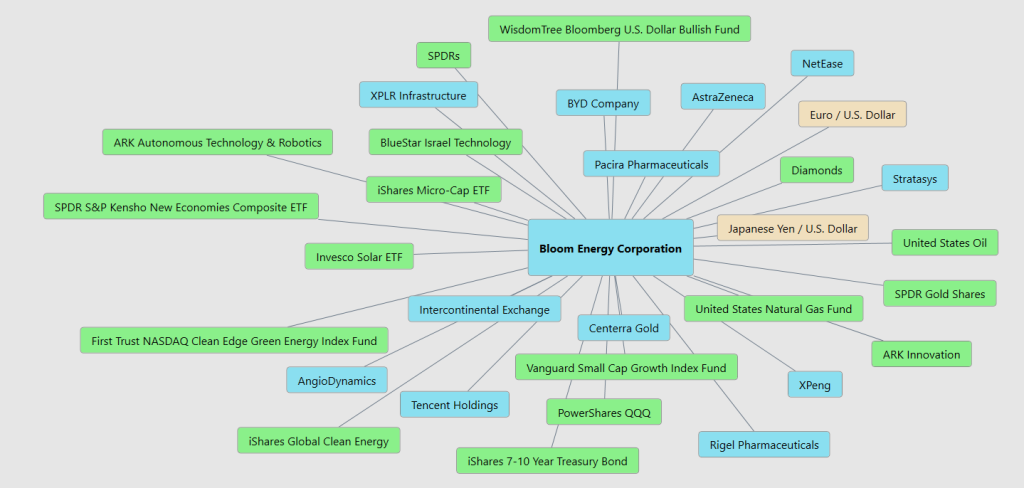
Another key driver is the broader clean energy ecosystem. Notice the ETFs — iShares Global Clean Energy, ARK Innovation, First Trust Clean Edge Green Energy Index. These funds buy large blocks of Bloom’s shares when the clean energy theme is hot and sell just as quickly when sentiment cools. That makes Bloom’s price highly sensitive to flows in and out of the entire green tech sector. Traders who watch only Bloom’s chart miss this bigger tidal wave of money moving in and out of the sector ETFs.
Finally, the relationships to commodities like gold, diamonds, and even broader tech plays like Tencent or BYD show you just how diverse the influences can be. In high-volatility markets, investors rotate between “risk-on” and “risk-off” assets. Gold and Treasuries rally when fear is high, while clean tech names like Bloom soar when optimism returns. This constant push-and-pull is why intermarket analysis isn’t optional for $BE traders — it’s essential. To trade Bloom Energy effectively, you must read the entire orchestra, not just one instrument.
Our Suggestion
The A.I. boom is supposed to be about GPUs and chips and training large language models, but it turns out it’s also about … electricity. All those computers must plug in somewhere, and the U.S. grid is not exactly known for its extra capacity. Enter Bloom Energy. If you squint at it, Bloom isn’t really an energy company as an insurance company: it sells a box that makes electricity, so you don’t have to rely entirely on the grid. And if you’re a hyperscale data center spending billions to train A.I. models, you’ll happily pay a little more for the comfort of knowing your servers won’t suddenly go dark because of a transformer fire down the road.
The last two earnings calls made this subtext explicit. Bloom came in with record revenue — $401 million in Q2, up almost 20% year-over-year — and, perhaps more importantly, actual profits (adjusted EPS of $0.10 versus a $0.01 forecast). But the interesting part wasn’t the numbers, it was the vibe: management talking about “time-to-power” as if they were selling instant coffee and framing their entire pitch around independence from the grid. They were also, to their credit, unusually clear about margins, deployment timelines, and capacity expansion. (They’re planning to double capacity to 2 GW by 2026, because apparently A.I. servers eat electricity the way I eat donuts.)
So, the story is that Bloom, which spent years being dismissed as a kind of science project for fuel cells, suddenly has a killer use case: backstopping the A.I. energy boom. Management sounds nimble, confident, and maybe even a little giddy. The risk is still there — tariffs, subsidies, supply chains — but the market doesn’t seem to care. The stock is up more than 300% in a year. If you’re a trader, you can call this a volatility play. If you’re Bloom, you can just call it product-market fit.
So yes, Bloom Energy is suddenly interesting again, not because the technology changed overnight, but because the world around it did. The A.I. boom created a voracious new customer base that cares less about shaving pennies off kilowatts and more about not having their data center implode when the grid hiccups. That’s a tailwind you don’t ignore.
If you’re a trader, it probably makes sense to at least put $BE on your radar. Not as a sure thing — there’s still plenty of volatility baked in — but as a company that went from “weird fuel cell bet” to “A.I. infrastructure hedge” almost overnight. And while you’re watching it, remember the boring stuff: position sizing, stop-losses, and good money management. Because the only thing more volatile than AI hype is the stocks trying to power it.
It’s not magic.
It’s machine learning.
Disclaimer: THERE IS A HIGH DEGREE OF RISK INVOLVED IN TRADING. IT IS NOT PRUDENT OR ADVISABLE TO MAKE TRADING DECISIONS THAT ARE BEYOND YOUR FINANCIAL MEANS OR INVOLVE TRADING CAPITAL THAT YOU ARE NOT WILLING AND CAPABLE OF LOSING.
VANTAGEPOINT’S MARKETING CAMPAIGNS, OF ANY KIND, DO NOT CONSTITUTE TRADING ADVICE OR AN ENDORSEMENT OR RECOMMENDATION BY VANTAGEPOINT AI OR ANY ASSOCIATED AFFILIATES OF ANY TRADING METHODS, PROGRAMS, SYSTEMS OR ROUTINES. VANTAGEPOINT’S PERSONNEL ARE NOT LICENSED BROKERS OR ADVISORS AND DO NOT OFFER TRADING ADVICE.