


Welcome to the Artificial Intelligence Outlook for Forex trading.
VIDEO TRANSCRIPT
PowerShares DB US Dollar IDN Bullish Fund ($UUP)
Okay, hello everyone and welcome back.
My name is Greg Firman, and this is the Vantage Point AI Market Outlook for the week of October the 20th, 2025.
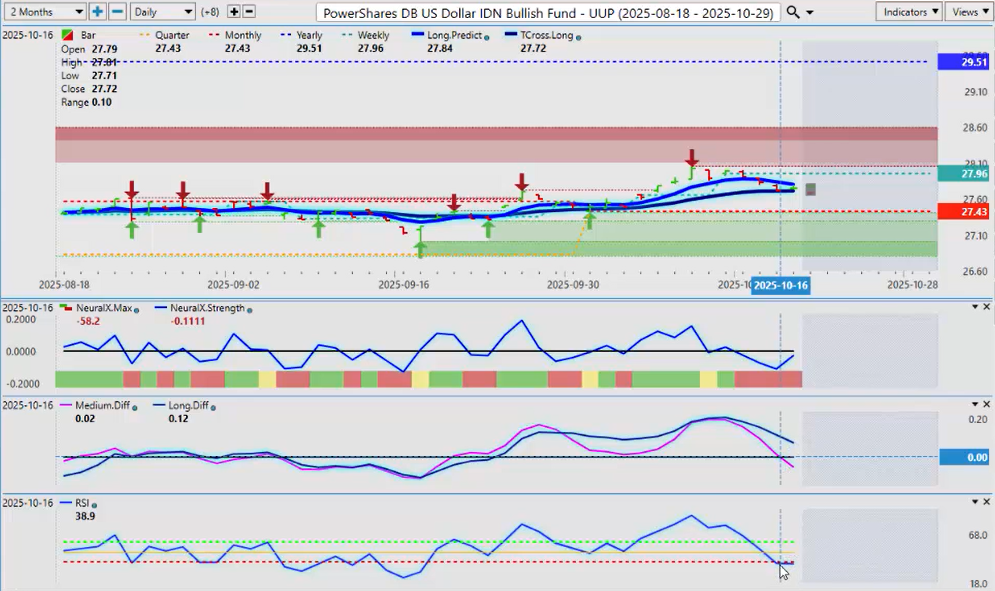
Now, to get started this week, we’ll begin with the Dollar Index, but we’re going to look at things a little bit differently here. The standard Dollar Index or the ICDXY Bull Fund in the ETF side. So, when we look at the IDN or the UUP Bull Fund, we can see that we have still a sell signal — a medium-term crossover — but we have very little momentum on the predicted RSI. The neural index here on the UUP is starting to point back up.
Now, if we look at a more diversified view of the Dollar Index using the USDU, we can see a very different signal here. We’re well supported on the Tcross long. The neural index is virtually the same, pointing back up. But we can assess here that there is no medium-term crossover.
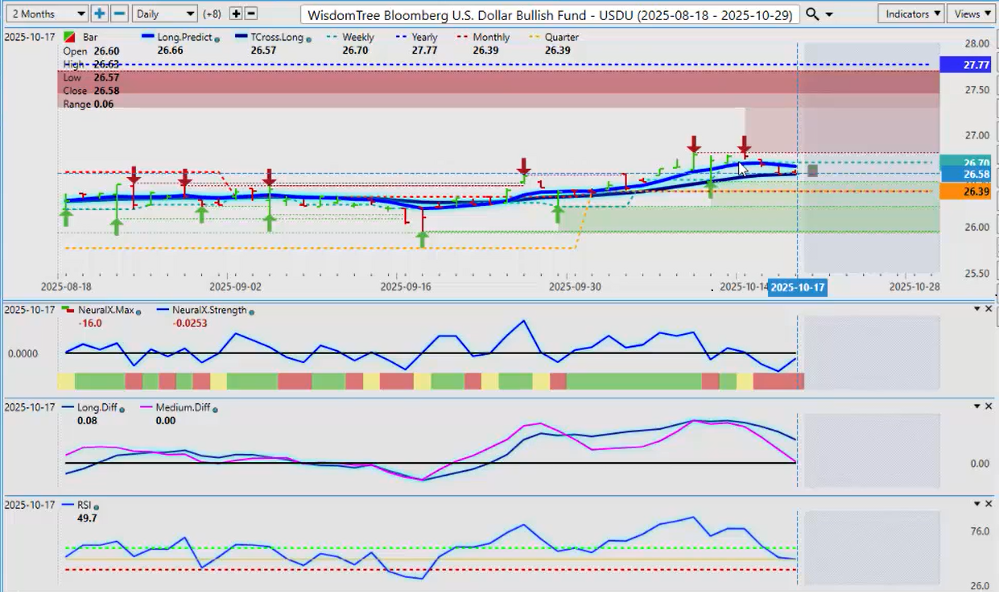
When we look at broad-based currencies — for example, the UUP will put approximately 59.7% to the Euro, where this WisdomTree Bloomberg Dollar Bull Fund will only put about 29.5% to the Euro and then rebalances with a number of other currencies that are not in the Dollar Index.
So, this signal too, we can also assess here that we’re slightly below the 50 level, but we’re not at that breakout point below the 40. So again, the Tcross long coming in at 26.57 — that is the key area to watch. But in my respectful opinion, again, two very different signals that are coming.
In the forex market with the main G7 pairs, we’re either buying or selling U.S. dollars, but if we’re trade-weighting everything to the Euro, then that doesn’t necessarily give a clear picture as to what’s really going on here if we’re leaving out, you know, a number of different currencies including the Chinese Yuan, Australian Dollar, etc.
So again, the Dollar remains above its quarterly opening price here — 26.39. And again, as we move towards the end of the month, the Dollar usually is somewhat stronger. So again, a very mixed bag here. But for now, we would be looking for a breakdown below that quarterly opening price on both of these. That number on the UUP is coming in at 27.43.
GOLD ANALYSIS ($XAU/USD)
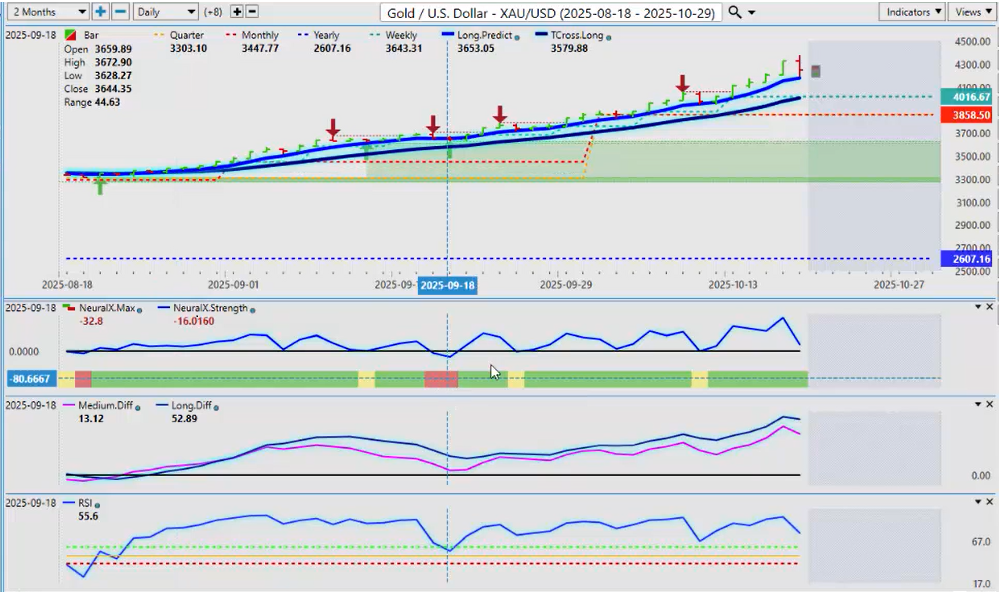
Now, if we look at Gold, Gold taking a little bit of a breather here on Friday, but another bullish move up again as central banks buy Gold. Vantage Point’s done a very, very good job on this entire rally here — only one small area where the neural indexes turned red.
Now, the medium and long-term predicted differences here are very mixed. But again, I would prefer to see that pink line above the blue line, and I also would prefer to see the predicted RSI pointing upwards, where they’re both pointing down.
So, looks like we could see Gold coming under maybe a little bit of pressure this week, but that would just be a retracement back to our Tcross long — that area coming in at 4,455.
And more importantly, the monthly opening price, which of course is the same as the quarterly opening price in October — only 3,858.50. We would remain long while above this particular area.
GLOBAL EQUITY MARKET $SPY
Now, the SPY — looking at the global equity markets here. I’ll look at the SPY and the DAX for my friends in Germany.
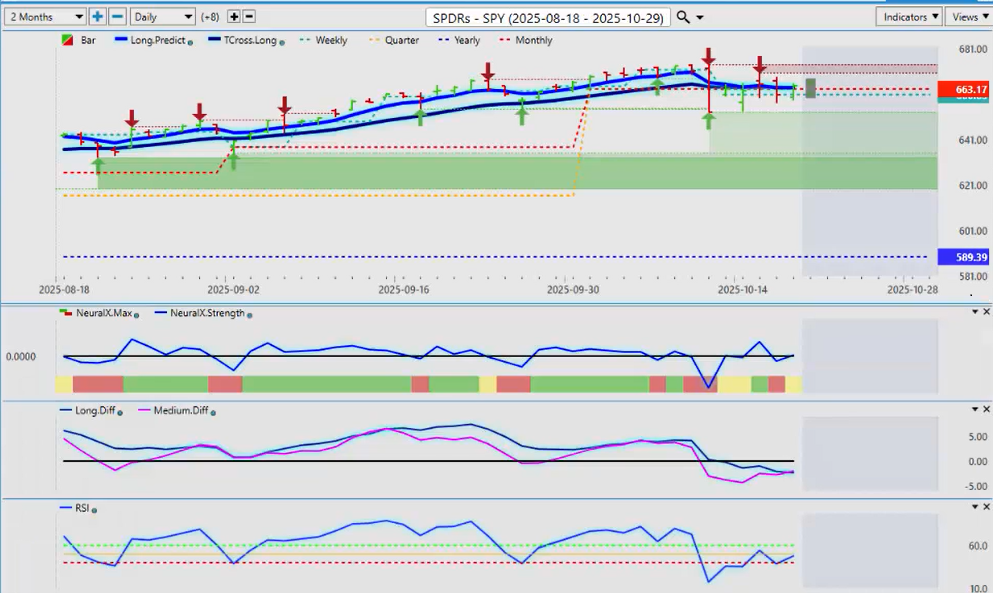
Right now, we can see an MA diff cross is forming — the pink line crossing over the blue line. The predicted RSI came down, hit the 40 level, and bounced off of it. This is a warning sign of a bull move coming, guys.
Now, that may not be on Monday, but on Tuesday and Wednesday is when you want to watch it, because again, a lot of volatility around the Monday open — 9:30 Monday morning. Same thing every week, guys: high volatility, crazy price only to see it reverse on Tuesday.
So for now, this is warning us that we are likely to see further strength in the equity markets, but we just need to get moving and get above that Tcross long at 66378.
U.S. OIL OUTLOOK ($USO)
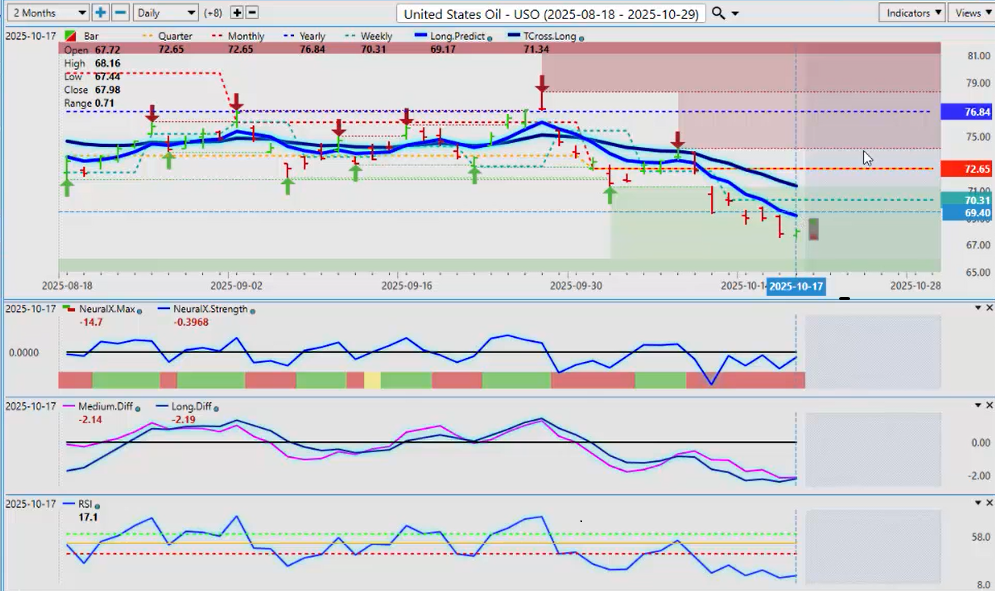
Now, U.S. Oil continues to slide here — no sign of any real recovery yet. But again, I don’t think Oil will just keep going lower like this. For now, we are below the yearly opening price — the quarterly, monthly, and even the weekly opening price didn’t do very well this past week.
So again, I would look for a rebound coming on this, but I would need to see a definitive move. I’d like to see the predicted RSI rising back up above 50 from oversold territory before I even think about attempting longs on that. And even then, it would likely only be a retracement back to our Tcross long at 71.34.
DAX INDEX ANALYSIS
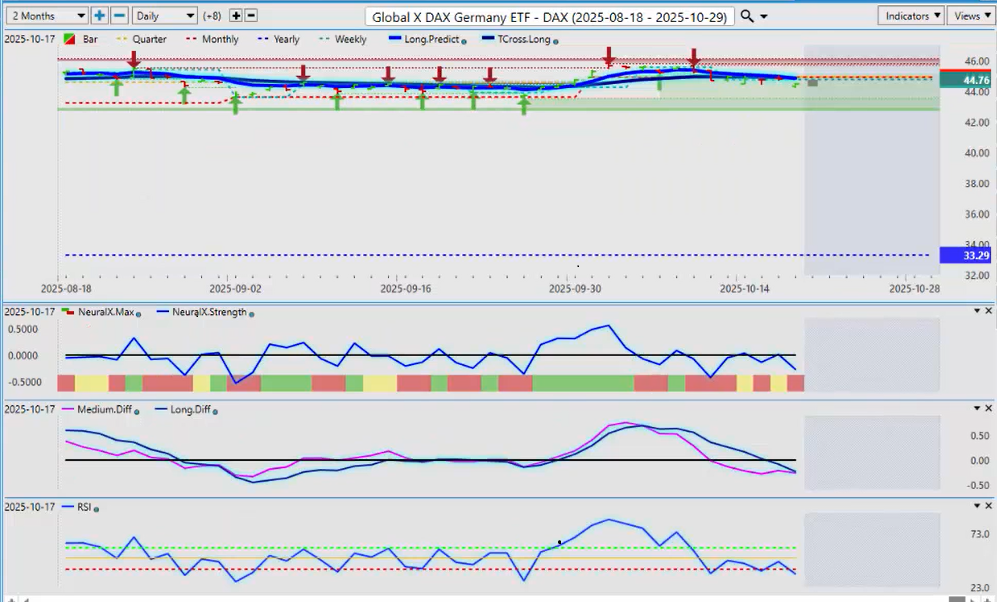
Now, the global indexes — looking at the DAX here. The DAX — a little bit surprising that it didn’t rebound when the Euro did this week. So again, right now, all of our key levels on the DAX are coming in at the exact same area: the Tcross long 44.88, 44.91 — the quarterly and the monthly opening price.
One of the ways that I would play this, guys, is simply put a buy stop above the 45 level. If it moves over and above that, it would trigger a long trade. That’s one of the ways that can be played. Or we can continue to see if this thing can move lower.
But right now, if that pink line crosses that blue line, that is a huge warning sign of a reversal. But I will concede at this particular time, the predicted RSI is below the 40 level. We have a medium and a long-term crossover. The neural index is pointing down.
Any change in the rhetoric on the trade talks, etc., or the U.S. government opening back up again — these are all positives for the equity market. So, it’s going to be volatile. But for now, probably a little bit more downside. But again, if we can get above the 40 level, this thing will start to move rather quickly.
BITCOIN OUTLOOK
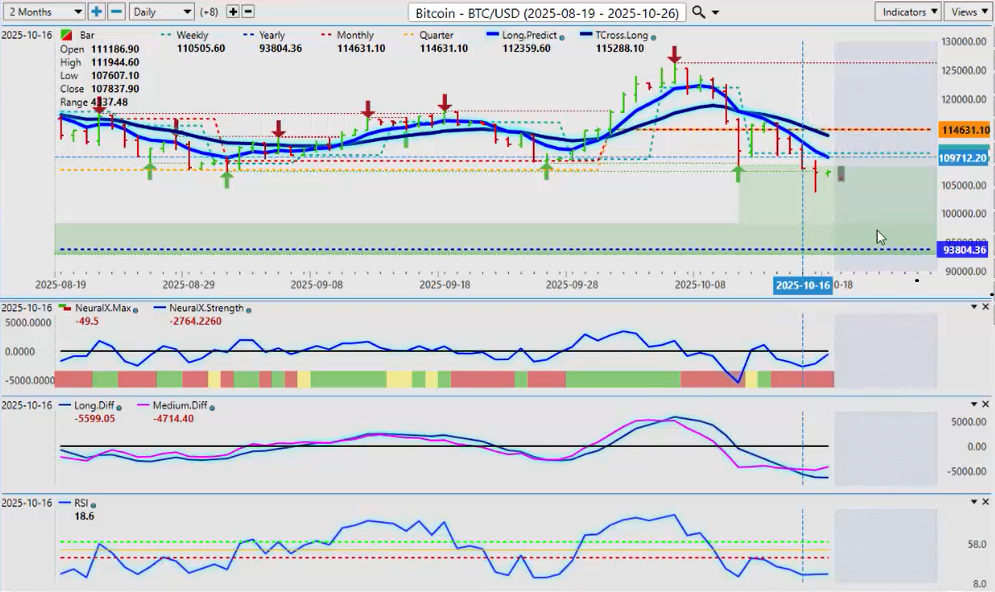
Now, Bitcoin — a lot of chatter about Bitcoin from Friday last week. Having a very, very tough week here, but let’s remember, guys, we’re still positive on the calendar year — 93,804.
So, as long as we’re holding above that, I believe that Bitcoin longs are still in play. I have a clear buy signal here — or a momentum change is maybe a better way for me to phrase that. The pink line crossing over the blue line is warning of a retracement.
So, if nothing else, next week, as long as we can hold above that psychological 100,000 level, then I believe we return this week back to 114,631 — or the Tcross long, which is coming in at 113,633.
Again, it will be very volatile for sure. But let’s not forget here, guys, we’re still up 13 to 15% on the calendar year. So, it is not completely bearish as of yet. My bigger concern would be next year because Bitcoin has been following a three-year cycle — meaning three years up, one year down.
This is the third year of a three-year rally. I am potentially looking for Bitcoin to have somewhat of a down year next year. But for now, while we remain in 2025, as long as we can hold above 93,804, Bitcoin is still a reasonable long trade.
U.S. TREASURY BONDS AND IEF ETF
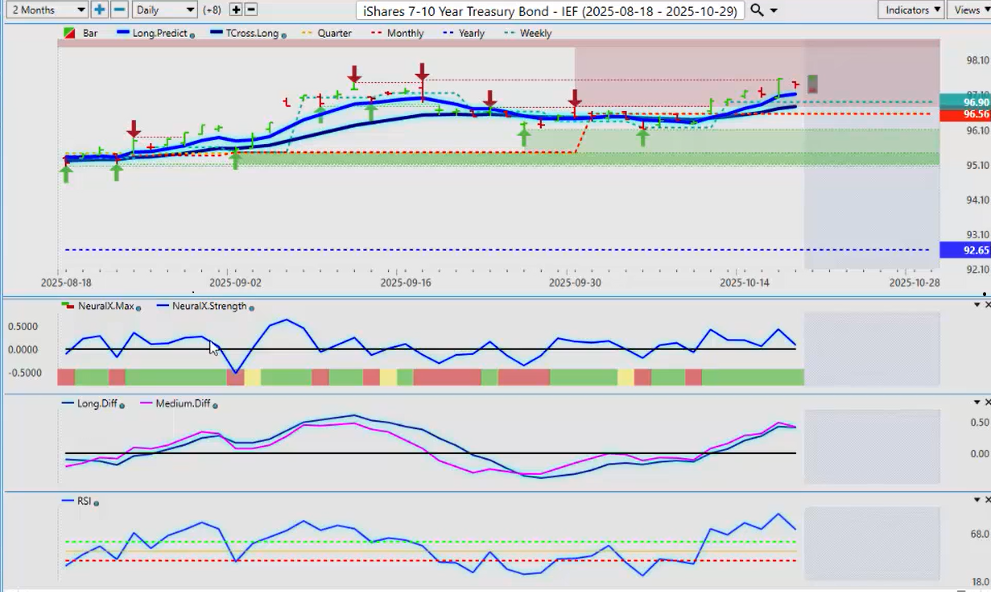
Now, when we look at some of the other ones — the iShares, the 7- and 10-year bond here — once again, the Treasury bond ETF, the IEF, holding above its monthly opening price.
This is an inverse correlation to the Dollar Index. Very seldom do they both go up or down at the same time — one goes up, one goes down. So again, if this is getting ready to turn back to the downside, that would indirectly tell me that Dollar strength would be coming probably near month end.
I’m not convinced it will be next week, but it’s possible. For now, I will be keeping a very close eye on that. If I get a sell signal on the IEF, that’s indirectly a potential buy signal on the Dollar Index or anything related to the Dollar.
FOREX PAIRS ANALYSIS: EUR/USD
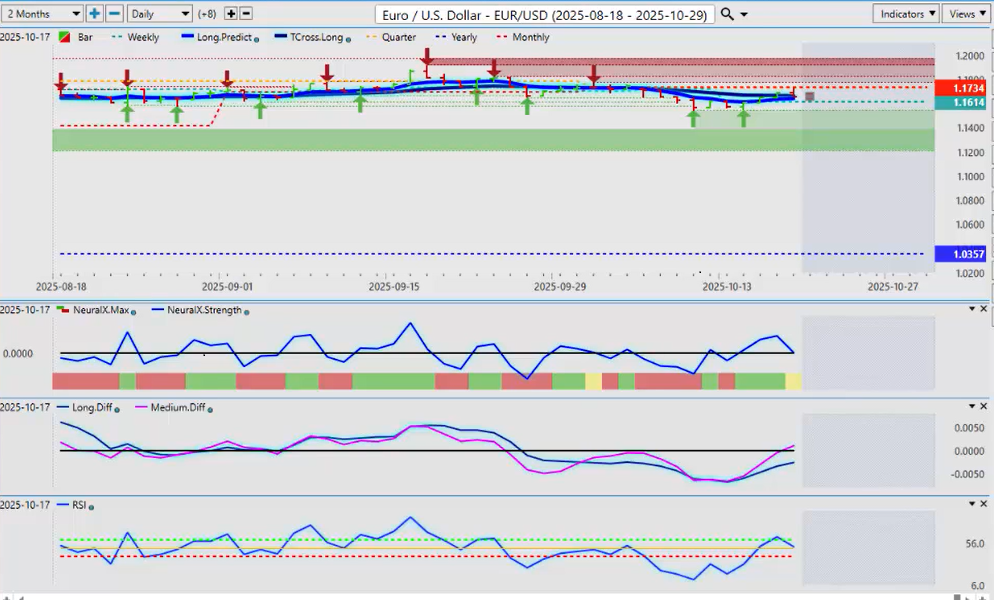
Now, as we usually do every week, we’ll look at some of the main forex pairs. All eyes have been on EUR/USD.
What’s interesting about EUR/USD is that we’ve had a rebound on Friday, but you’ll notice exactly where it failed — at the quarterly or the monthly opening price. Same number, right? So the quarterly and monthly are coming in at 1.1734.
That is the critical level for next week. If the Euro is going to move higher, then that’s where it needs to be — it needs to get above that level and stay above it. Yes, we have an MA diff cross, and it’s been very accurate showing the retracement back up to the calendar monthly opening price.
But the question is: can we get above it? Well, in most cases, at the end of the month, the Euro doesn’t usually fare well against the Dollar. But there’s a lot that could help the Euro in this situation.
When we look at the indicators in VP, that neural index is pointing down. We have a medium-term crossover, but we don’t have a long-term crossover. The predicted RSI is not holding above the 60 level. We’re looking for momentum here, guys — not overbought and oversold.
So, that’s a little concerning to me that this could just be a correction higher and nothing more.
Again, watch the key level 1.1734 — or for the more savvy traders, I always like to give something to the bulls and the bears. The bulls would have a buy stop above 1.1740, and the bears would have a sell stop below the Tcross long at 1.1660.
USD/CHF ANALYSIS
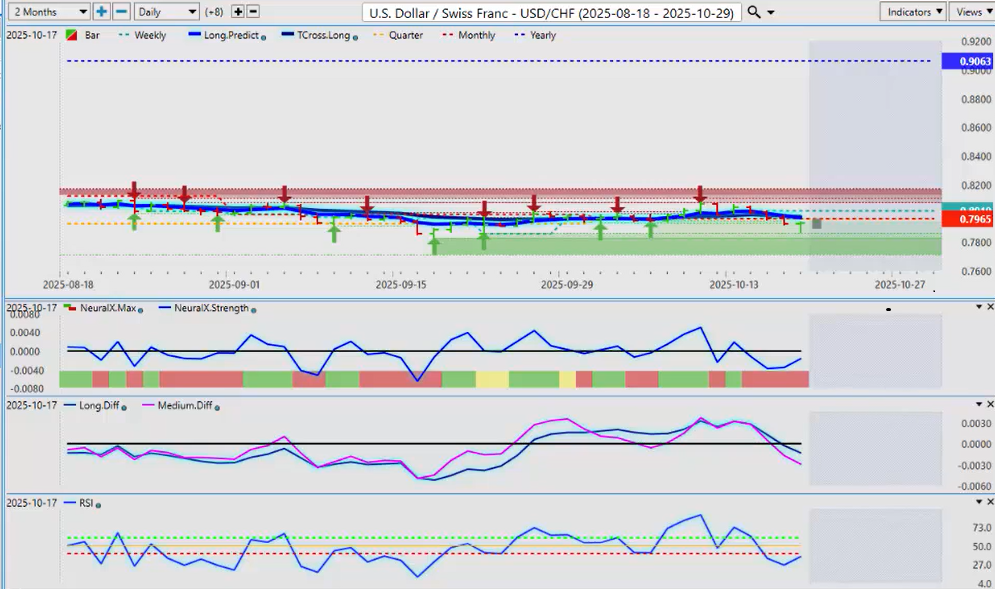
Now, the USD/CHF — again, in most cases in a risk-off environment, which I could argue we’re in with all the different things going on — this would heavily favor the Swiss Franc, and as you can see, it is strengthening, pushing lower.
Another MA diff cross here, but this one has been completed, and both the medium-term strength and the long-term strength are in agreement below the zero line. But I’m going to be keeping a close eye on the predicted RSI — if it can cross back over the 50 level, then the Swiss Franc could be giving up some gains, because remember there is still a carry trade here to some degree.
Again, seeing what the Fed is going to do this month also should be very interesting.
Once again, our key levels are all coming in at the same place. We’ve got our Tcross long, our long predicted 76 — 79.76, 79.78 — and that monthly and quarterly sitting at 79.65.
We’ve closed about 30 pips below there. So, this one could, right out of the gate, start moving lower. That is entirely possible because the indicators in VP are suggesting that could occur. But again, if the stock markets recover, that would likely weaken the Swiss Franc.
GBP/USD ANALYSIS
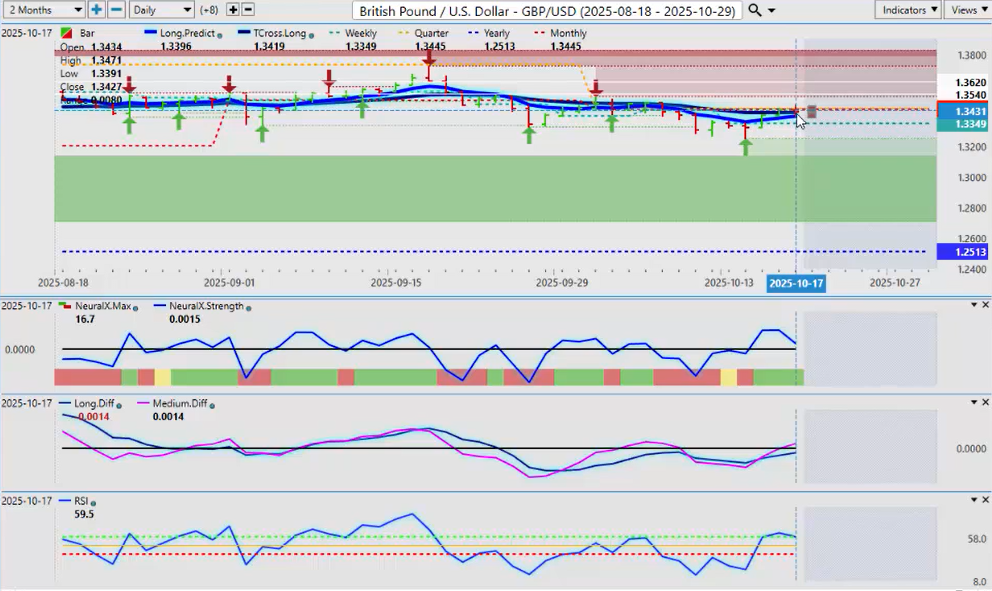
Now, the British Pound/U.S. Dollar — once again, these are all the G7 pairs. You can see that all of them are trying to break out to the upside against the Dollar. So, the MA diff cross is accurate to this point, moving up here.
Again, we’ve got to break through this critical level of that current quarterly opening price to turn positive. So, if we can, then there is a very good long trade potentially right out of the gate on Sunday night — which would be in about an hour and a half from now.
The video you can see is being done Sunday before the market opens at 3:50, because again, just to remind everybody, this is an outlook, not a recap of something that’s already occurred.
So again, if we can break through that level and stay above that level next week, then that’s your new baseline support. But if we can’t stay above it, then the GBP/USD will resume its move to the downside.
USD/JPY ANALYSIS
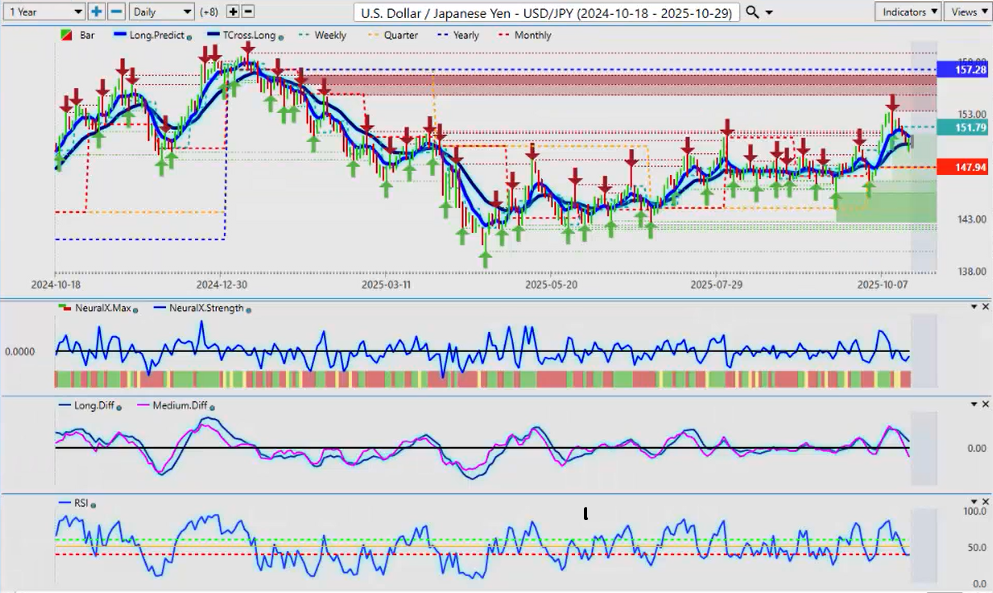
USD/JPY once again under pressure this past week — rightfully so, because again, when we look at the risk-on/risk-off scenario. But you can also see exactly where it recovered and failed on Friday.
I believe potentially for at least the remainder of the month, maybe even the year, that the USD/JPY will remain between the quarterly opening price at 147.94 and the yearly opening price at 157.28.
It’s going to take a shock from the Fed cutting to really push this thing lower. But if the Fed remains on hold, then the carry trade’s back on here, guys, and it’ll start moving back up again.
Right now, we do have a medium-term crossover, but again, you can see we’re lacking momentum. We’re not interested in trading overbought and oversold, guys — we’re looking for momentum, and we just don’t currently have it yet.
Momentum would really pick up if two things occur: we break down below the Tcross long at 150.16, and then we further break down below the quarterly opening price at 147.94.
Quite frankly, with the price of Gold, I’m shocked that that hasn’t happened already, because the Yen and Gold usually have a very high positive correlation to one another, and the Dollar is usually on the other side of that trade. So again, an interesting week ahead.
USD/CAD ANALYSIS
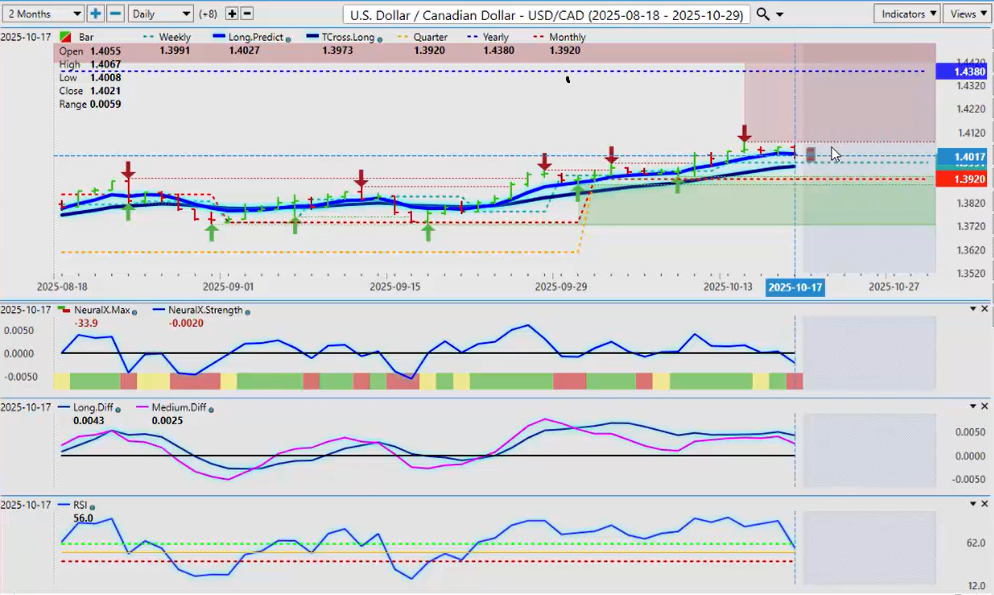
Now, USD/CAD — once again, I still can’t give anybody a really good reason to be buying Canadian dollars. The economy is slowing — just a number of different fundamental problems with the Canadian Dollar, and it’s been soft for a large number of years now.
For now, the Tcross long that’s coming in at 1.3973. We’ve got heavy support down at the quarterly opening 1.3920 with the monthly. Right now, it’s looking a little bit like a retracement here, but as long as we can hold above 1.3920, there’s a good buying opportunity.
Even if the Dollar does weaken right across the board, it’s not likely to give up any gains against the Canadian Dollar. So again, longs remain still heavily favored.
AUD/USD AND NZD/USD OUTLOOK
Now, the Aussie and the Kiwi going into next week — I remain of the opinion that these two currencies, the Kiwi and the Aussie, are grossly undervalued, and I think they’re going to be very, very good long trades in 2026.
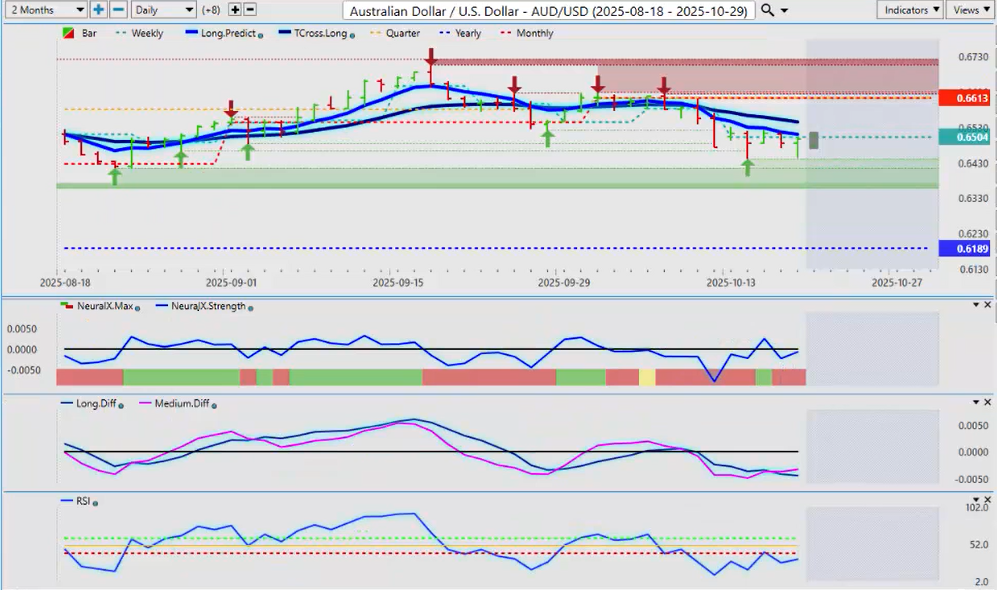
We just got to get through 2025 here and see where all this shakes out. But what I can say is we do have an MA diff cross that is occurring right now. We have a newly formed verified support low coming in at 0.6441.
A lot of stuff going on down here that maybe the naked eye doesn’t see. Watch this area, but I’m going to need a sustained break of that low of 0.6441 to even consider shorting this thing.
Yeah, I think that the U.S. and China will ultimately come to a deal. I don’t know anything about the taco trade or whatever that was called the other week — I’m not getting involved in any of that stuff.
Trump is not chickening out against Canada — he is holding his ground. Will he chicken out against some of the other people? That’s left to be seen.
We have to be careful about putting random, partially accurate statements in the chat box there, because again, that’s true, but only partly true. And again, there’s been no sign of chickening out against Canada. So, will he against China? I guess we will see.
There’s a lot going on here. But for now, if there is a deal between, which I believe there will be, between the U.S. and China, then that is going to heavily favor both the Aussie and the Kiwi.
So again, it’s a fundamental trading environment we’re in right now. But intermarket correlations will always guide us through that.
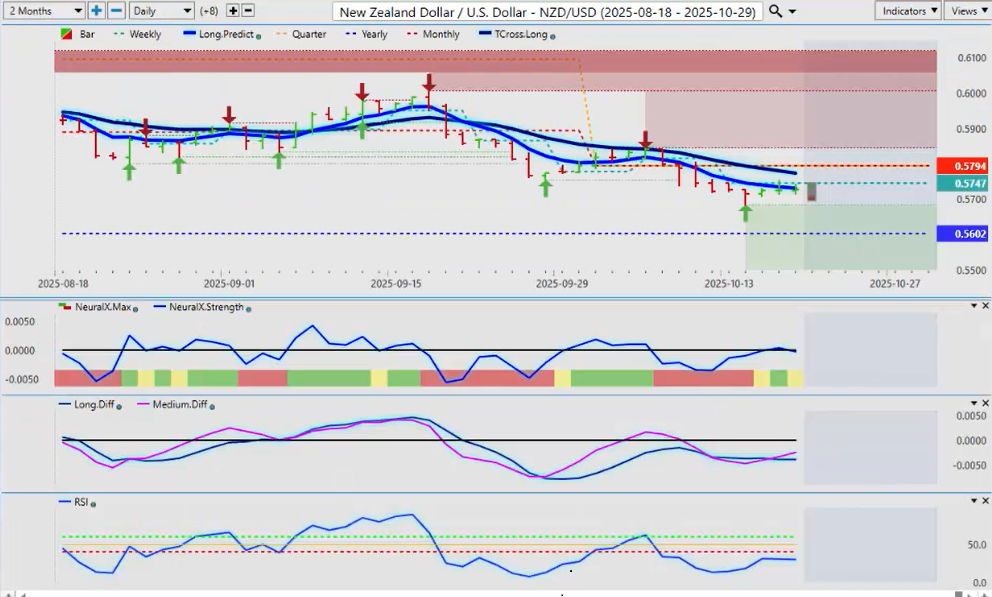
The Kiwi is going to come under the same deal here, guys. It has to get moving out of here, and I need some progress between the U.S. and China on a trade deal.
So, the newly formed verified support low — both the Aussie and the Kiwi are very, very close to their respective yearly opening prices. The U.S. Dollar seldom is strong in November and December, so I think we could have a buy forming here.
And again, that MA diff cross — the pink line over the blue line — the worst possible thing I could say about this extremely powerful indicator in VP is that it’s always early to the party when so many other tools are late.
We’ll see how this one plays out. I will revisit these trades in next week’s outlook, but for now, it will be a choppy week. But with that, I believe opportunity is coming.
So, with that said, this is the Vantage Point AI Market Outlook for the week of October the 20th, 2025.


