









This week’s AI stock spotlight is Rapid7 ($RPD).
Rapid7 is a cybersecurity software and services company based in Boston, Massachusetts. It was founded in 2000, went public in July 2015, and employs about 2,600 people. Its Chief Executive Officer is Wael Mohamed, the former head of Forescout Technologies, who took over on June 1, 2026. Corey Thomas, the longtime chief executive, moved to Executive Chairman. The leadership change is the starting point for almost everything in the current story.
Rapid7 provides security to the teams that defend corporate networks, and it delivers most of it as subscriptions. The company organizes the business around two core areas. Detection and response is the larger one. It includes InsightIDR, the company’s security information and event management product, and its managed detection and response service, in which Rapid7 analysts monitor and respond to threats for customers around the clock. Exposure management is the second. It grew out of the vulnerability-scanning roots of the company and includes InsightVM, Nexpose, InsightCloudSec for cloud environments, and InsightAppSec for applications. Rapid7 also owns Metasploit, one of the best-known penetration-testing frameworks in the industry, and InsightConnect, its automation tool. The company says it serves more than 11,500 customers worldwide.
The competitive field is crowded and well funded. In detection and response, Rapid7 competes with CrowdStrike, Palo Alto Networks, and SentinelOne. In vulnerability and exposure management, its closest rivals are Tenable and Qualys, and Zscaler competes for the same security budgets in cloud access. The differentiation Rapid7 claims is breadth for the mid-market: one Command Platform that combines exposure data with detection data, plus a managed service that lets a company without a large security staff hand the night shift to Rapid7. The new management team is now concentrating on that combination. At Citi’s 2026 Global TMT conference, management said detection and response and exposure management together represent just over 80% of the business, that detection and response alone is just over 55% of revenue and growing about 5%, and that the non-core offerings, roughly 20%, are declining. Management also said exposure management has fallen behind market growth and that the company has “a lot of work to do” to fix it.
On October 26, 2026, RPD closed at $17.93, up 20.25%, or $3.02, from the prior close of $14.91. It opened at $14.88, which was also the low of the session, and traded as high as $18.11. Volume was about 5.18 million shares, against an average of roughly 2.0 million. Rapid7 did not issue a press release that day. The move came as money rotated out of capital-heavy AI infrastructure names into beaten-down software and cybersecurity stocks, after security peers rallied the prior week on alerts about rogue AI agent threats, and as Rapid7 pushed further into securing enterprise AI agents. The October 26 session capped a five-session run of 35.63% from the October 19 close of $13.22. The stock is relevant this week because it has rallied above every published analyst price target, it reports third-quarter results on November 4, and its largest debt maturity is less than five months away.
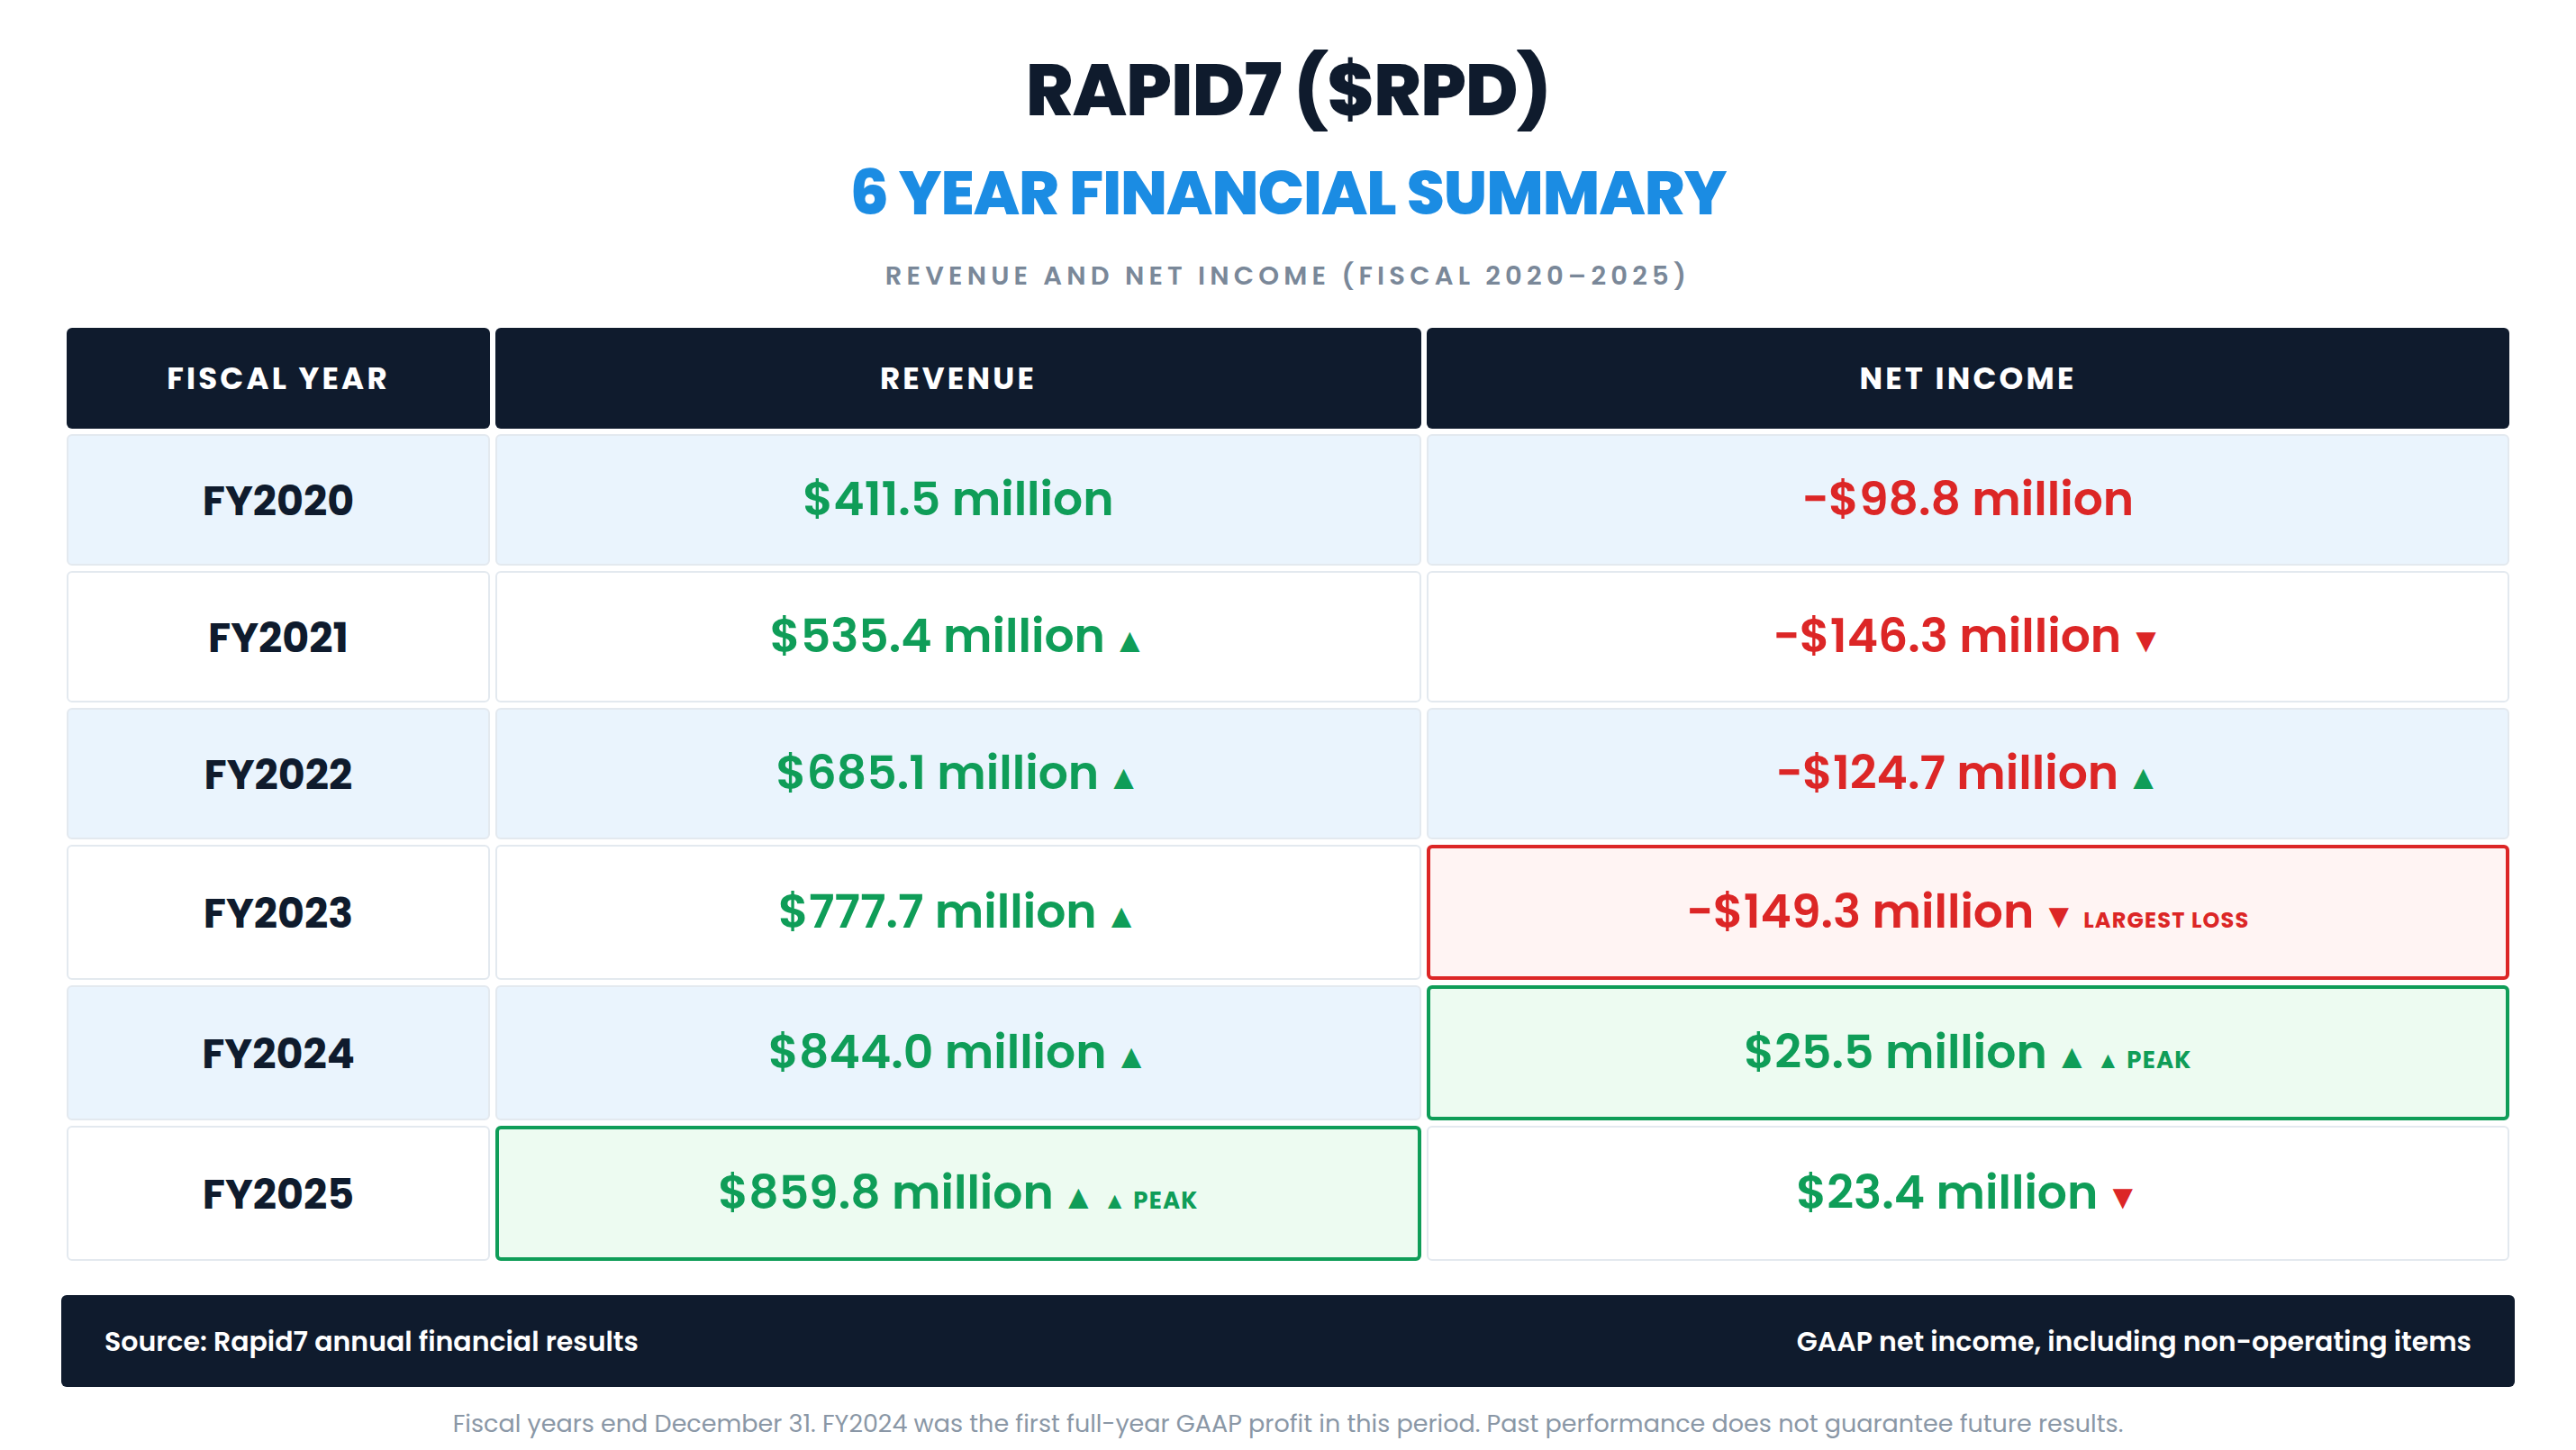
Rapid7 uses a calendar fiscal year. Revenue grew every year in the table, from $411.5 million in fiscal 2020 to $535.4 million in fiscal 2021, $685.1 million in fiscal 2022, $777.7 million in fiscal 2023, $844.0 million in fiscal 2024, and $859.8 million in fiscal 2025. Across the six years, revenue rose 108.94%. Net income tells a different story. Rapid7 lost $98.8 million in fiscal 2020, $146.3 million in fiscal 2021, $124.7 million in fiscal 2022, and $149.3 million in fiscal 2023, the largest loss in the table. It reported its first full-year GAAP profit of the period in fiscal 2024, $25.5 million, or $0.40 per share, and followed it with $23.4 million, or $0.36 per share, in fiscal 2025. Cumulative net income across the six years is a loss of $470.2 million.
Here is the number the annual table hides. Revenue growth was 30.11% in fiscal 2021, 27.96% in fiscal 2022, 13.52% in fiscal 2023, 8.53% in fiscal 2024, and 1.87% in fiscal 2025. The rising bars in the revenue column conceal a growth rate that has collapsed in a straight line, and the company’s own fiscal 2026 outlook calls for revenue of $837 million to $841 million, a decline of 2% to 3%. The distinction matters. The profit that arrived in fiscal 2024 did not come from faster growth. It came from cost discipline applied to a business that was slowing down. Fiscal 2025 gross profit was $604.8 million, a gross margin of 70.34%, and research and development expense was $190.7 million.
The cash flow line is the strongest number Rapid7 has. Free cash flow was negative $8.9 million in fiscal 2020, then $44.9 million, $57.8 million, $99.9 million, $168.2 million, and $144.5 million in fiscal 2025. Fiscal 2025 free cash flow was 16.81% of revenue and 11.96% of the company’s market value of about $1.21 billion at the October 26 close. For fiscal 2026, the company is guiding to free cash flow of approximately $130 million. A software company producing cash at that rate is not usually priced near one times sales. Rapid7 is, and the reason is on the balance sheet.
At June 30, 2026, Rapid7 held $425.6 million in cash and equivalents and $277.0 million in short-term investments, together $702.6 million. Against that, it carries two convertible note issues: $600.0 million of 0.25% notes due March 15, 2027, now classified as a current liability, and $300.0 million of 1.25% notes due March 15, 2029. Holders may begin converting the 2027 notes on December 15, 2026, and Rapid7 can settle conversions in cash, shares, or a combination. The company has said it is preparing for repayment of the 2027 notes, and it has a $200 million revolving credit facility with no borrowings outstanding. If the 2027 notes are retired in cash, the cash and investment balance at June 30 would cover them with about $102.6 million to spare, before the free cash flow generated in the meantime. Rapid7 does not pay a regular dividend, has not paid a special dividend, and did not repurchase shares in fiscal 2025.
The second quarter of 2026, reported on August 10, was the first report under the new chief executive. Revenue was $210.9 million, down 1.5% from a year earlier, and ahead of the consensus estimate of $208.2 million. Annualized recurring revenue, the metric software investors watch most closely, was $824.0 million, down 2.0%. GAAP net income was $6.1 million, or $0.09 per diluted share, and non-GAAP earnings were $0.44 per share, against an estimate of $0.35. Free cash flow was $31.9 million. The company announced a restructuring that affected about 12% of its workforce, mainly in sales and marketing, with charges of roughly $10 million to $11 million. It also raised its full-year non-GAAP earnings outlook to $1.78 to $1.83 per share and set a target of exiting 2026 at a 20% non-GAAP operating margin. The stock rose 15.25% the next day.
“Rapid7 is a good company ready to be great, but getting there requires clear choices, strong execution, and the discipline to focus on what matters most,” Mohamed said in the release. Customers, he said, “want us to go deeper in Detection and Response and Exposure Management, not wider.” The new leadership team now includes a new Chief Financial Officer, a new Chief Commercial Officer, and a new Chief Product and Technology Officer charged with building an AI-first platform.
What the quarter proves is that management can raise profitability on a flat revenue base. What it does not prove is that the revenue base has stopped shrinking. Third-quarter guidance calls for annualized recurring revenue of approximately $812 million, down 3%, and revenue of $208 million to $210 million, down 4% to 5%. Every expansion in margin so far has come from cost, not from growth.
Traders are really asking two questions now. First, can the new management team turn annualized recurring revenue from shrinking to growing, so that the margin gains become something more durable than a cost cut? Second, has a 20.25% single-day jump, driven by sector rotation and an AI-security narrative rather than company news, already priced in a turnaround that the November 4 report has not yet shown?
The bullish evidence is concrete. Rapid7 produced $144.5 million of free cash flow in fiscal 2025 and guides to about $130 million in fiscal 2026 on a market value of about $1.21 billion. It has reported a GAAP profit in each of the last two full years. Detection and response, more than half the business, is still growing. The August report beat on revenue and on earnings, and management raised the full-year earnings outlook. The stock has risen 260.76% from its April 9, 2026 low of $4.97 to the October 26 close, and it has outperformed every major index over one week, one month, three months, and year to date.
That is also where the market could be wrong. The main risk case has four parts. The first is growth. Annualized recurring revenue and revenue are both declining, and management’s own third-quarter guide calls for the decline to widen. The second is the balance sheet. The $600 million 2027 maturity consumes most of the cash and investment balance, and the conversion window opens on December 15. The third is analyst positioning. All 15 published price targets sit below the October 26 close, and four of them carry bearish ratings. The fourth is history. In the two earnings reports before August, the stock fell 19.94% on November 5, 2025, and 28.97% on February 11, 2026. The biggest risk is that the story is wearing a convincing disguise: a 20% jump in a sector rotation can look like proof of a turnaround, when the revenue line is still moving the other way.
The catalyst calendar is short. Rapid7 reports third-quarter results on November 4, 2026, after the market close, nine days after the October 26 data date. Consensus calls for non-GAAP earnings of $0.45 per share on revenue of about $209.0 million, inside the company’s own ranges of $0.44 to $0.47 and $208 million to $210 million. Traders should watch annualized recurring revenue against the roughly $812 million guide, detection and response growth, any change to the fiscal 2026 free cash flow outlook, progress toward the 20% exit margin, and any detail on how management plans to settle the 2027 notes. December 15, when 2027 note holders may begin converting, is the next date after that.
This setup suits swing traders and event traders who can hold through an earnings report that has produced a 28.97% single-day decline within the past year, and who size the position for that kind of move. Over the past 20 sessions, the average daily range was $0.95, or 7.24% of the prior close, and the October 26 session alone covered $3.23. It is a poor fit for anyone looking for a dividend, a steady compounder, or a stock that trades on its own news alone. The same shares fell 11.21% on July 21, 2026, rose 24.05% on September 14, 2026, and rose 20.25% on October 26, 2026.
The early-warning signal to watch is whether the October 26 gain holds. The session opened at $14.88, three cents below the October 23 close of $14.91, and never traded below that open. A close back below the October 23 close would say the market has handed back the entire jump. A close below the October 22 close of $14.73 would erase the start of the rotation rally, and a close below the October 16 close of $12.61 would put the stock back inside the range it held for most of October. None of those levels matters as much as November 4. A strong recurring revenue figure can carry a stretched chart. A miss can break a strong one.
So the picture heading into this week is a cash-generating security company with a new management team, a shrinking top line, a large debt maturity in March, and a share price that has run through the entire analyst target range in a matter of days. The trend says stay interested. The volatility says stay alert. With that in mind, here is what the professional analyst community currently expects.
Wall Street Analysts Annual Forecasts
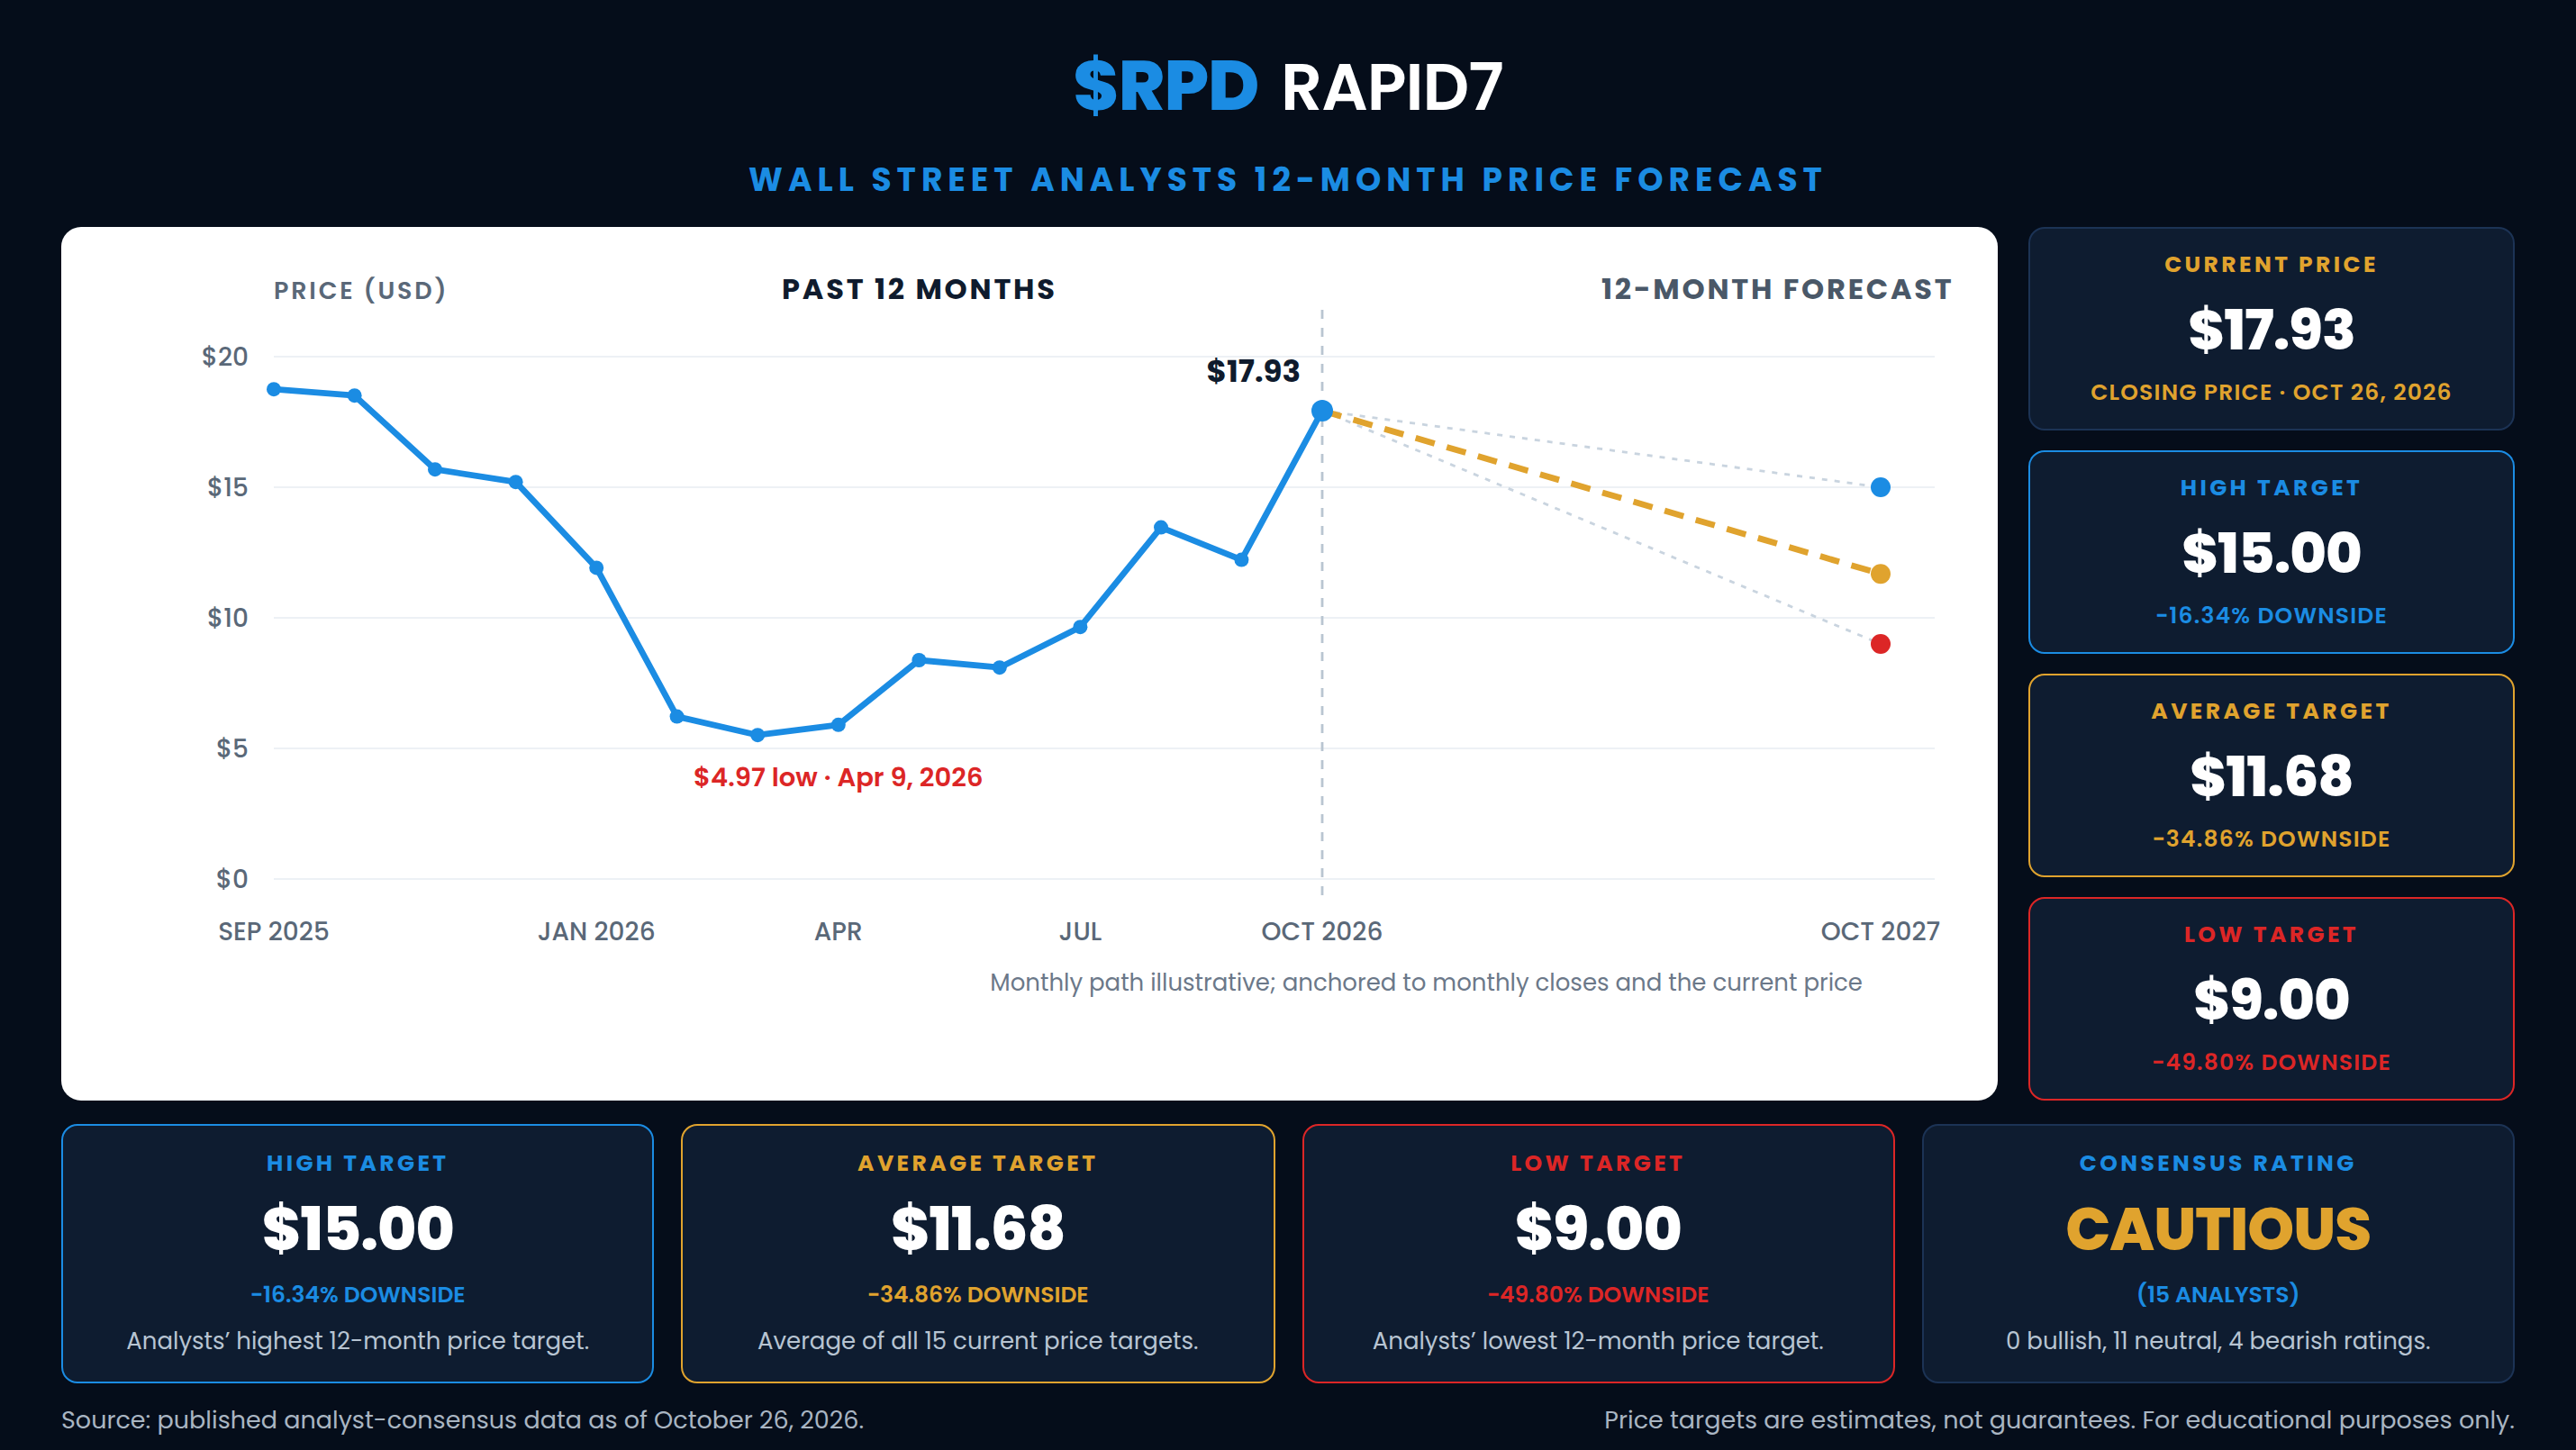
Fifteen analysts are included in the current published consensus for Rapid7, and the consensus is cautious, with no bullish ratings, 11 neutral ratings, and four bearish ratings. The average 12-month price target is $11.68, the median target is $12.00, the high target is $15.00, and the low target is $9.00.
Measured against the October 26, 2026 close of $17.93, the average target implies a 34.86% decline. The median target implies a 33.07% decline. The high target implies a 16.34% decline. The low target implies a 49.80% decline. The spread between the high and low target is $6.00, which is 51.37% of the average target and 33.46% of the current share price.
This is the rare case where the entire consensus sits below the market. Most of the targets were set on August 11 and 12, the two sessions after the second-quarter report, when the stock closed at $13.38 and $12.27. That wave included Susquehanna’s Neutral rating at $15, the high target, raised from $7; Canaccord Genuity’s Hold at $14, raised from $7; Stifel’s Hold at $13, raised from $7; Piper Sandler, UBS, RBC Capital, and Stephens at $12; Barclays’ Underweight at $12; Baird’s Neutral and Scotiabank’s Sector Perform at about $10; and DA Davidson’s Underperform at $9, the low target. Morgan Stanley downgraded the stock to Underweight with a $9 target on July 21, and Truist holds a Hold at $10 from the same date. The two most recent actions point in opposite directions. JPMorgan downgraded Rapid7 to Underweight with a $12 target on September 15. Mizuho kept its Neutral rating on October 15 and raised its target to $13 from $11, citing healthy third-quarter channel checks.
The practical takeaway is that the analysts raised their targets sharply after August and still have not caught up with the stock. Several targets roughly doubled in a single revision, and the price has risen 34.01% from the August 11 close since then. Either the targets move higher after the November 4 report, or the price is ahead of the fundamentals the analysts are modeling. Price targets are estimates of what a security might be worth over a twelve-month horizon under a specific set of assumptions. They are not certainties.
52-Week High and Low Boundaries Analysis
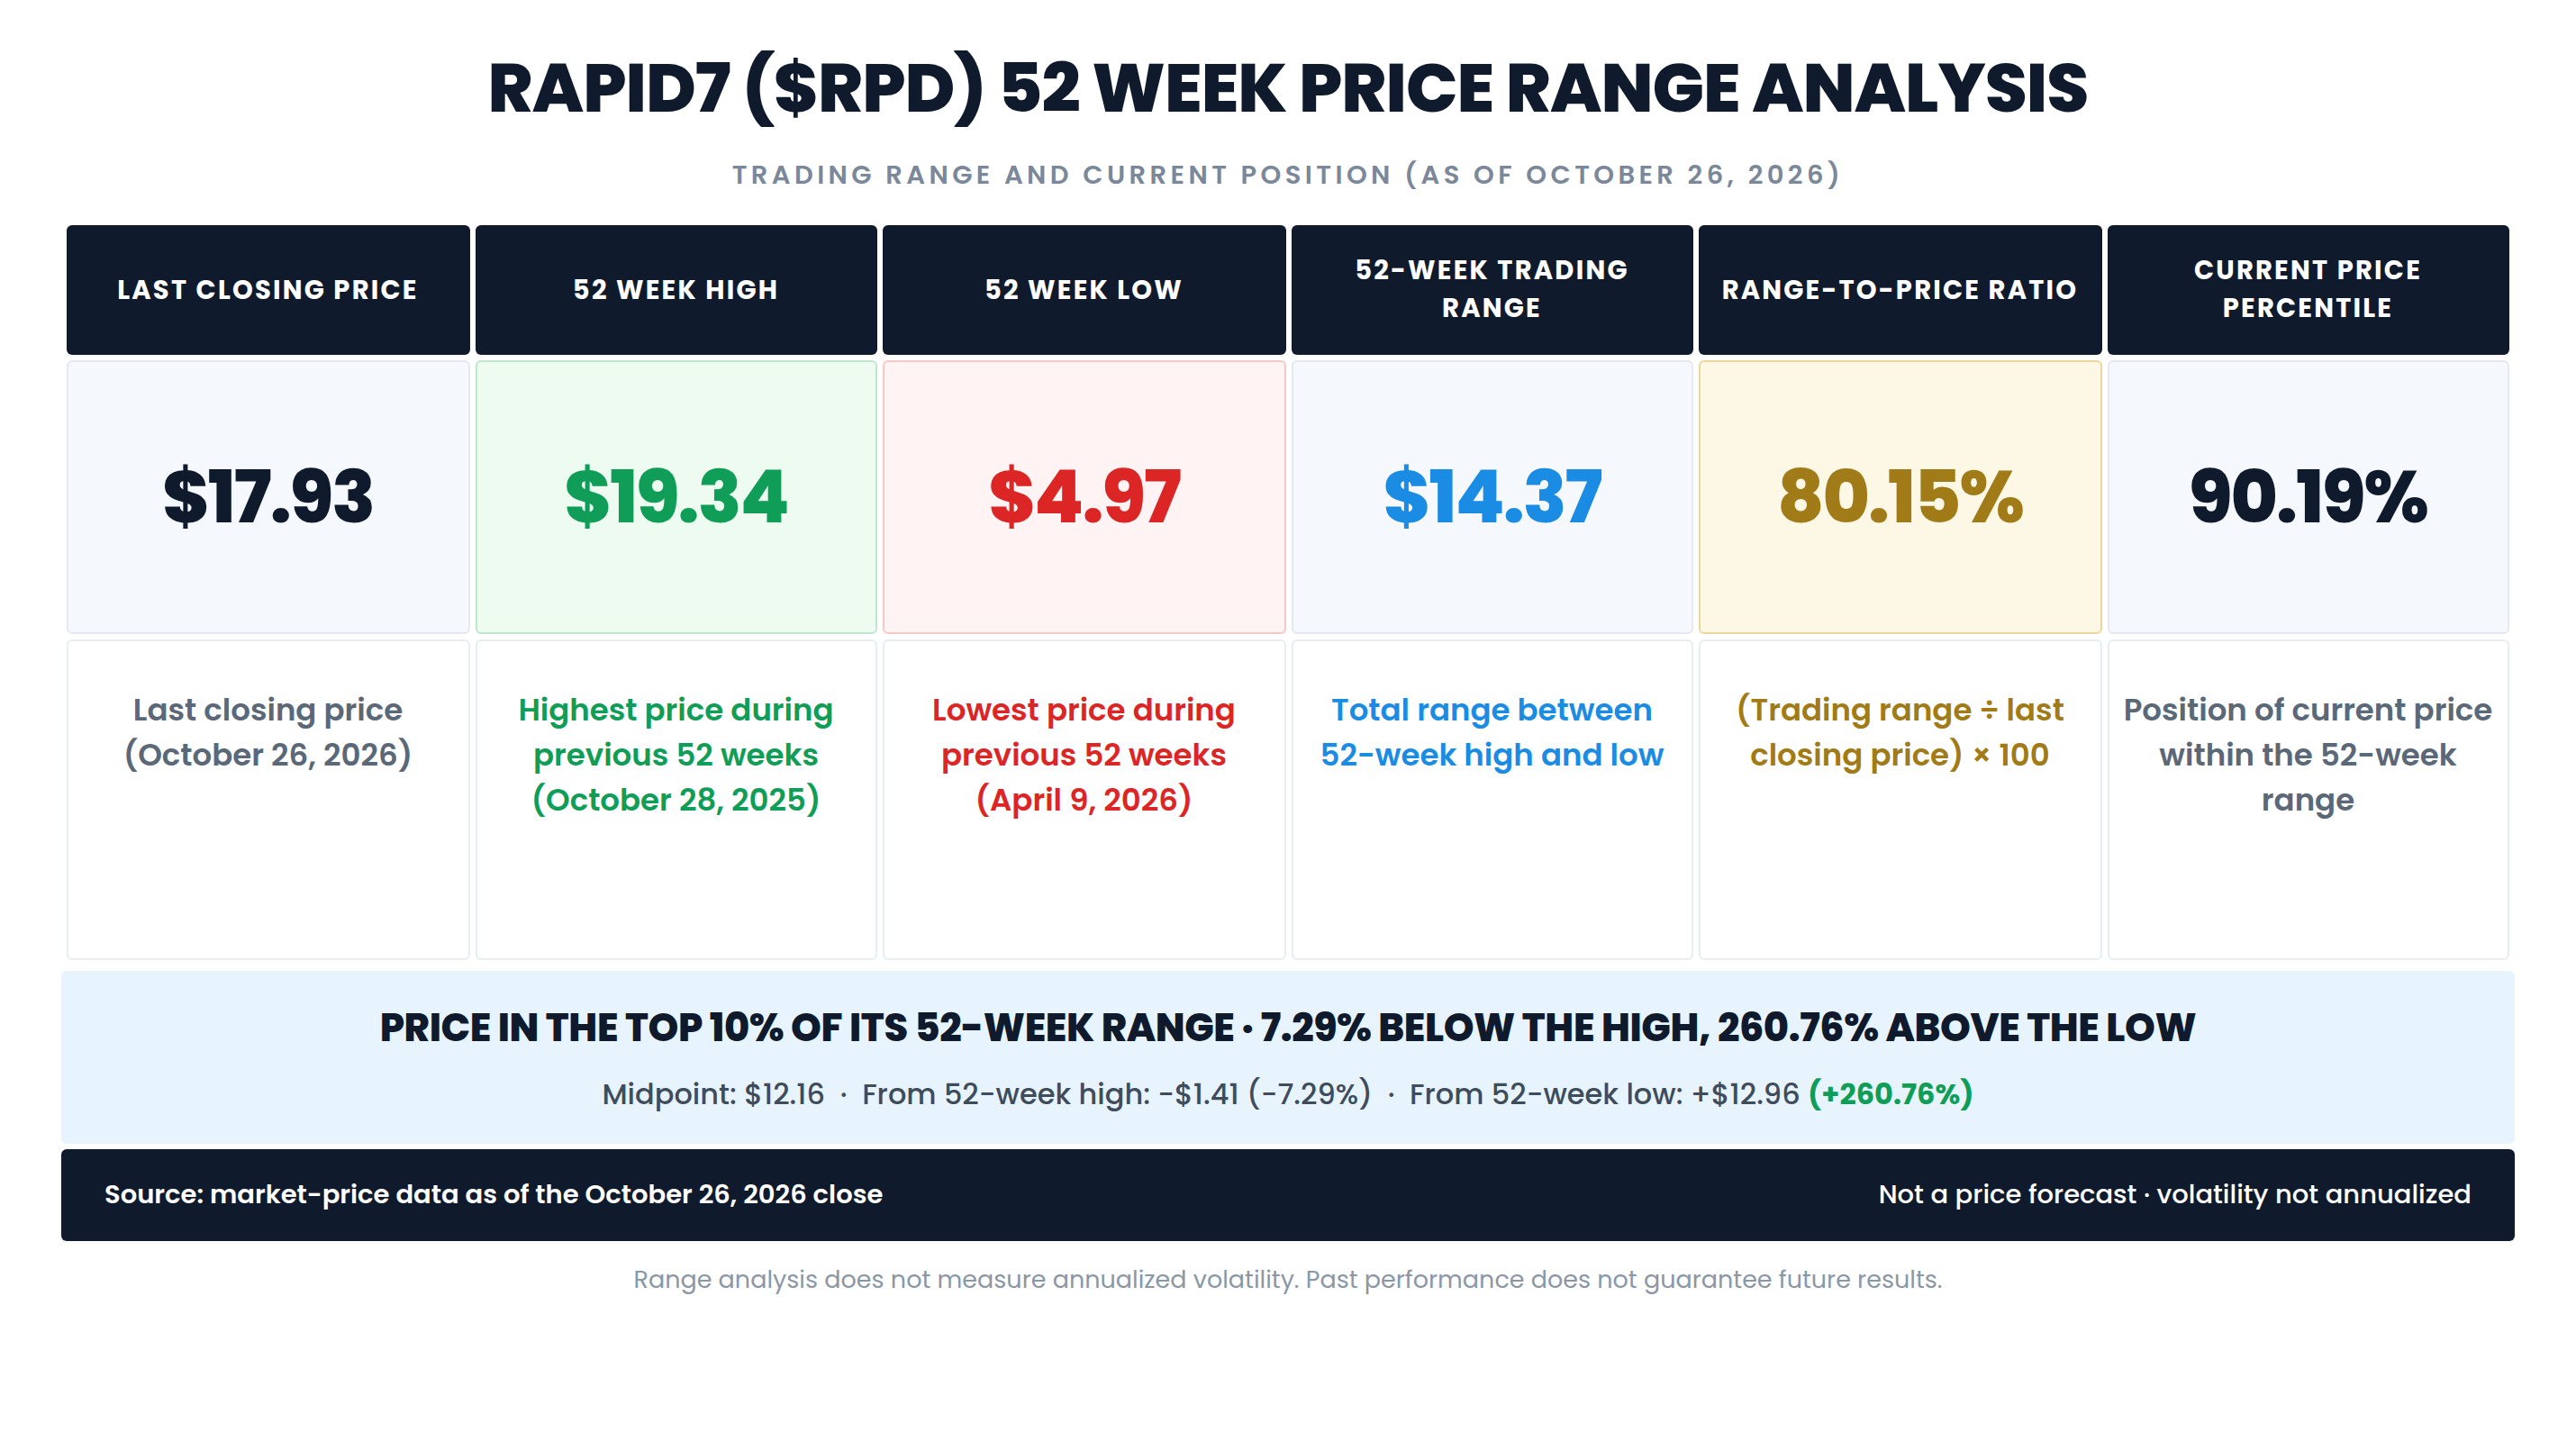
RPD’s 52-week high is $19.34, set on October 28, 2025, and its 52-week low is $4.97, set on April 9, 2026.
The 52-week trading range is $14.37. Divided by the $17.93 closing price, that produces a range-to-price ratio of 80.15%, meaning the distance between the year’s high and low is four-fifths of today’s share price. The stock sits at the 90.19th percentile of its range. The midpoint of the range is $12.16, and the October 26 close is 47.51% above that midpoint, a gap of $5.78. The stock needs a 7.86% gain, or $1.41, to reach the 52-week high, and it is 260.76% above the 52-week low.
That combination describes a full round trip. The 52-week high was set two days into the window, before the November 2025 and February 2026 earnings reports took the stock down by three-quarters. The October 26 close has now recovered nine-tenths of that distance. A stock sitting in the top tenth of its range after a decline this large is not in a quiet recovery. It is close to testing the level where the slide began.
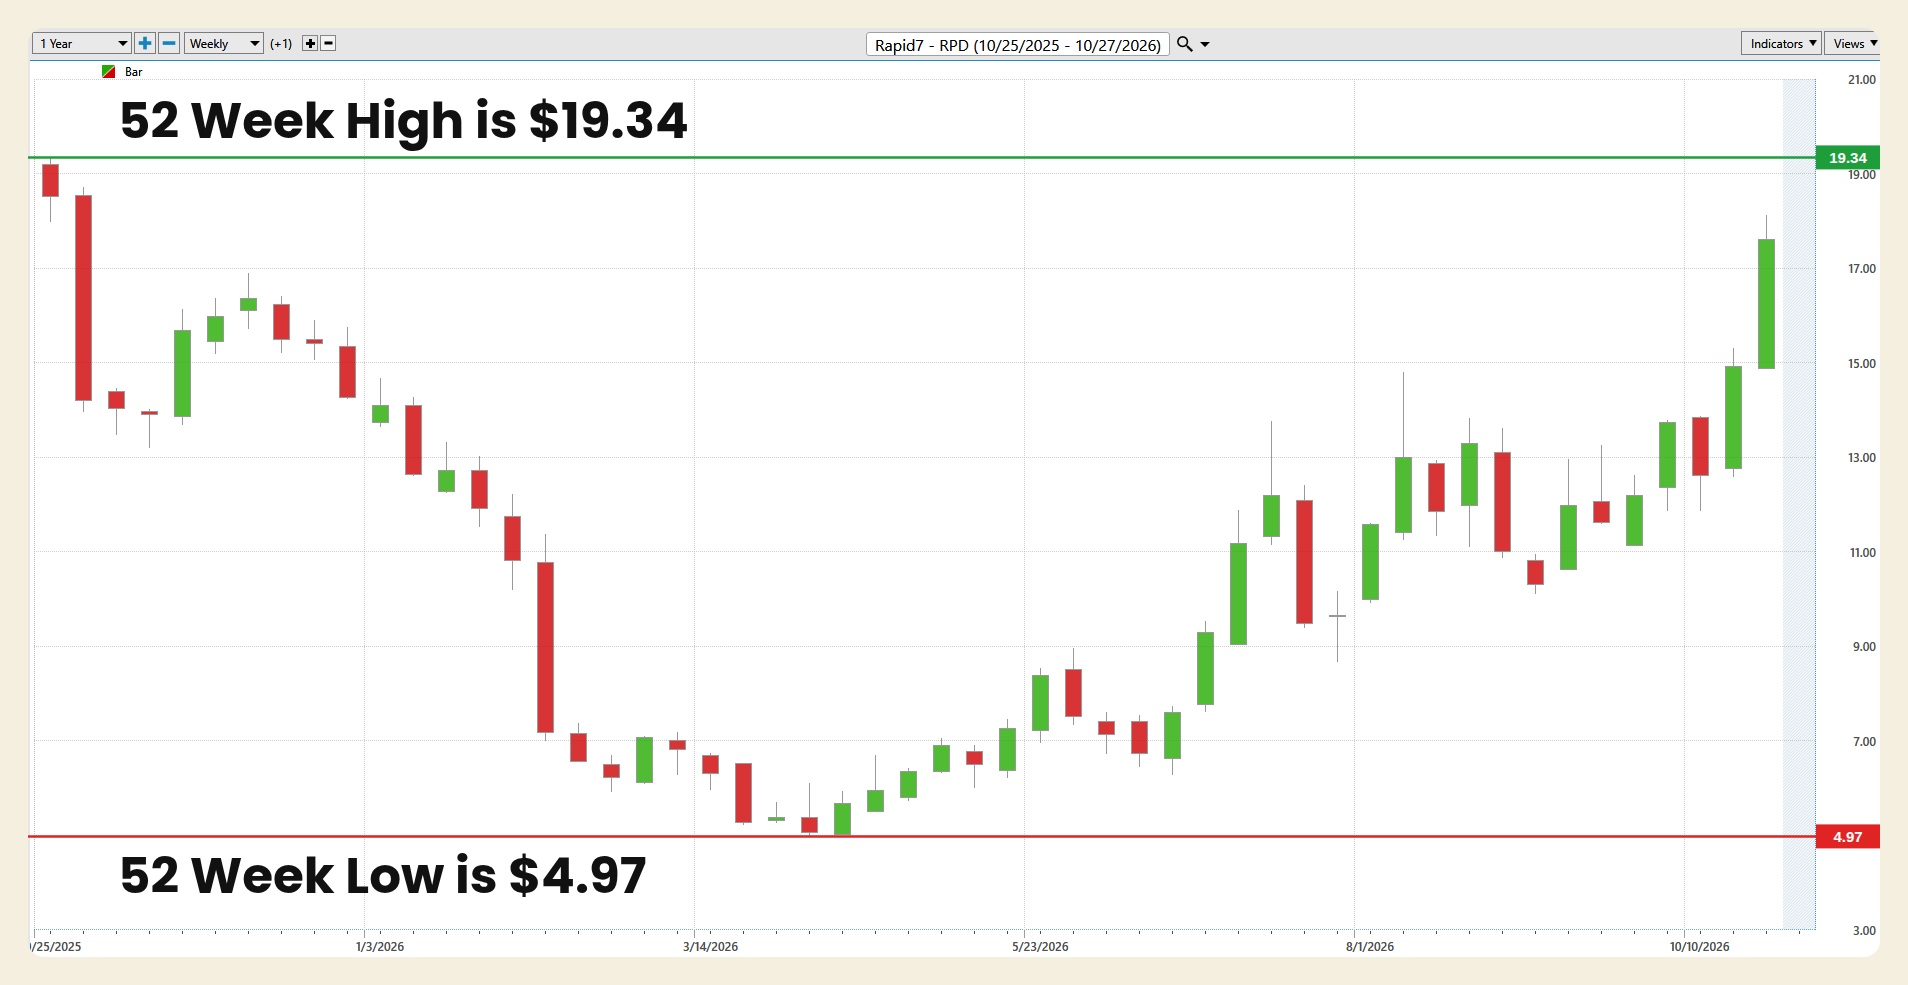
The one-year weekly chart is a slide, a base, and a sharp recovery. The left side shows the stock near $19 in late October 2025. The first large red candle is the week of the November 2025 earnings report, which took the stock into the $14s. A brief rebound into the $16s faded through December and January, and the second large red candle, in February 2026, is the week of the fourth-quarter report and the soft 2026 outlook, which pushed the stock into the $7s. The base formed through March and April, with the $4.97 low on April 9. The recovery started in May, continued through the summer after the new chief executive took over in June, and pushed into the $13s after the August report. September and early October held a range between roughly $10 and $14. The final candle turns sharply higher, through the top of that range and toward the 52-week high line. The weekly chart window extends one bar past the October 26 data date. This analysis uses the October 26 close.
Best-Case/Worst-Case Analysis
The best-case historical moves are large. From the March 16, 2020 intraday low of $31.34, RPD rose 362.67% to its November 4, 2021 all-time high of $145.00. Inside the current 52-week window, the stock has gained 260.76% from the April 9, 2026 low of $4.97 to the October 26 close, and 264.39% from that low to the October 26 intraday high of $18.11. Single sessions have repeatedly reset the chart: RPD rose 15.25% on August 11, 2026, after the second-quarter report, 24.05% on September 14, 2026, and 20.25% on October 26, 2026.
The worst-case historical moves are just as severe. From the November 4, 2021 high of $145.00, the stock fell 96.57% to the April 9, 2026 low of $4.97. Inside the 52-week window, it fell 74.30% from the October 28, 2025 high of $19.34 to that same low. Earnings reports did much of the damage: the stock fell 19.94% on November 5, 2025, and 28.97% on February 11, 2026, the sessions after the third-quarter 2025 and fourth-quarter 2025 reports. It fell 11.21% on July 21, 2026, the same day Morgan Stanley downgraded it to Underweight, and 10.77% on September 1, 2026.
Historical gains are not forecasts, and historical losses are not predictions. What these figures show is that this stock has real capacity for movement in both directions, and that a single earnings report has already removed more than a quarter of its value in one session this year. Position sizing and an exit plan matter, particularly with the November 4 report nine days from the October 26 close.
The condition that keeps the bull case alive is a third-quarter report that shows annualized recurring revenue at or above the roughly $812 million guide, continued growth in detection and response, and no retreat from the 20% exit margin or the free cash flow outlook, while the stock holds above the October 23 close of $14.91 and, at a minimum, the October 16 close of $12.61. The change of character that would invalidate the thesis is a close back below the September 11, 2026 close of $10.31, the lowest close since the August report. That would say the market has rejected the turnaround and returned the stock to the bottom of its post-August range. A nearer warning, short of that break, is a close below the October 22 close of $14.73 before the report is even released.
The upside opportunity is substantial but contingent.
Relative Strength Comparison
RPD has lagged the major U.S. benchmarks over the past year and led all of them year to date, over three months, over one month, and over one week. All figures are price returns.
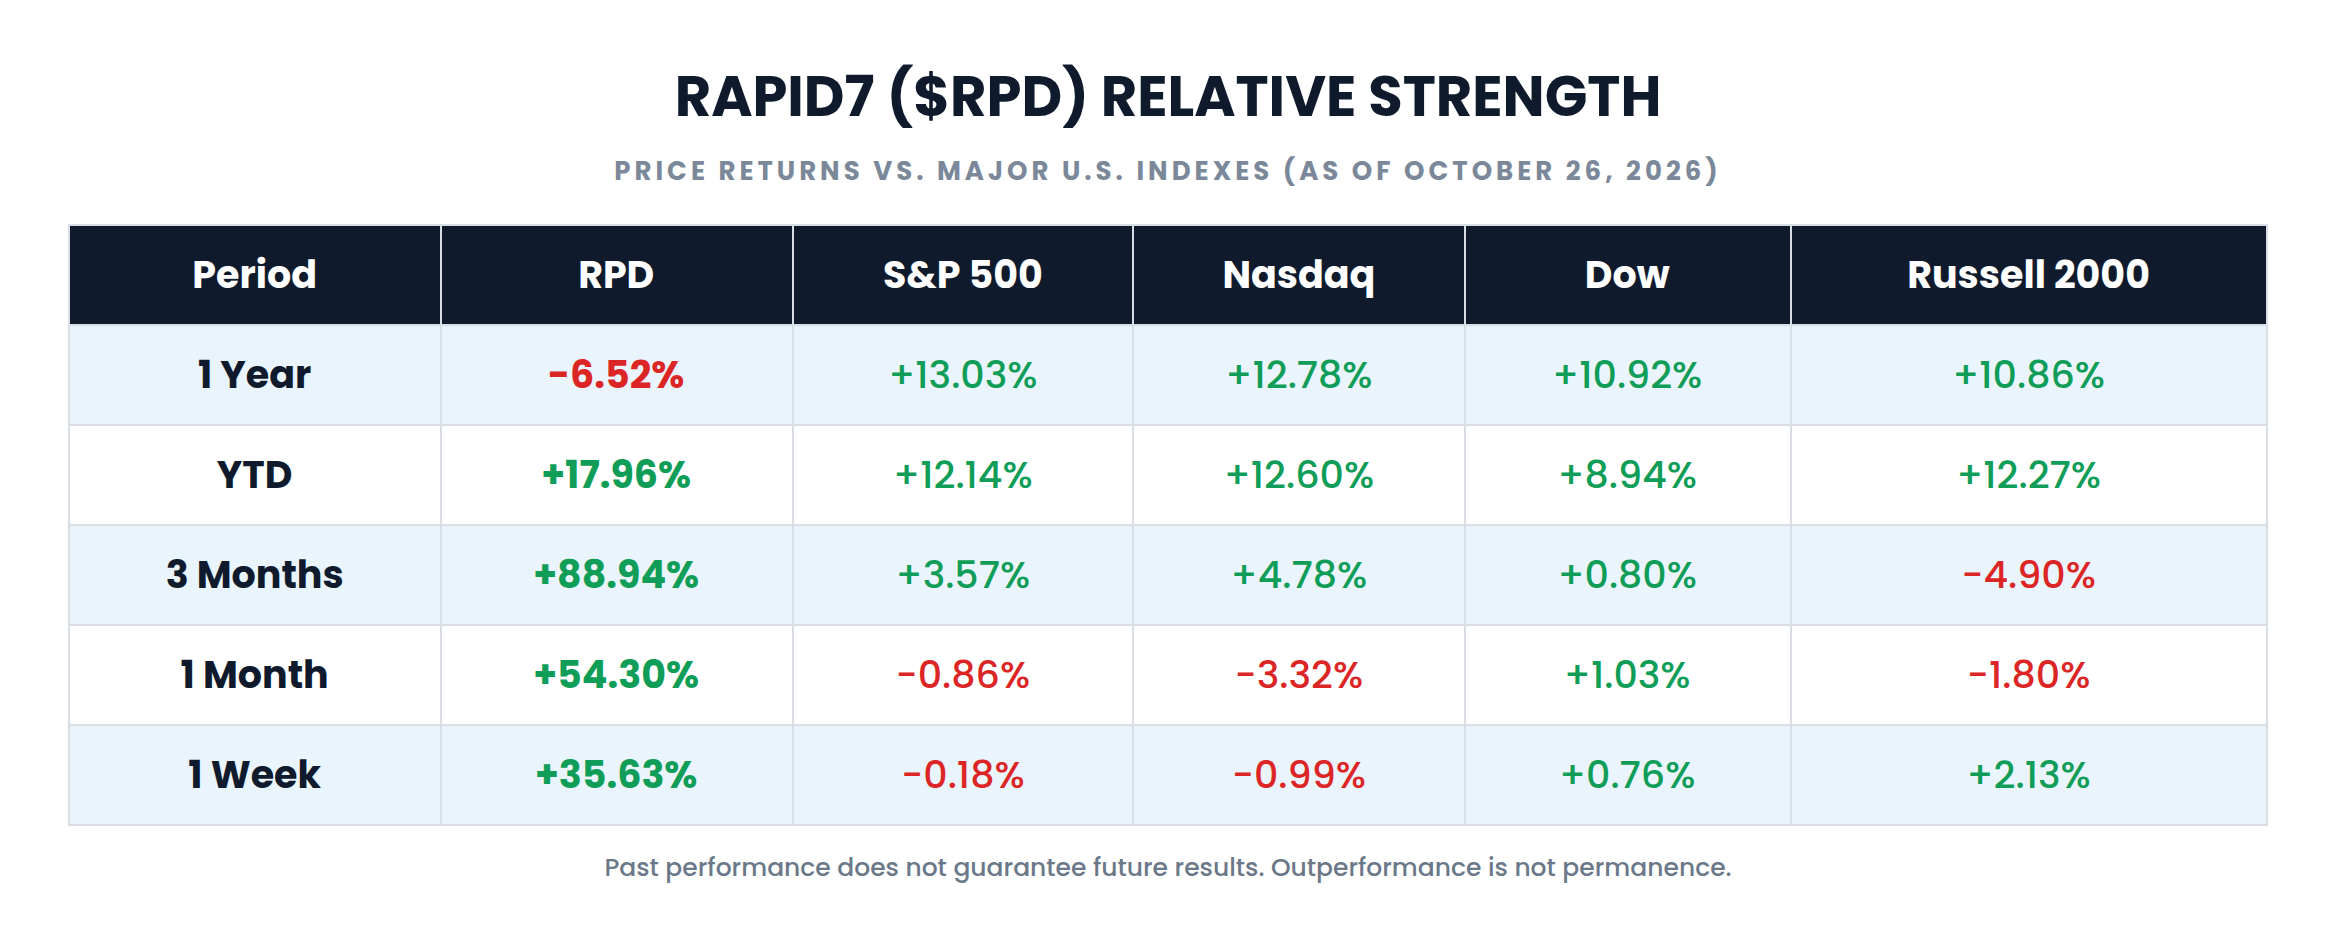
Returns are measured to the October 26, 2026 close from these starting closes: 1 Year, October 24, 2025; YTD, December 31, 2025; 3 Months, July 24, 2026; 1 Month, September 25, 2026; 1 Week, October 19, 2026. October 26, 2025, July 26, 2026, and September 26, 2026 fell on weekends, so those windows use the prior session. S&P 500 refers to the S&P 500 Index, Nasdaq refers to the Nasdaq Composite, Dow refers to the Dow Jones Industrial Average, and Russell 2000 refers to the Russell 2000 Index.
This is a recovery pattern with a very short fuse. The one-year window starts at the October 24, 2025 close of $19.18, before two earnings collapses. RPD is down 6.52% over that year while the S&P 500 is up 13.03%, a gap of nearly 20 percentage points. Year to date, from the December 31, 2025 close of $15.20, RPD is up 17.96% and has moved ahead of every index, but only narrowly ahead of the Nasdaq’s 12.60%. The shorter windows are where the strength is concentrated. Over three months, from the July 24 close of $9.49, RPD is up 88.94% while no index gained more than 4.78%. Over one month it is up 54.30% while the Nasdaq fell 3.32%. Over one week it is up 35.63% while the Russell 2000’s 2.13% was the best index gain.
It is worth being precise about what this kind of relative strength means. More than half of the one-week gain came in a single session, and that session was driven by a rotation into software and security names rather than by a Rapid7 announcement. The Nasdaq was down over the same month that RPD rose more than 50%, which says investors were moving money out of one part of technology and into another. Rotations can become trends. They can also reverse when the money finds a new destination. Outperformance is not permanence.
VantagePoint AI Predictive Blue Line
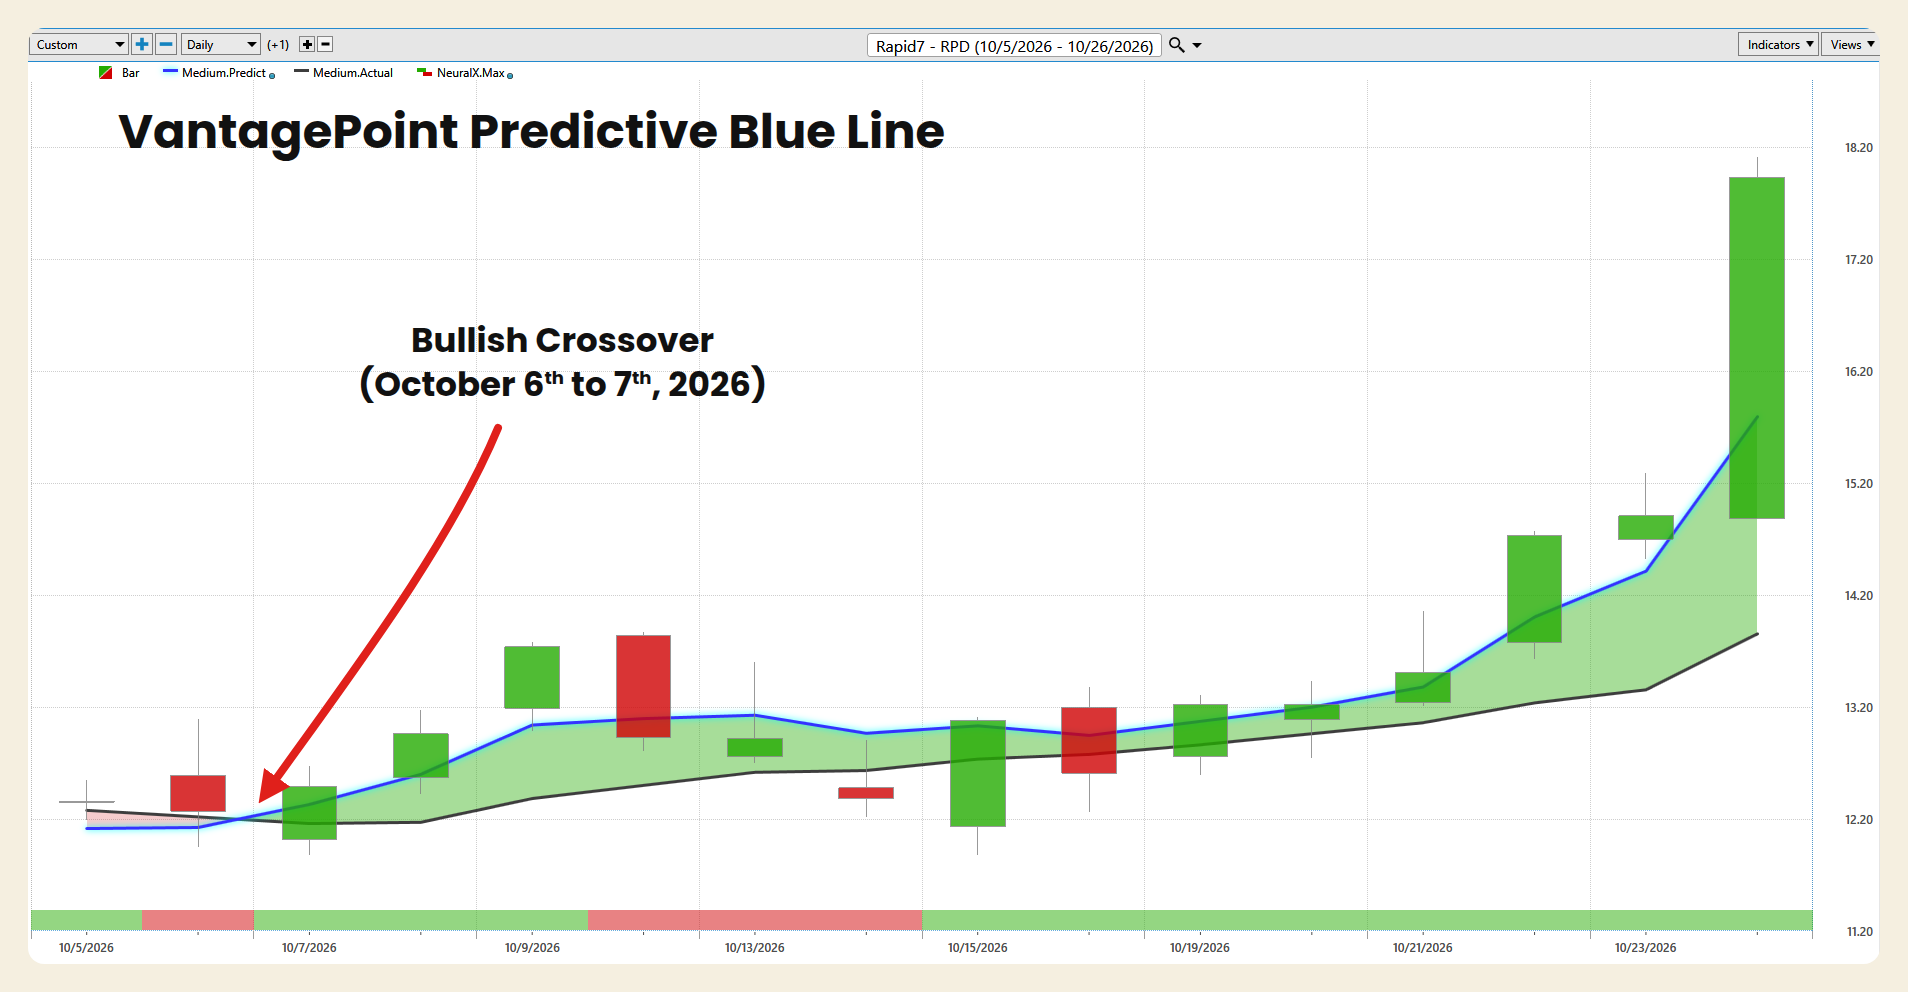
The chart covers October 5 through October 26, 2026. At the start of the window, the Predictive Blue Line sat slightly below the black actual moving average, near approximately $12.13 against approximately $12.25, and the narrow band between them was shaded red while the stock traded in the low $12s. The blue line then crossed above the black line between the October 6 and October 7 sessions, and the shading turned green. That bullish crossover arrived with the stock closing at $12.27 on October 6 and $12.49 on October 7, nearly three weeks before the October 26 jump.
Since the crossover, the blue line has stayed above the black line through the entire window, including the pullback from October 12 through October 14 and the drop on October 16. The two lines ran nearly parallel through mid-October, then the blue line turned up steeply from October 21 onward while the black line rose more gradually. At the right edge of the chart, the blue line sits at approximately $15.80 and the black line at approximately $13.87, a separation of about $1.93, the widest of the window. The October 26 close of $17.93 sits above both lines, about 13.48% above the blue line, which tells you price has run ahead of the forecasted trend as well as the actual one. From the October 6 close, the session before the crossover, the stock is up 46.13%.
The distinction matters. The Blue Line turned in early October, long before the rotation rally, and it held through two pullbacks. The current reading is bullish, with a rising forecast and a widening separation. It is also a short reading, covering about three weeks rather than a completed trend. The reading that would change the picture is a flattening of the blue line followed by a cross back below the black line, especially if that cross arrives around the November 4 report.
VantagePoint AI Neural Index
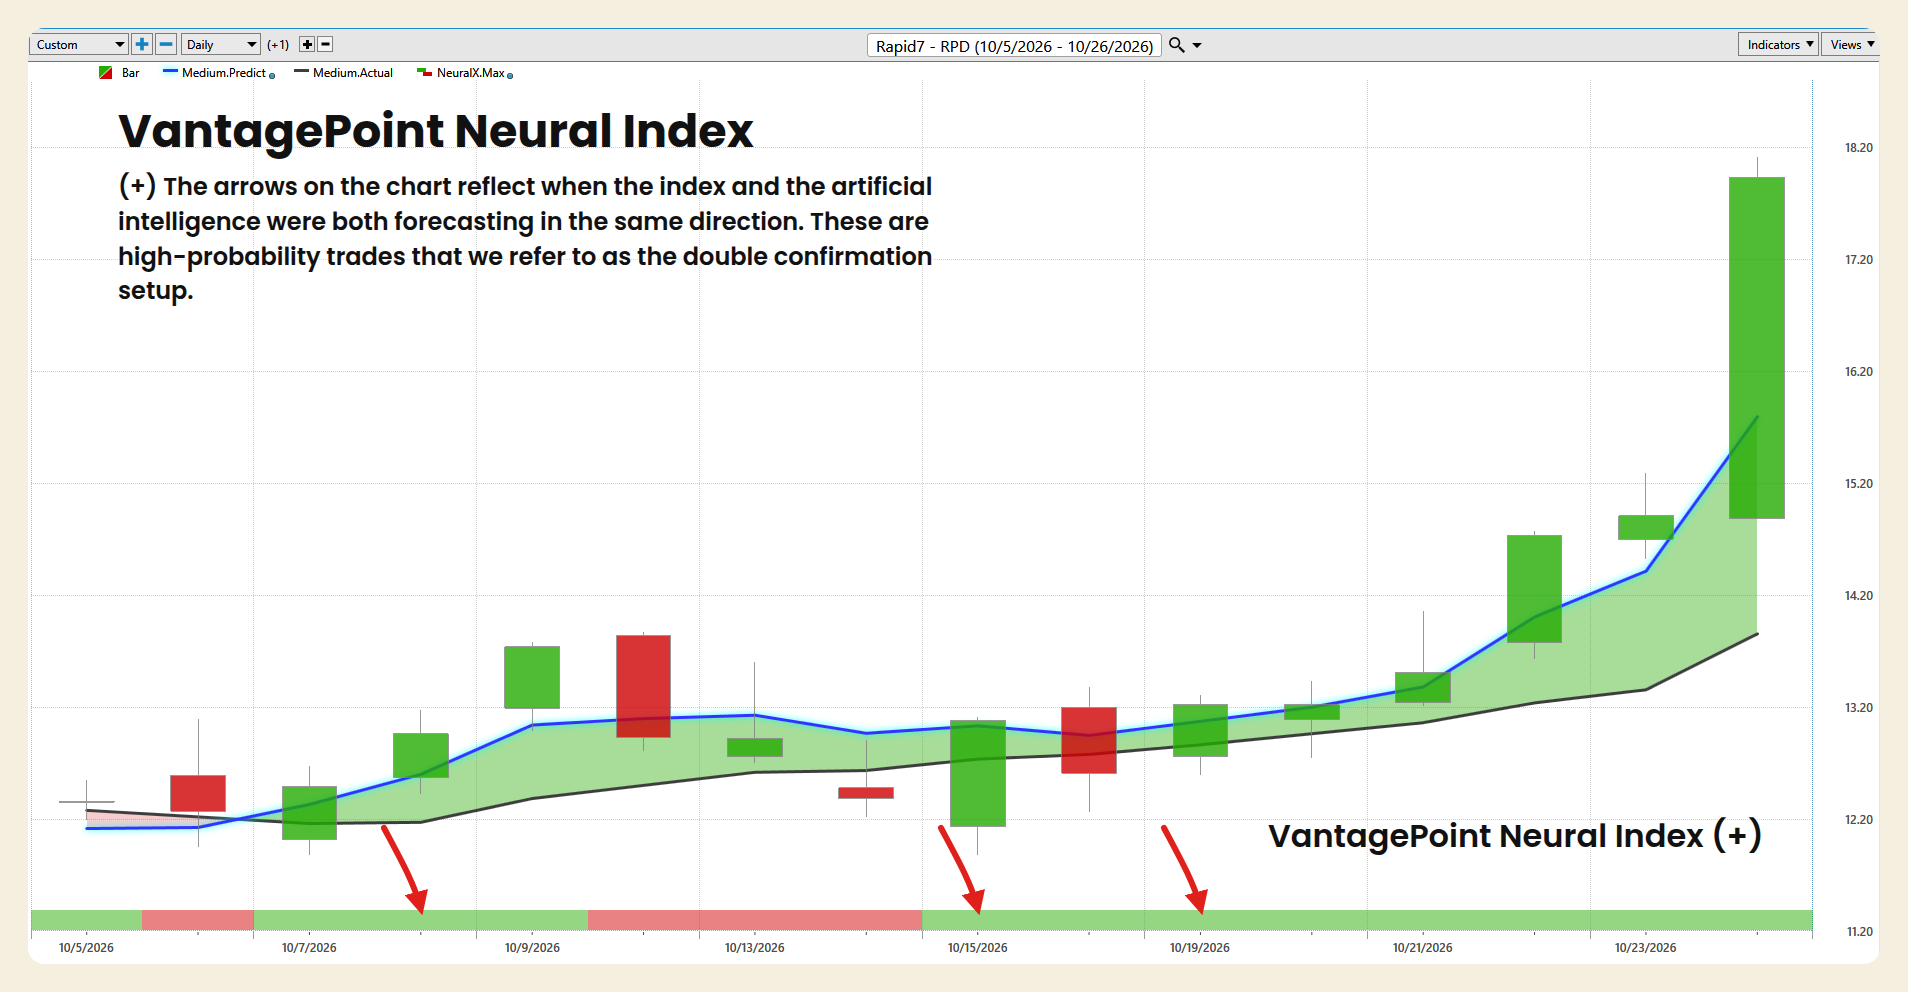
The strip shows two short red interruptions inside a mostly green window. It was green on October 5 and red on October 6. It was green from October 7 through October 9, as the stock climbed from $12.49 to $13.74. It turned red from October 12 through October 14, and those three sessions saw the stock fall from $13.74 to $12.38. It turned green again on October 15 and stayed green through October 26, eight sessions in a row, covering the entire run from $13.08 to $17.93.
When the Neural Index and the Predictive Blue Line agree, VantagePoint refers to the setup as a double confirmation. The blue line crossed above the black line between October 6 and October 7, so every green reading from October 7 onward came with the crossover in place. The double confirmation windows on this chart run from October 7 through October 9 and from October 15 through October 26, and the arrows mark October 8, October 15, and October 19. The red stretch from October 12 through October 14 is a useful reminder of how the indicator behaves. It flagged short-term weakness while the Blue Line stayed bullish, and the stock pulled back during those sessions without breaking the trend. The item to watch now is the next red reading. After an eight-session green run and a 20.25% single-day gain, a red print would be the earliest sign that short-term momentum is cooling, even if the Blue Line still points higher.
VantagePoint AI Daily Range Forecast
The VantagePoint AI Daily Range Forecast projects a predicted high and a predicted low for the next trading session. The red line marks the predicted high and the dark line marks the predicted low. Together they frame where price is expected to trade, giving traders a structure for entries, exits, and stop placement.
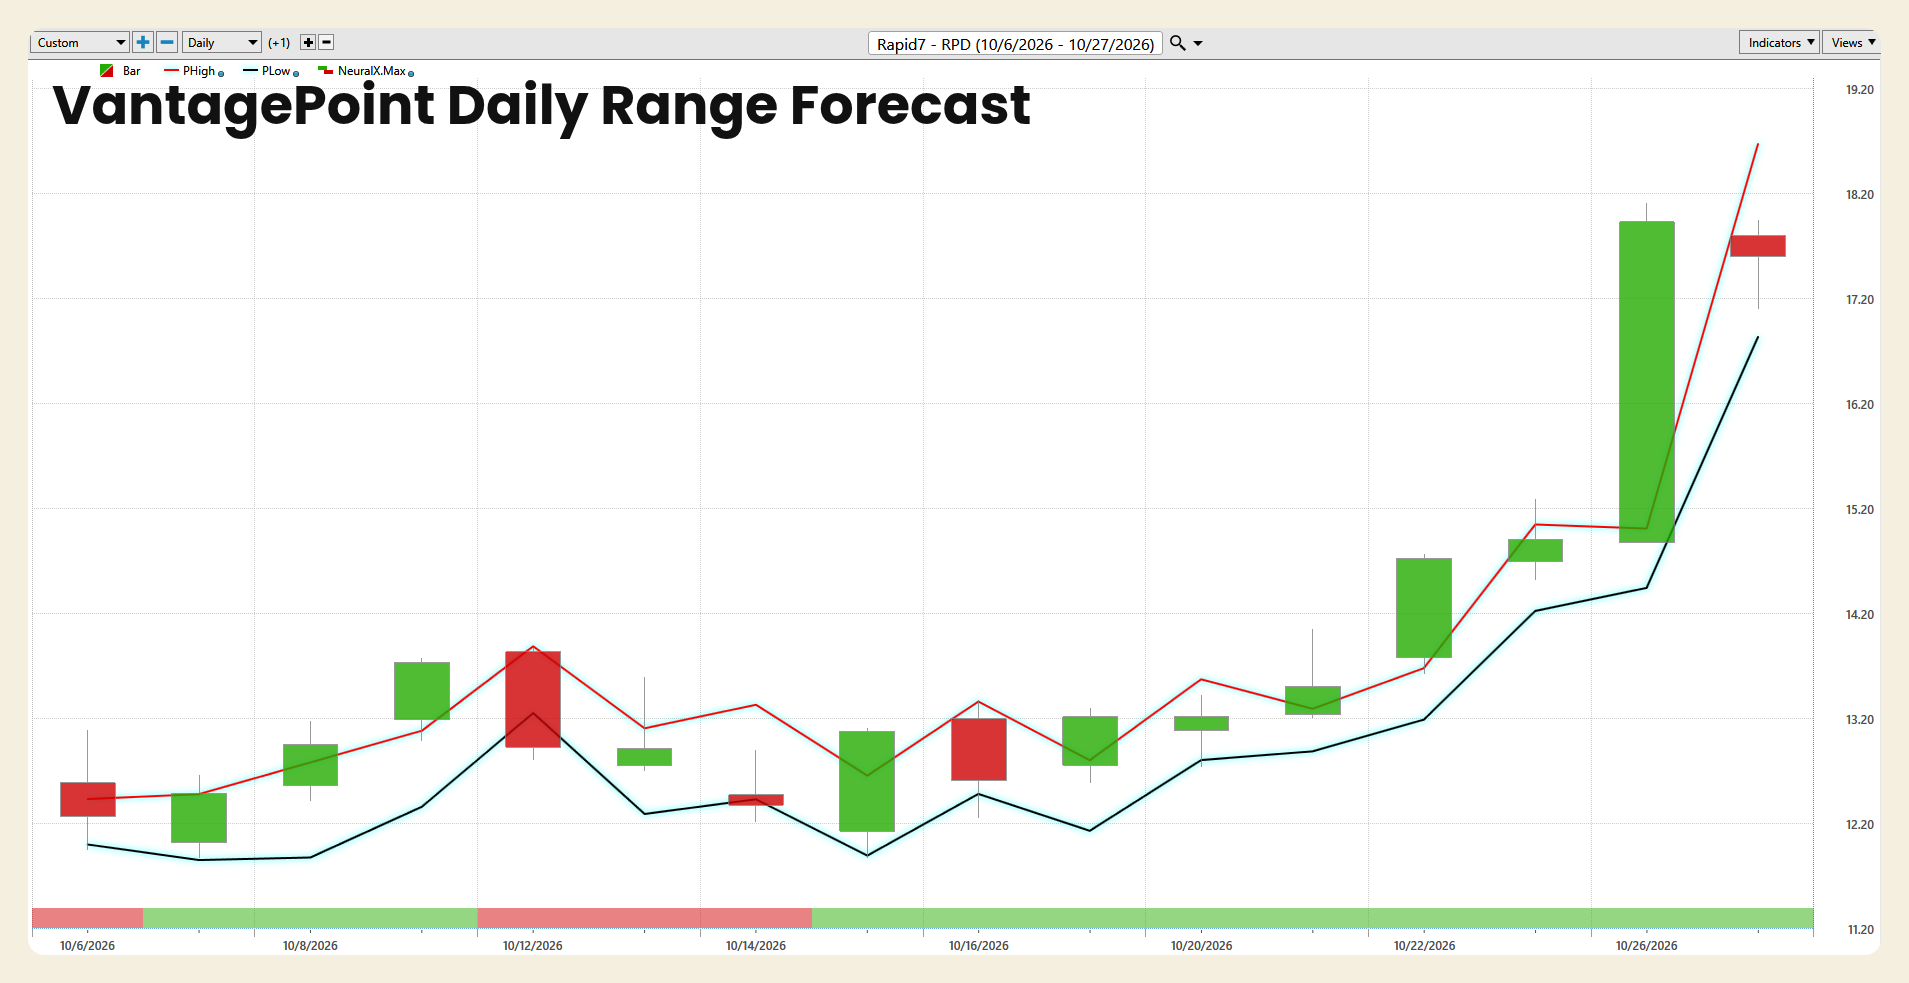
The October 26 session shows why the boundaries matter. The forecast for that day had a predicted high of approximately $15.03 and a predicted low of approximately $14.45. The stock opened at $14.88, inside the band, and then traded as high as $18.11, more than $3 above the predicted high. That was a breakout well beyond the forecast range, and it came on more than twice average volume.
For October 27, the forecast built from the October 26 data reset sharply higher, with a predicted high of approximately $18.70 and a predicted low of approximately $16.85, a projected range of about $1.85, or 10.32% of the October 26 close. That is close to twice the stock’s recent behavior. Across the past 20 sessions, the average daily range was $0.95, or 7.24% of the prior close. The forecast is expecting another very active session. The October 26 close of $17.93 sits inside the band, about $0.77 below the predicted high and about $1.08 above the predicted low, slightly above the roughly $17.78 midpoint.
The more important observation is the direction of both boundaries. The predicted high and the predicted low have been rising steeply since October 19, and the jump in both lines at the right edge of the chart is the largest in the window. When both boundaries rise together, the forecast is describing a trending market rather than a range-bound one. The projected band for October 27 sits entirely above the October 23 close of $14.91, which means the forecast is framing the next session around the new, higher price level rather than a return to last week’s range.
For a trader, the practical use is straightforward. A pullback toward the predicted low, near $16.85 for October 27, would be a test of the short-term trend rather than a break of it. A close below the predicted low, especially on a day when the Neural Index turns red, would be the first sign that the rising structure is weakening. Upper-band trading near $18.70 is the zone where short-term traders tend to tighten stops rather than chase, particularly with the 52-week high of $19.34 just above it and earnings nine days away.
Intermarket Analysis
No stock trades in isolation. VantagePoint’s Intermarket Analysis identifies the related markets whose price behavior has the greatest influence on the forecast for a given stock, and it feeds those relationships into the AI models behind the readings above.
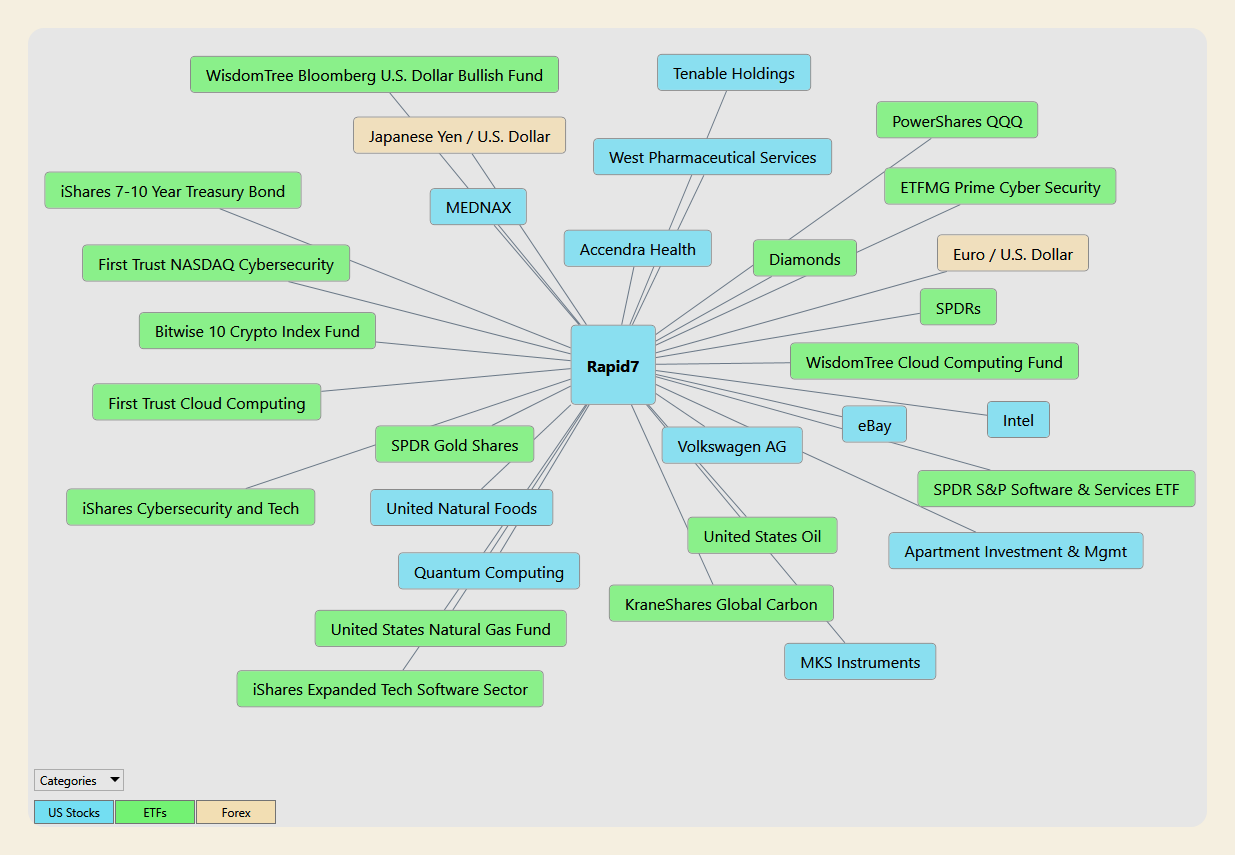
For Rapid7, the map includes 11 U.S. stocks, 17 exchange-traded funds, and 2 currency pairs. The U.S. stocks are Accendra Health, Apartment Investment & Management, eBay, Intel, MEDNAX, MKS Instruments, Quantum Computing, Tenable Holdings, United Natural Foods, Volkswagen AG, and West Pharmaceutical Services. The ETFs are the Bitwise 10 Crypto Index Fund, Diamonds, the ETFMG Prime Cyber Security fund, First Trust Cloud Computing, First Trust NASDAQ Cybersecurity, the iShares 7-10 Year Treasury Bond fund, iShares Cybersecurity and Tech, the iShares Expanded Tech Software Sector fund, KraneShares Global Carbon, PowerShares QQQ, SPDR Gold Shares, the SPDR S&P Software & Services ETF, SPDRs, the United States Natural Gas Fund, United States Oil, the WisdomTree Bloomberg U.S. Dollar Bullish Fund, and the WisdomTree Cloud Computing Fund. The currency pairs are the euro against the U.S. dollar and the Japanese yen against the U.S. dollar.
What stands out is how directly the map describes Rapid7’s own industry. Tenable Holdings, one of Rapid7’s closest competitors in vulnerability and exposure management, is the only individual security company on the map. Around it sit three cybersecurity funds, First Trust NASDAQ Cybersecurity, iShares Cybersecurity and Tech, and ETFMG Prime Cyber Security, along with two cloud computing funds, the iShares Expanded Tech Software Sector fund, and the SPDR S&P Software & Services ETF. Taken together, the model is weighing whether money is moving toward or away from security and software as a group. That fits a stock whose biggest move this month came from exactly that kind of sector rotation.
The other clusters describe the backdrop rather than the business. PowerShares QQQ, Intel, and MKS Instruments connect to the broader technology and semiconductor tape, the side of the market that money rotated away from in late October. The iShares 7-10 Year Treasury Bond fund connects to interest rates, relevant for a company with $900 million of convertible notes outstanding. The WisdomTree dollar fund, the euro, and the yen connect to currency translation for a company with international customers. SPDR Gold Shares, United States Oil, the United States Natural Gas Fund, KraneShares Global Carbon, and the Bitwise 10 Crypto Index Fund describe the commodity and risk-appetite tape. Diamonds and SPDRs capture broad equity direction.
The remaining individual names are not business peers. Accendra Health, Apartment Investment & Management, eBay, MEDNAX, Quantum Computing, United Natural Foods, Volkswagen AG, and West Pharmaceutical Services are correlation inputs. Their presence on the map does not mean a grocery distributor or a carmaker moves demand for security software. It means those markets have had a statistical relationship with RPD’s price that the model treats as useful.
The distinction matters. Intermarket Analysis does not claim that any one of these markets moves RPD on a given day. It recognizes that a mid-sized security software company in the middle of a turnaround is exposed to sector rotation, rates, the dollar, and the broader risk tape all at once, and it lets the AI weigh those influences together rather than asking a trader to track 30 charts by hand.
Our Suggestion
Rapid7 is a company where two honest stories are true at the same time. The first is a security software company whose revenue growth has fallen from 30% to below zero in five years, whose annualized recurring revenue is shrinking, whose management expects the decline to widen this quarter, which owes $600 million in March, and whose stock has already dropped 19.94% and 28.97% in single sessions on the last two disappointing reports. The second is a company producing well over $100 million of free cash flow a year on a market value of about $1.21 billion, with a new chief executive who has cut costs, raised the earnings outlook, narrowed the product focus, and set a 20% margin target, in a sector the market has just started to favor again. Most of the past year gave more weight to the first story. The past three months, and especially the past week, have given more weight to the second.
That is the trade in one sentence: RPD is a bet that the new management team can stop the decline in recurring revenue before the market loses patience, and the bet holds only if November 4 shows the top line stabilizing while the cash flow keeps coming.
The weekly chart frames the opportunity and the risk. RPD sits at the 90.19th percentile of its 52-week range, 47.51% above the $12.16 midpoint, with 7.86% of room to the $19.34 high and 72.28% of room down to the $4.97 low. The stock has recovered most of the distance from the April low, and the remaining gap to the high is small enough that the November 4 report could decide whether it is closed or abandoned.
Taken together, the VantagePoint readings are aligned on a short window. The Predictive Blue Line crossed above the black line between October 6 and 7 and has widened its lead since. The Neural Index has been green from October 15 through October 26, producing a double confirmation across that entire run, after an earlier double confirmation from October 7 through October 9. The Daily Range Forecast shows both boundaries rising, with a projected band of approximately $16.85 to $18.70 for October 27. The short-term forecasting tools are pointing in the same direction as the relative strength data. They are not a substitute for the November 4 report.
The risks are clear. Every one of the 15 published analyst targets sits below the October 26 close, the highest by 16.34%. The jump that put the stock there came from a sector rotation, not company news, and it carried the price 13.48% above the Predictive Blue Line, which means price is stretched in the short term. The October 26 session ran more than $3 past its own predicted high. The company’s guidance still calls for shrinking revenue, and the 2027 notes become convertible in December. Momentum is not safety, and a stock that can gain 20.25% in a day has shown it can lose 28.97% in a day just as quickly.
For traders, the disciplined approach is to let the VantagePoint readings define the risk rather than the headline alone. A Neural Index turning red, a flattening Predictive Blue Line, or a close below the predicted low would each be a reason to tighten risk before November 4. A close back below the October 23 close of $14.91 would hand back the entire October 26 jump, a close below the October 16 close of $12.61 would return the stock to its October range, and a close below the September 11 close of $10.31 would indicate that the character of the trend has changed. Until then, the evidence favors respecting the uptrend while keeping position size modest enough to absorb an earnings-sized move in either direction.
Historical returns and technical signals are not guarantees of future results. They are tools for framing probability and managing risk.
Practice great money management on every trade, and use the VantagePoint AI Daily Range Forecast to identify short-term trading opportunities while keeping risk firmly under control.
It’s not magic.
It’s machine learning.
Disclaimer: THERE IS A HIGH DEGREE OF RISK INVOLVED IN TRADING. IT IS NOT PRUDENT OR ADVISABLE TO MAKE TRADING DECISIONS THAT ARE BEYOND YOUR FINANCIAL MEANS OR INVOLVE TRADING CAPITAL THAT YOU ARE NOT WILLING AND CAPABLE OF LOSING.
EXAMPLES ARE SUCCESS STORIES AND ATYPICAL. PAST RESULTS DO NOT GUARANTEE FUTURE PERFORMANCE.
VANTAGEPOINT’S MARKETING CAMPAIGNS, OF ANY KIND, DO NOT CONSTITUTE TRADING ADVICE OR AN ENDORSEMENT OR RECOMMENDATION BY VANTAGEPOINT AI OR ANY ASSOCIATED AFFILIATES OF ANY TRADING METHODS, PROGRAMS, SYSTEMS OR ROUTINES. VANTAGEPOINT’S PERSONNEL ARE NOT LICENSED BROKERS OR ADVISORS AND DO NOT OFFER TRADING ADVICE.