


This week’s ai stock spotlight is Electronic Arts ($EA)
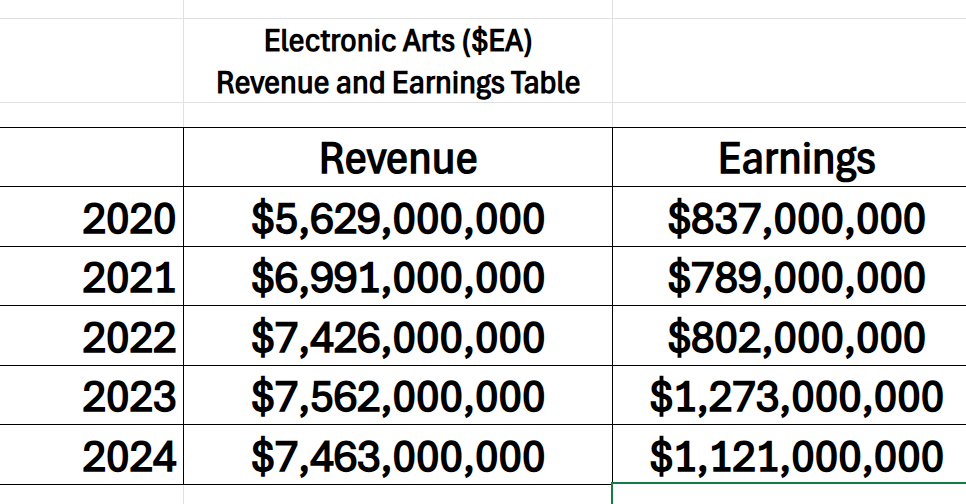
Electronic Arts ($EA) is a publicly traded powerhouse headquartered in Redwood City, California, founded in 1982 by Trip Hawkins. From its origins in the personal computing boom, EA has evolved into one of the largest global publishers of interactive entertainment. The company’s fiscal 2024 net revenue reached $7.562 billion, with net bookings of $7.430 billion — a clear signal of its financial heft. Behind these figures lies a meticulously orchestrated strategy: from blockbuster sports titles and immersive shooters to a sprawling live-services machine that delivers recurring returns. You should care because EA isn’t just a game publisher — it’s a leading indicator of how entertainment companies monetize engagement in today’s digital age.
Let’s talk moolah: EA earns its loot in three potent ways — selling full-price games (think $60–$70 at launch), wringing every cent from live services like in-game purchases and season passes, and running its subscription racket EA Play. In fiscal 2024, live services — microtransactions, DLC, subscriptions — accounted for about 74 percent of net bookings, eclipsing pure game sales. So, it’s not just one-off sales — it’s putting a siphon on your wallet well after you’ve paid for the CD or download.
Why should you watch $EA?
Because beneath the innocuous facade of video games lies a sophisticated engine of influence and spending. Ultimate Team modes in EA Sports franchises — formerly FIFA, now EA Sports FC — are responsible for a staggering chunk of revenue. For example, the latest EA Sports FC games contributed roughly 70 percent of the company’s profits. When those games stumble — as FC 25 did, triggering a 15 percent stock plunge and nearly $6 billion in lost market value, that’s not just corporate woe. That’s millions of gamers and investors feeling a ripple. It matters, and not just in boardrooms.
In the last two earnings calls, Electronic Arts has spoken with the confident cadence of a company that knows its strengths. In Q1 FY26, management proudly delivered results well above expectations — net bookings of $1.3 billion and EPS nearly double the top end of their forecast — while promising “the most exciting launch slate in EA’s history.” They acknowledged a softer near-term bookings forecast, yet held firm on their full-year outlook, clearly betting that the combined firepower of Battlefield 6, Madden 26, and EA Sports FC 26 will more than make up the difference. In the prior quarter, they again topped revenue and EPS estimates, fueled by steady engagement in their sports franchises and Apex Legends. This is the fruit of a business model that turns each launch into an annuity stream via live services, season passes, and in-game purchases.

Yet, behind the upbeat tone lies a more sobering truth. Margins have compressed — from 21.9% to 16.2% and earnings guidance for the year came in lighter than some analysts had hoped. Over the past five years, revenue has climbed 33% and earnings 34%, which means profitability has moved in lockstep with sales, without significant margin expansion. This is the hallmark of a company maintaining its edge rather than sharpening it. $EA is still monetizing engagement masterfully, but rising costs, player fatigue, and the realities of game development cycles are quietly tugging at its operating leverage.
For investors, the story is one of reliable performance with an open question about upside. $EA remains a market leader with enviable franchises and a live-service engine that delivers recurring, high-margin income year after year. But the true test now is whether the next wave of tentpole launches can ignite growth that outpaces expenses, turning that steady 33% climb into something more explosive. If management’s confidence is matched by the marketplace’s response, $EA could transition from a dependable performer to a breakout growth story once again. Until then, it deserves a place on your radar — not for what it has been, but for what it still might become.
EA’s model turns high-margin gold in live services. EA has carefully transformed games into digital ecosystems — releasing season passes, cosmetic items, and micro-DLC that extend far beyond the initial purchase. Apex Legends, for instance, thrives on its battle pass and cosmetic store. EA Sports franchises rake in hundreds of millions via Ultimate Team alone. The advantage? These recurring-revenue engines deliver far higher margins than one-off box sales and foster habitual spending. If you’re looking for companies that turn engagement into durable profits, EA belongs at the top of your watchlist.
Let’s look forward: EA recently released its fiscal 2026 outlook. Net revenue is projected between $7.1 billion and $7.5 billion, and net bookings are expected to rise to $7.6 – 8.0 billion, fueled largely by live services, strong Sports franchise performance, and new titles like Battlefield and Skate. Importantly, $EA has pledged to return at least 80 percent of free cash flow to shareholders by fiscal 2027 through buybacks and dividends — a clear signal of capital discipline and shareholder focus. Even with challenges, EA is finding ways to stay financially compelling.
$EA is basically a subscription plus microtransaction play dressed up as video games. You pay once for a title, and then — boom — they start selling you virtual soccer players, battle passes, cosmetics, early-access perks in EA Play, etc. In Q1 FY26 (reported late July 2025), EA pulled in $1.671 billion in net revenue and $1.298 billion in net bookings, beating guidance. Add share buybacks (3 million shares worth $375 million) and a $0.19 dividend, and you’ve got a company not just monetizing fans, but also feeding investors nicely. It’s an elegant funnel: collect fans, monetize them forever, return capital to shareholders — rinse, repeat.
In this stock study, we’ll analyze the key indicators and metrics that guide our decisions on whether to buy, sell, or stand aside on a particular stock. These inputs serve as both our framework and behavioral compass, rooted in data and powered by predictive intelligence.
- Wall Street Analysts Ratings and Forecasts
- 52 Week High and Low Boundaries
- Best-Case / Worst-Case Scenario Analysis
- VantagePoint A.I. Predictive Blue Line
- Neural Network Forecast (Machine Learning)
- VantagePoint A.I. Daily Range Forecast
- VantagePoint A.I. Seasonal Trend Analysis
- Intermarket Analysis
- Our Suggestion
While our decisions are ultimately anchored in artificial intelligence forecasts, we briefly review the company’s fundamentals to better understand the financial environment it operates in. For $EA this context helps us assess the quality of the A.I. signal within a broader economic and industry backdrop.
Wall Street Analysts Forecasts
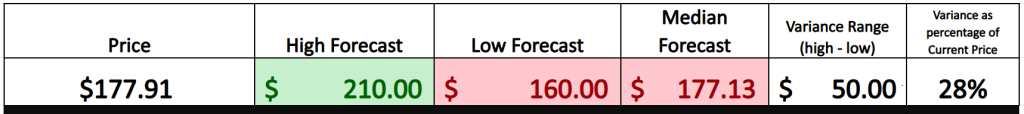
Here’s where the rubber meets the road. 18 Wall Street analysts have been peering into their crystal balls over the past three months, trying to pin down where Electronic Arts is headed over the next year. The average target? $176.71 — pretty much dead-on with where the stock sits now. But here’s where it gets interesting: the bulls are dreaming of $210.00, the bears are bracing for $160.00. That’s a $50 spread… a fat, juicy 28% variance from today’s price.
That’s not just noise, that’s volatility talking. And not the “oh no, hide under your desk” kind. We’re talking above-average volatility, the kind that makes great traders lick their chops. Why? Because once you truly grasp how volatility shapes your risk and position sizing, you stop fearing it and start using it. It’s like knowing the tide schedule before going fishing — you know when to push, when to pull back, and when to sit tight.
For the amateurs, volatility is a heart attack waiting to happen. For pros, it’s the playground where the real money’s made. If you’re aware of it, you can ride it. Manage your risk, time your entries, and suddenly that $50 range isn’t a threat — it’s a roadmap to opportunity. The only question is whether you’re playing scared… or playing smart.
52 Week High and Low Boundaries
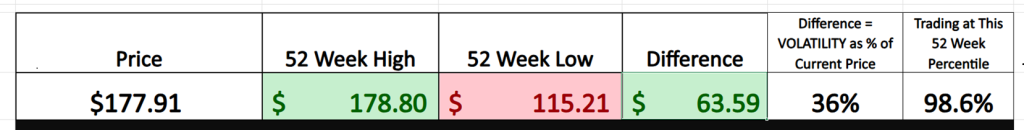
If you want to make sense of Electronic Arts, start with the boundaries: a 52-week high of $178.80 and a 52-week low of $115.21. That’s the arena. It’s where traders, fund managers, and algorithms spent the last year testing conviction and risk tolerance. Every tick between those numbers is a record of that struggle.
Now, consider the range — $63.59. Set it against today’s price of $177.91 and you get a historical volatility of about 36%. That’s not a calm glide path; it’s a market profile shaped by sharp swings, sector rotation, and macro headwinds. Securities with this level of historical volatility don’t meander — they pivot, surge, and punish complacency.
This is why experienced traders and portfolio managers keep one eye on those 52-week markers. The high represents the last peak of bullish strength; the low, the deepest drawdown of bearish control. But the real tell is what happens when a stock doesn’t just revisit the high but breaks it decisively. That’s where momentum takes hold — a trend that, if caught early, can define performance for the year. The discipline is in recognizing that these extremes aren’t noise; they’re signposts. And in markets like this, ignoring them isn’t just a missed opportunity — it’s a risk in itself.
We always advise that traders study the 52 Week chart to better understand the trajectory the stock is on.
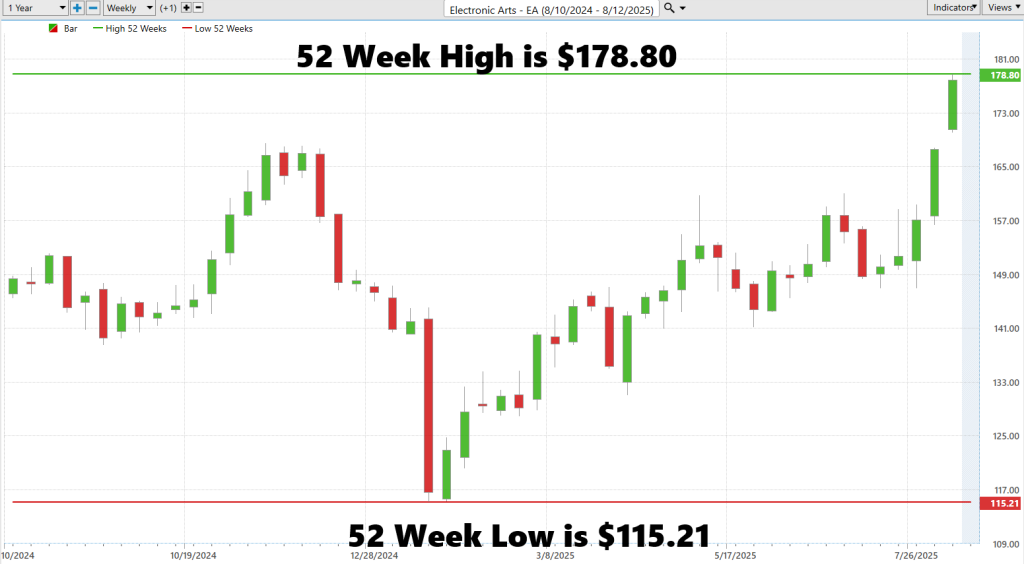
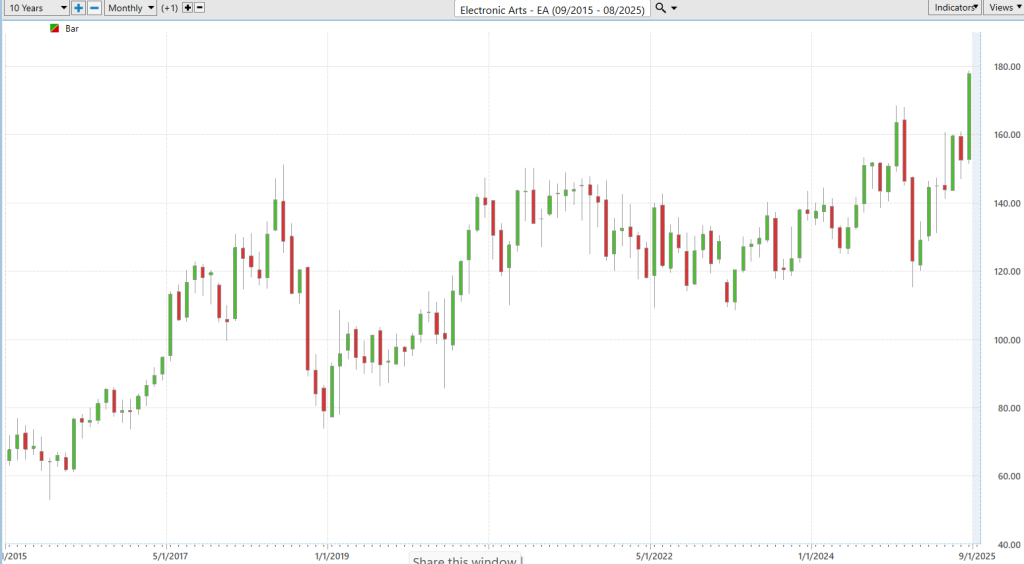
You want to know how the real killers in this game get their edge? They zoom out. Way out. Great traders don’t just squint at the daily chart like they’re looking for Waldo. They pull up the ten-year monthly chart—the whole battlefield. That’s where the noise fades, the big picture sharpens, and the truth about a stock’s strength smacks you right in the face.
Now, here’s what the sharpest eyes in the room are seeing with $EA: it’s not just printing fresh 52-week highs. It’s punching through new 10-year highs. It means every single person who’s ever bought this stock… is now sitting on a profit. No overhead supply. No sellers itching to “get back to even.” Just clean, open air above.
When a stock is making new all-time highs, that’s the signal. It’s the market’s way of putting a big neon arrow over the ticker saying, “Hey, smart money is here.” This is where momentum feeds on itself, where trends can run further than most traders ever imagine — because there’s no ceiling to stop it. The amateurs will yawn and look for something “cheaper.” The pros? They’re already moving in, managing risk, and riding the wave. Ignore that, and you’re not just missing a trade — you’re missing the kind of move that can make your year.
Best-Case/Worst-Case Scenario Analysis
Years ago, I met a great trader. We started talking about risk and reward. What he said has always stayed with me: we can only have 100% certainty when we look at the data of the past. What he meant was simple but profound — if the future behaves like the recent past, we should expect similar rallies and declines. For traders, that means knowing the magnitude of those rallies and declines isn’t optional. It’s the baseline for making informed, calculated decisions.
Volatility isn’t background noise — it’s information. In today’s markets, where speed magnifies both gains and losses, understanding what volatility signals is foundational for any trader. It shapes position sizing, conviction, and portfolio construction.
High-volatility assets demand precision. The opportunity can be compelling, but the risk of being wrong is exponentially higher. In a mega-cap, a 10% move is a headline. In a high-beta stock, it’s routine. Misjudging that scale exposes you to risks no model can fully hedge.
That’s why the 52-week range — the absolute high and low over the past year — is essential. It doesn’t predict the future, but it quantifies the market’s emotional bandwidth: fear, euphoria, capitulation, accumulation. When the fundamentals remain strong, that range becomes a strategic lens, framing both current risk and potential reward.
Before committing capital, map the biggest uninterrupted moves on the weekly chart. Magnitude matters. In markets where sentiment can swing on a single headline, knowing how far something can stretch — and how quickly it can snap back — is the difference between trading with intention and trading on hope.
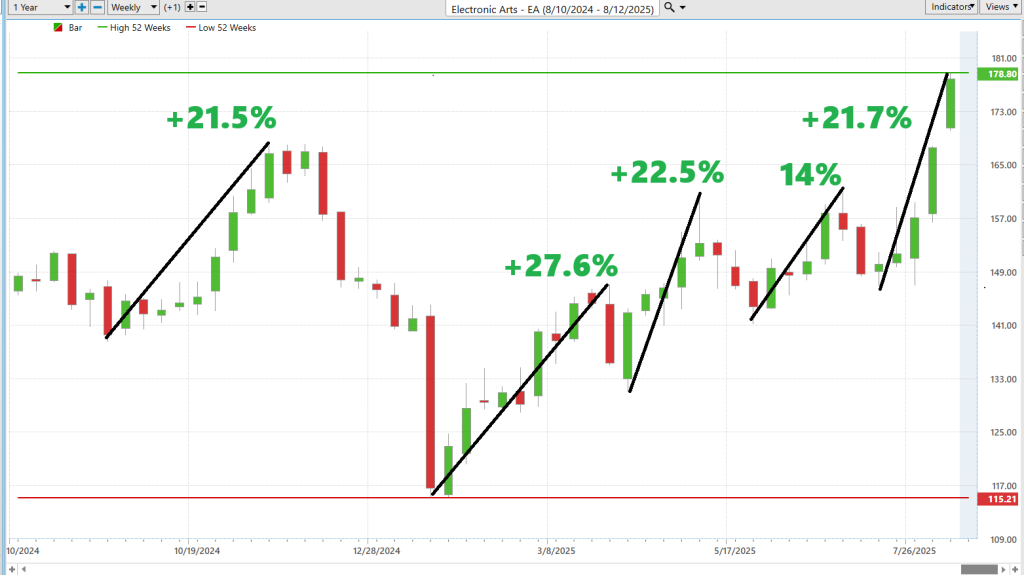
We start by measuring the largest uninterrupted rallies.
Followed by measuring the largest uninterrupted declines.
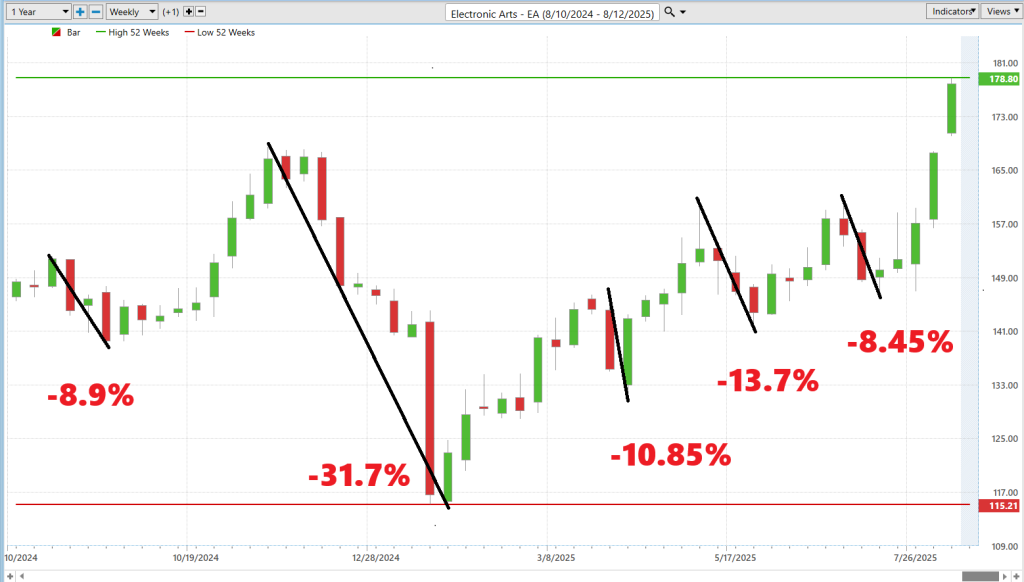
Over the past year, Electronic Arts has delivered some remarkable uninterrupted rallies — up 21.5%, 27.6%, 22.5%, 14%, and 21.7% — that underscore just how decisively the bulls have controlled the tape. But the same charts also reveal sharp declines of 8.9%, 31.7%, 10.85%, 13.7%, and 8.45%, a reminder that in markets, gravity works both ways. The opportunity here is clear: momentum traders have a history of capturing double-digit upside runs. Yet the potential downside is equally real, and those same sharp reversals warn that discipline and risk management are not optional. For now, the bulls hold the advantage, but the charts make it plain — ignore the downside at your peril.
Next, we compare $EA to all of the stock market averages to see and compare performance and volatility across multiple times frames.
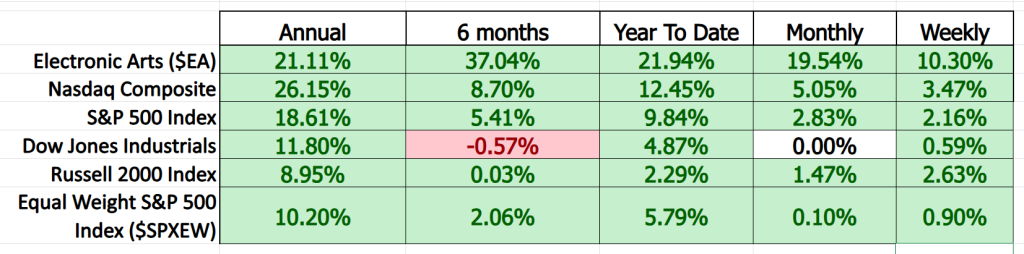
The past year’s performance shows $EA outpacing every major index over multiple time frames, with especially dominant gains over the last six months (+37.04%) and one month (+19.54%), reinforcing the bullish control seen in the rally/decline charts. This strength highlights both the magnitude of opportunity for trend traders and the need to respect the sharp reversals that have historically followed such powerful advances.
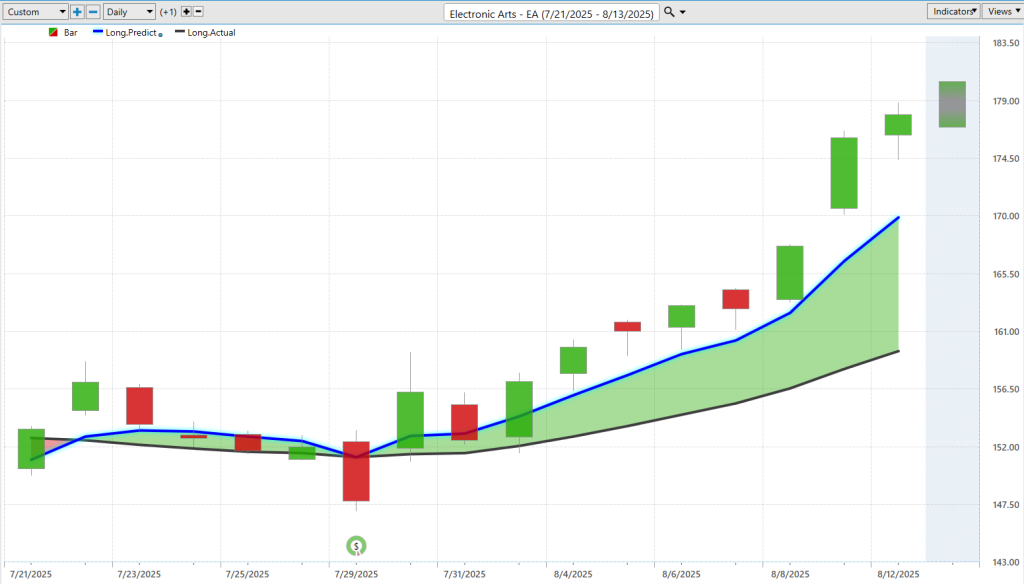
Vantagepoint A.I. Predictive Blue Line
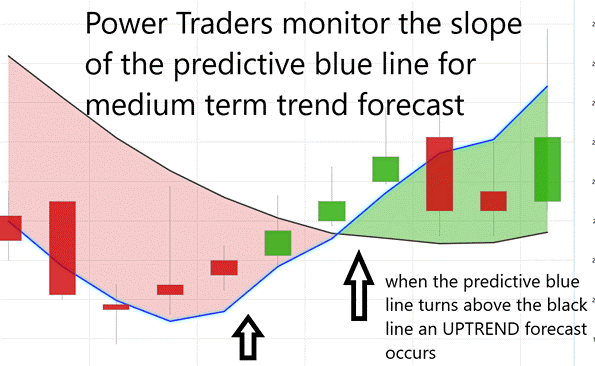
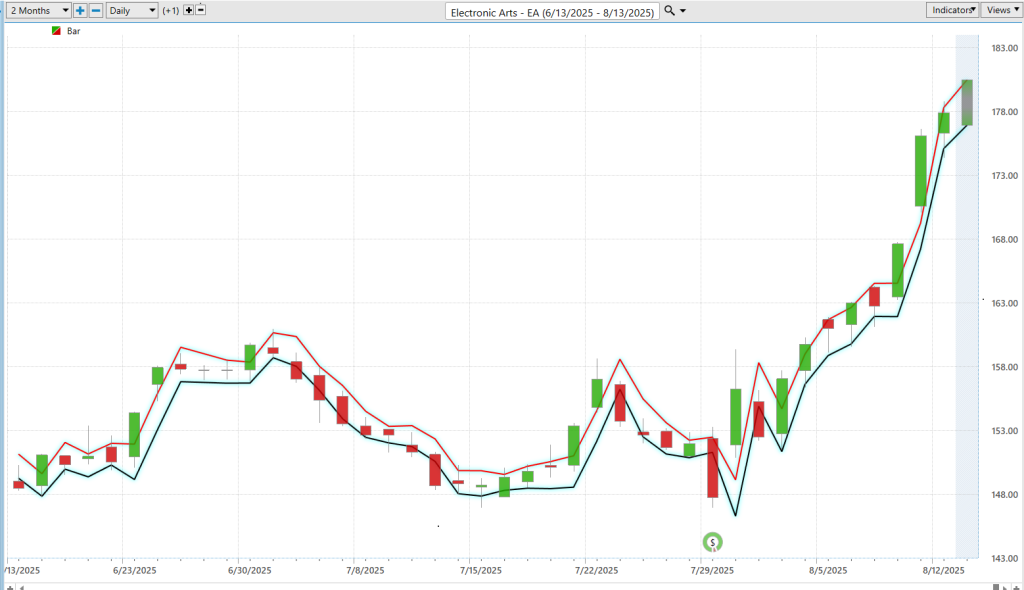
Look at the chart of Electronic Arts ($EA) and you’ll see what a proactive edge can look like. The VantagePoint A.I. Predictive Blue Line has a track record of tilting higher before price acceleration and flattening or rolling over ahead of pullbacks. This isn’t a lagging indicator — it’s a forward-looking signal designed to identify momentum shifts in their early stages. When the Blue Line starts to lift, it’s often the first subtle indication that institutional money is building positions; when it curves lower, it’s the advance notice to scale back, tighten stops, or step aside before a routine dip turns into a more meaningful drawdown.
The shaded band between the Predictive (blue) and Actual (black) lines marks the Value Zone. Equally important, if $EA trades above the Blue Line while the line itself is sloping down, that’s often a classic bull trap — an opportunity to fade the rally or lock in profits before momentum runs out.
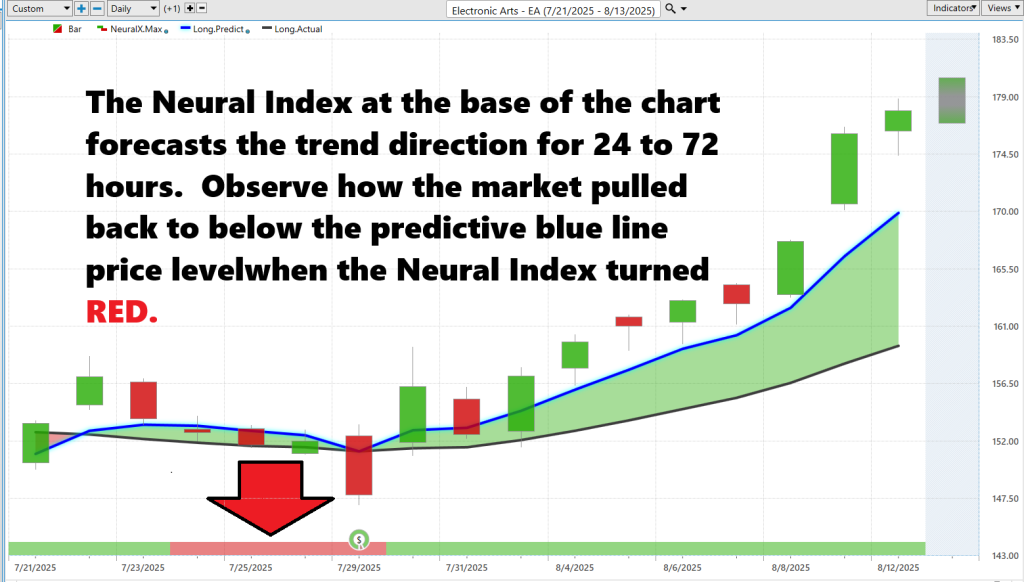
Neural Network Forecast (Machine Learning)
In a marketplace increasingly shaped by data streams, algorithmic trading, and the rapid rise of artificial intelligence, traders are navigating a fundamental shift. The era of relying purely on instinct or hand-drawn charts is giving way to a more advanced standard: neural networks — adaptive systems built to detect patterns buried deep within market noise. These models don’t just process information; they evolve, offering a forward-looking perspective on price action that often surfaces before the broader market recognizes it.
At their core, neural networks mirror the architecture of the human brain — but with speed, precision, and endurance that no human can match. Layer by layer, they process massive amounts of historical market data, from price and volume to macroeconomic inputs and intermarket correlations. Over time, they learn, refining their ability to anticipate market behavior. The result is a machine-learning framework capable of flagging momentum shifts, potential reversals, and emerging inefficiencies well before they become visible on traditional charts.
For active traders, the value proposition is clear: neural networks remove the emotional bias that often clouds judgment, distilling millions of data points into a forecast grounded in statistical history. Instead of reacting to what’s already happened, traders can position for what’s likely to occur — stepping into trades with greater conviction and fewer surprises. And when you combine the Predictive Blue Line’s forward-looking price map with the Neural Index’s read on short-term momentum and order flow, you get a high-probability setup engine. When both indicators align, it’s a clear signal in a market where speed and timing can make the difference between leading the move or chasing it. This is the kind of edge that allows professionals to act early, stay with the trend, and exit before the rest of the market catches on.
VantagePoint A.I. Daily Range Forecast
In today’s lightning-fast, always-on market, the game has changed. If you’re not using algorithmic systems that can crunch massive amounts of data in real time, you’re already playing from behind. The days of waiting for the market to tell you what’s happening are gone — now it’s about anticipating the move, seeing it before the crowd, and acting with confidence. That’s the new reality: where the precision of advanced A.I. meets the endless opportunities of the market.
When you marry cutting-edge A.I. with the steady hand of real market experience, you get a formula that works — a strategy built on hard data, not hope. It’s focused. It’s disciplined. It’s grounded in fact. And in a market where volatility never takes a day off, that’s how you turn what most see as risk into a steady stream of opportunity. This is how smart money wins — by being ready before the bell even rings.
Here are the average trading ranges in $EA for the daily, weekly and monthly time frames over the past year.
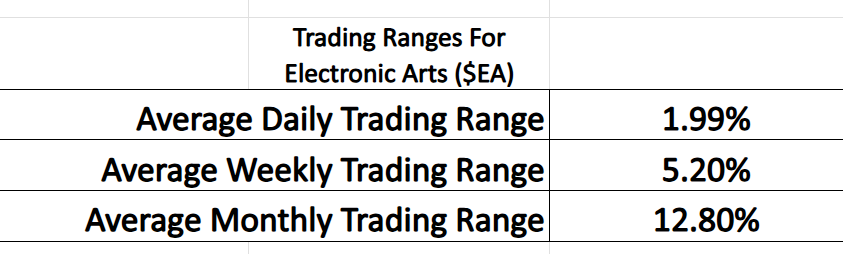
The numbers don’t just talk — they shout. On average, this stock swings 1.99% a day, 5.20% a week, and 12.80% a month. That’s not background noise — that’s a rhythm of tradable volatility that the pros live for. For traders with the right tools, those numbers are a road map, not a random walk. Every one of those swings is a potential payday if you’re positioned before the crowd blinks.
Here’s the bottom line: $EA has the kind of price action smart traders drool over — sharp, energetic moves that can turn into real money fast. And here’s the dirty little secret: price movement is opportunity, pure and simple. Big ranges mean big potential — but only if you’re already strapped in before the herd starts chasing. Most traders? They’re running behind the trade, staring at taillights. The smart ones? They’re steering the wheel. That’s where VantagePoint’s A.I. gives you the edge — a forward-looking daily range forecast that lets you act with precision while the rest are still guessing.
Neural networks don’t just analyze yesterday’s moves — they crunch oceans of data to give you tomorrow’s playbook. You get the ranges in advance. You know when to step on the gas, when to ease off, and when to slam the brakes before the rest of the market even knows there’s a turn ahead.
Look at how effectively VantagePoint’s artificial intelligence navigates the volatility.
VantagePoint A.I. Seasonal Analysis
Seasonal analysis is like having the cheat codes for market timing — it’s not a crystal ball, but it’s close when you know how to use it. You’re looking for patterns that repeat year after year, built on the hard evidence of history, not gut feelings. The chart here? It’s screaming opportunity. $EA has been marching higher since mid-January, up more than 11% into late July, and historically, that strength doesn’t just fizzle. The data says this bullish run has legs right into mid-October 2025. For a trader, that’s not just “interesting” — that’s a potential road map.
Seasonal analysis is the study of recurring price patterns tied to specific times of the year — patterns shaped by earnings cycles, product launches, holiday spending, or even institutional portfolio adjustments. It’s about identifying statistical tendencies that can provide a framework for positioning ahead of time. In $EA’s case, the seasonal chart shows a pronounced upward bias beginning in mid-January and sustaining through late July, historically gaining over 11%. The green histogram below the price action suggests that, seasonally, the trend should remain favorable through mid-October 2025. For investors, it’s a data-driven signal to weigh timing and probability alongside fundamental conviction.
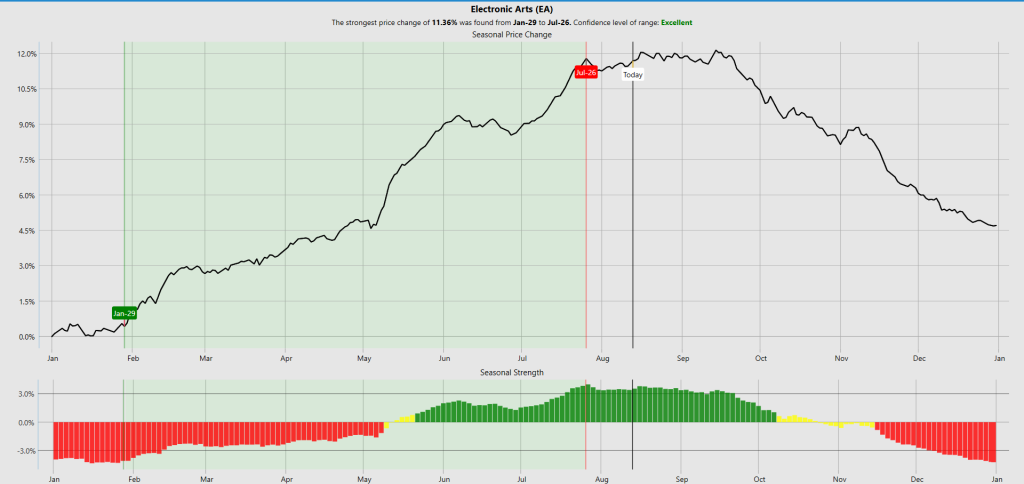
Seasonal analysis is one of those underappreciated tools that can separate the pros from the pack — it’s about recognizing that the market, like the weather, has seasons. You see certain stocks heat up at the same time every year, and if you know when that window opens, you can ride the wave instead of chasing it. For $EA, history says it starts climbing in mid-January, powers higher into late July, and often keeps that momentum rolling into mid-October. That’s exactly what we’re seeing here, and if history rhymes again, this could be one of those stretches where the stock rewards traders who get in early and stay disciplined until the seasonal tailwind fades.
Intermarket Analysis
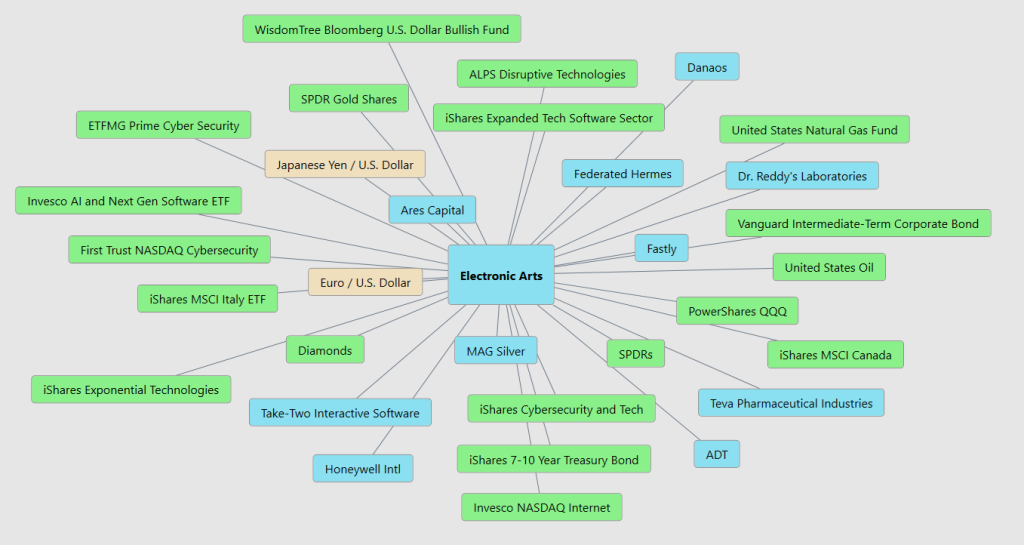
Think of the stock market like a big neighborhood with lots of different playgrounds. There’s the tech playground, the oil playground, the gold playground, the currency playground — and even the bond playground. What happens in one playground can make the kids in another playground act differently. If the gold playground gets super popular, maybe fewer kids play in the oil playground. Or if the U.S. dollar playground gets really exciting, kids from other playgrounds might come join in, and that changes the mood everywhere else. Intermarket analysis is just watching all the playgrounds at once, seeing how they affect each other, and spotting patterns before most kids notice.
$EA makes money by selling video games and keeping players engaged through in-game purchases and subscriptions. So the big drivers are:
- Consumer spending trends — when people have extra money, they buy more games and digital extras.
- Technology adoption — faster internet, better consoles, and more powerful devices mean more people can play, more often.
- Gaming industry growth — popularity of esports, streaming, and social gaming fuels demand.
- Exchange rates — EA sells globally, so moves in currencies like the Euro, Yen, or Dollar affect profits.
- Capital flows into tech — money moving in or out of tech ETFs and software funds impacts EA’s stock demand.
- Interest rates and macro sentiment — if rates rise and borrowing gets expensive, growth stocks like EA can feel pressure.
Macro trends impacting EA the most:
- Shift to digital — more players are downloading instead of buying physical discs, boosting margins.
- Live services model — recurring revenue from in-game content is growing faster than one-time game sales.
- Globalization of gaming — EA’s reach expands as gaming becomes more popular in emerging markets.
- AI and data analytics in gaming — personalization of game experiences keeps players hooked.
- Currency volatility — big swings in the Dollar vs. other major currencies directly influence international earnings.
From the 30,000-foot view, EA’s price is being driven by tech sector sentiment, gaming industry momentum, global economic health, consumer demand for entertainment, and capital flows across currencies and commodities. Great traders anticipate the shifts, position early, and ride the big moves while everyone else is still looking at yesterday’s tide charts.
Our Suggestion
Electronic Arts is about to drop EA SPORTS NHL 26, and it’s not just another hockey game, it’s a whole new level of authenticity. For the first time, they’ve plugged in official NHL EDGE tracking data through their ICE-Q 2.0 system, so every stride, pass, and shot is built on real-world player performance. On the deluxe edition cover? Stanley Cup champ Matthew Tkachuk alongside his brother Brady and their legendary dad, Keith — a built-in storyline that hockey fans can’t resist. Launching September 12, 2025, with a fully reimagined “Be A Pro” mode, this is EA’s most convincing invitation yet to stop watching hockey and start living it.
Electronic Arts shepherds powerhouse brands across nearly every gaming genre, from the world-renowned EA SPORTS titles (FIFA/EA SPORTS FC, Madden, NHL, F1) and blockbuster action-adventures like Battlefield, The Sims, Apex Legends, Need for Speed, Dragon Age, Star Wars RPGs, to in-house studios like BioWare, DICE, Respawn, and Criterion. These franchises and studios form the bedrock of EA’s strategy — each release is a potential high-margin blockbuster or recurrent revenue machine, providing diversification beyond its flagship EA SPORTS franchise.
Looking into Q4, analysts expect $EA to deliver strong net bookings and revenue, fueled by year-end holiday demand for EA SPORTS, Sims, and early momentum from Battlefield’s upcoming launch. They project net revenue between $1.55B and $1.65B, with the broader fiscal year bookings forecast to hit $7.6B – $8.0B — supported by continued live services growth despite softness in catalog and Apex Legends.
Place $EA on your watchlist.
Use the VantagePoint A.I. Daily Range Forecast to find opportunities.
Practice great money management on all your trades.
It’s not magic.
It’s machine learning.
Disclaimer: THERE IS A HIGH DEGREE OF RISK INVOLVED IN TRADING. IT IS NOT PRUDENT OR ADVISABLE TO MAKE TRADING DECISIONS THAT ARE BEYOND YOUR FINANCIAL MEANS OR INVOLVE TRADING CAPITAL THAT YOU ARE NOT WILLING AND CAPABLE OF LOSING.
VANTAGEPOINT’S MARKETING CAMPAIGNS, OF ANY KIND, DO NOT CONSTITUTE TRADING ADVICE OR AN ENDORSEMENT OR RECOMMENDATION BY VANTAGEPOINT AI OR ANY ASSOCIATED AFFILIATES OF ANY TRADING METHODS, PROGRAMS, SYSTEMS OR ROUTINES. VANTAGEPOINT’S PERSONNEL ARE NOT LICENSED BROKERS OR ADVISORS AND DO NOT OFFER TRADING ADVICE.


