| This week’s stock analysis is Ford Motor Company ($F) |
Ford Motor Company, commonly known as Ford, is one of the most iconic names in the global automotive industry. Established over a century ago, this American automaker has played a pivotal role in shaping the way people move around the world. Today, it stands as a symbol of innovation, durability, and mass production prowess. Ford Motor Company was founded on June 16, 1903, in Dearborn, Michigan, USA, by none other than the visionary industrialist Henry Ford. It was his introduction of the assembly line production method in the early 20th century that revolutionized the automobile industry by making cars more affordable and accessible to the masses.
Ford’s global headquarters remains in Dearborn, Michigan, a strategic location near Detroit’s “Motor City,” which has long been the heart of the American automotive industry.
Ford generates revenue through various channels, primarily from the sale of automobiles and related services. These include:
1. **Vehicle Sales:** The bulk of their revenue comes from selling a wide range of vehicles, including cars, trucks, and SUVs, to consumers and businesses.
2. **Financing Services:** Ford Credit, a subsidiary, provides financing solutions to customers and dealerships, contributing significantly to their revenue stream.
3. **Aftermarket Parts and Services:** Sales of replacement parts, accessories, and maintenance services also add to their revenue.
Ford operates in a highly competitive industry, facing strong rivalry from both domestic and international players. Key competitors include General Motors ($GM), Toyota Motor Corporation ($TM), Volkswagen Group ($VWAGY), and Honda Motor Co., Ltd. ($HMC), among others.
From the start of the year until mid-July, Ford shares rocketed an eye-popping 31%, giving investors a taste of the Blue Oval’s potential. But as fate would have it, the stock then took a steep nosedive, plunging 17% in just the last couple of months. Now, pessimism has cast a long shadow over the company, turning it into quite an unpredictable dance, one that even seasoned traders might find unsettling. And all of this is happening while Ford has been flexing some impressive financial muscles.
First and foremost, let’s talk about momentum. Ford’s financial performance in 2023 has been nothing short of stellar. In the first quarter, they hauled in a jaw-dropping $41.5 billion in revenue, marking an impressive 20% year-over-year increase. Remember that painful $0.78 loss in the same period last year? Well, it’s ancient history now, as they’ve turned it around with a per-share profit of $0.44 this time around. And the second quarter? Well, that was even better, with sales soaring 12%, and diluted EPS nearly tripling from the same quarter in 2022.
But what’s truly remarkable is that Ford managed to beat Wall Street’s estimates not once, but twice in the past two quarters, all while higher interest rates threatened to throw a wrench in the works. You see, higher rates often make buying new cars less attractive, but Ford defied the odds and posted some impressive numbers.
Their management is practically bubbling with optimism, raising their full-year guidance to adjusted operating income between $11 billion and $12 billion, with adjusted free cash flow ranging from $6.5 billion to $7 billion. What’s fueling this optimism, you ask? Well, it’s the strong demand and pricing dynamics that are behind this upgraded outlook.
Now, here’s the twist in the tale – the United Auto Workers strike! Workers from all three major domestic automakers walked off the job at midnight on September 14th. While it primarily impacts one of Ford’s Michigan factories, it’s vital to keep a close eye on this situation. A protracted strike will spell trouble for production capacity, potentially leading to higher prices and scarcity at dealerships.
But hold onto your hats, folks, because Ford is making a bold move towards an electric future with their Ford Model e electric vehicle (EV) segment. They’re forecasting a $4.5 billion operating loss this year, a significant leap from $3 billion in 2022, despite the division’s revenue soaring by a stunning 39% in the last quarter alone.
You might wonder why, and here’s the scoop: Ford’s playing the long game here, investing heavily in manufacturing capabilities, with the hope that scale will eventually translate into consistent profits. They’re setting their sights on producing a whopping 600,000 EVs by 2024.
But let’s not kid ourselves, the EV arena is fiercely competitive. When or if Ford “Model e” will turn a profit remains the million-dollar question. It’s a tough nut to crack, but Ford’s loyal fanbase, built over decades, might just give them an edge.
Yet, there’s another side to the coin, and it’s not all sunshine and rainbows. Despite the impressive financials and dreams of an EV utopia, Ford’s growth prospects aren’t exactly setting the world on fire. This company’s got a cyclical heartbeat, folks. If you want to hop on this roller coaster, you better have a crystal ball for economic cycles, because timing is everything.
From a financial standpoint, it’s also a tad disheartening to see just how much capital Ford needs, not just to keep the wheels turning but to invest in what, let’s be frank, are less-than-stellar growth prospects. Stubbornly low margins, relentless competition, and ongoing labor disputes are enough to keep anyone awake at night.
So, in the grand scheme of things, it’s a complex waltz for investors. The allure of soaring financials and EV dreams is undeniable, but don’t turn a blind eye to those gathering storm clouds. Ford, my friends, is like life itself – full of potential, but not without its fair share of challenges.
In this weekly stock study, we will look at and analyze the following indicators and metrics as are our guidelines which dictate our behavior in deciding whether to buy, sell, or stand aside on a particular stock.
- Wall Street Analysts’ Estimates
- 52-week high and low boundaries
- Best Case – Worst Case Analysis
- Vantagepoint A.I. Forecast (Predictive Blue Line)
- Neural Network Forecast
- Daily Range Forecast
- Intermarket Analysis
- Our trading suggestion
We don’t base our decisions on things like earnings or fundamental cash flow valuations. However, we do look at them to better understand the financial landscape that a company is operating under.
Analysts Ratings
Based on 16 Wall Street analysts offering 12-month price targets for Ford Motor in the last 3 months. The average price target is $15.53 with a high forecast of $23.00 and a low forecast of $11.00. The average price target represents a 23.65% change from the last price of $12.56.
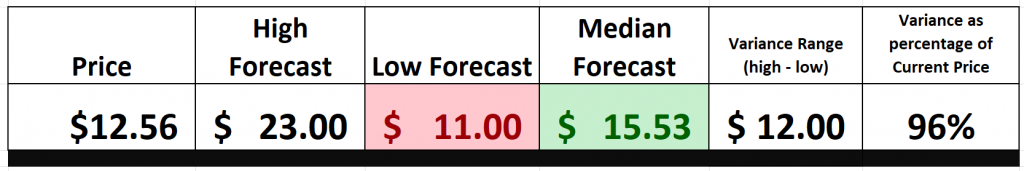
The strong variances in Wall Street Analysts forecasts are.
evidenced by the huge differences between the high and low forecasts which is then compared to the current price. This is ideal for seasoned traders who look for short-term swing trading opportunities based upon the volatility. However, it is heart-stopping to investors who are looking to commit for the long term.
52-Week High Chart
The 52-week high and low boundaries of a stock are critical metrics for traders and investors. These values represent the highest and lowest prices a stock has reached over the past year, and they carry several important implications for market participants. The values are often compared to the sector of the market that the stock belongs to, the broader market and the stocks own individual history.
– *52-Week High:* Achieving a new 52-week high is often seen as a bullish signal. It indicates that the stock is currently trading at its highest level in a year, which can attract attention from both traders and investors.
– *52-Week Low:* Conversely, reaching a new 52-week low is viewed as a bearish signal. It suggests that the stock is currently trading at its lowest level in a year, which can trigger concerns among market participants.
– *52-Week High:* When a stock reaches a new 52-week high, it can indicate that there is strong positive momentum behind the stock. Traders often look for such stocks to join the trend and capitalize on potential further price appreciation.
– *52-Week Low:* Stocks making new 52-week lows may be in a downtrend, and traders may consider shorting or avoiding them, expecting further price declines.
– *52-Week High:* The previous 52-week high can act as a resistance level. If the stock breaks above this level, it may indicate a breakout and the potential for further gains.
– *52-Week Low:* The previous 52-week low can serve as a support level. If the stock breaks below this level, it may signal a breakdown and the potential for further losses.
If a stock is making new 52-week highs while the broader market is trending downward, it can be a sign of relative strength. It suggests that the stock may have unique factors or positive news driving its performance, which can make it an attractive investment even when the broader market is weak. If a stock is making new 52-week lows while the broader market is making new 52-week highs, it can be a concerning sign. This divergence suggests that the stock may have fundamental problems or negative news affecting its performance, making it less appealing in a bullish market.
Traders often use the 52-week range to gauge a stock’s historical volatility. Stocks with a wide range between the 52-week high and low are considered more volatile, which may be attractive to traders seeking opportunities but riskier for long-term investors.
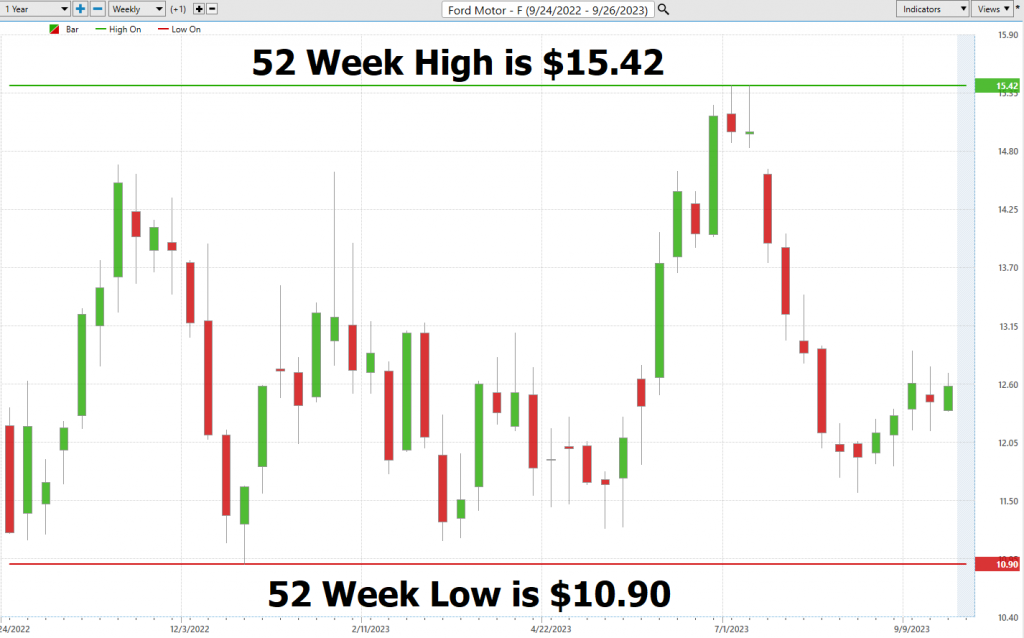
Over the past 52 week ($F) has traded as high as 15.42. Over the last 52 weeks ($F) has traded as low as $10.9. Its annual trading range has been $4.52. When we divide the annual trading range into the current price, we can see that the historical volatility is 36.4%. This value simply tells us that if the future unfolds like the recent past that it would be perfectly normal to expect $F to trade in a trading range that is potentially 36.4% higher and or lower than its current price.
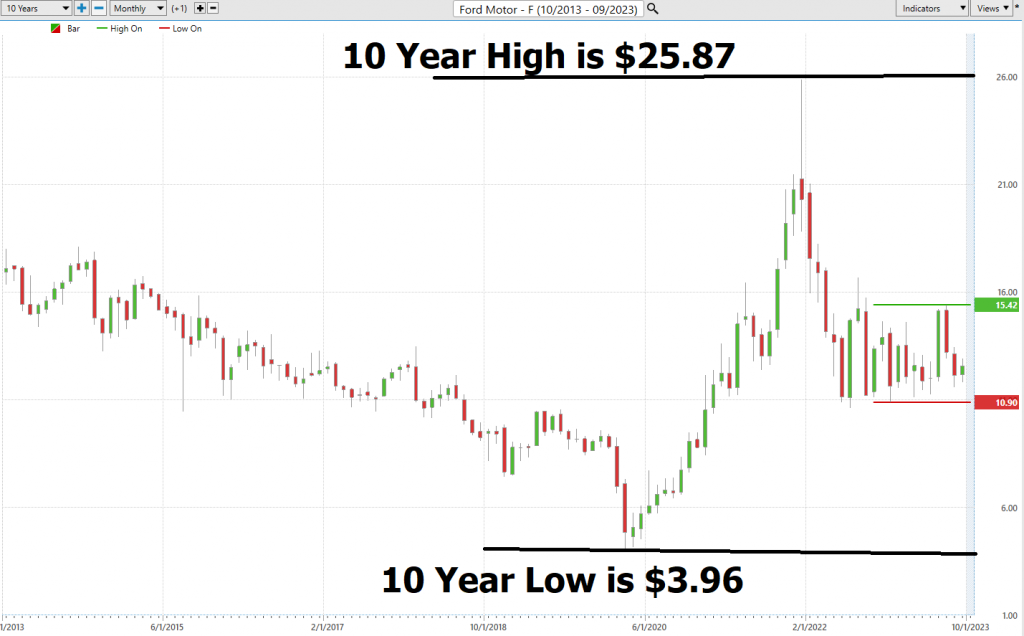
Here are the charts for $F over the past 52 weeks as well as the last 10 years. $F is trading at the 34th percentile of its last 52 weeks.
In summary, the 52-week high and low boundaries of a stock are valuable tools for traders and investors. They provide insights into a stock’s momentum, potential support and resistance levels, and its relative performance compared to the broader market. When interpreting these metrics, it’s essential to consider the broader market context and other factors influencing the stock’s price movements.
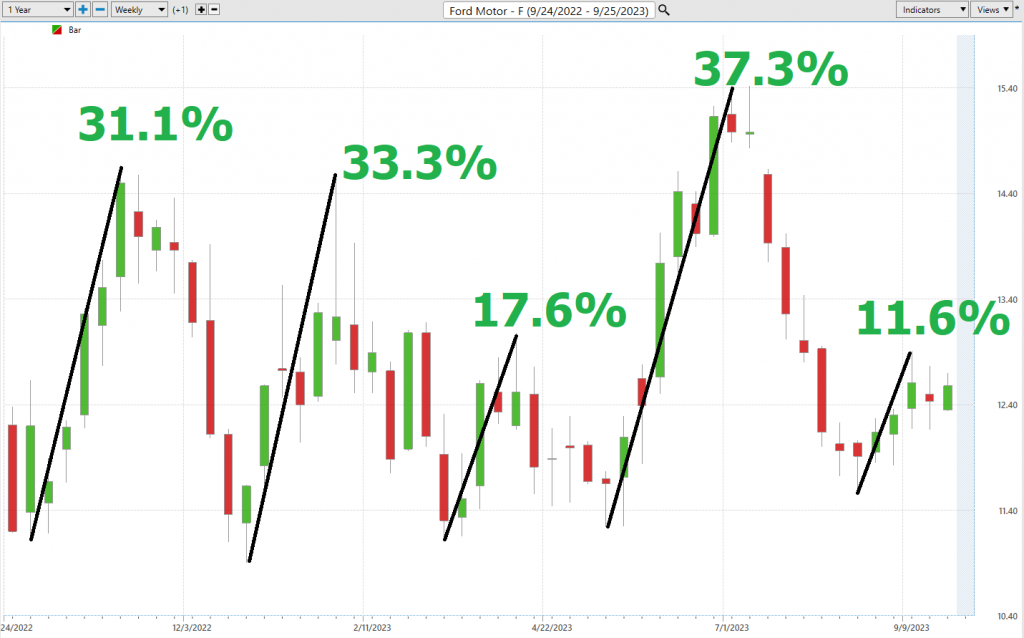
Best Case – Worst Case Analysis
Turning our attention to the analysis of best-case and worst-case scenarios, this approach offers a valuable lens through which we can assess the amplitude of price rallies vis-à-vis the depths of declines, providing a pragmatic perspective on the risk and volatility dynamics inherent in trading Ford Motor Company ($F).
Illustrated below, the graphic encapsulates this roller-coaster journey.
Here is the best-case analysis:
Followed by the worst-case analysis.
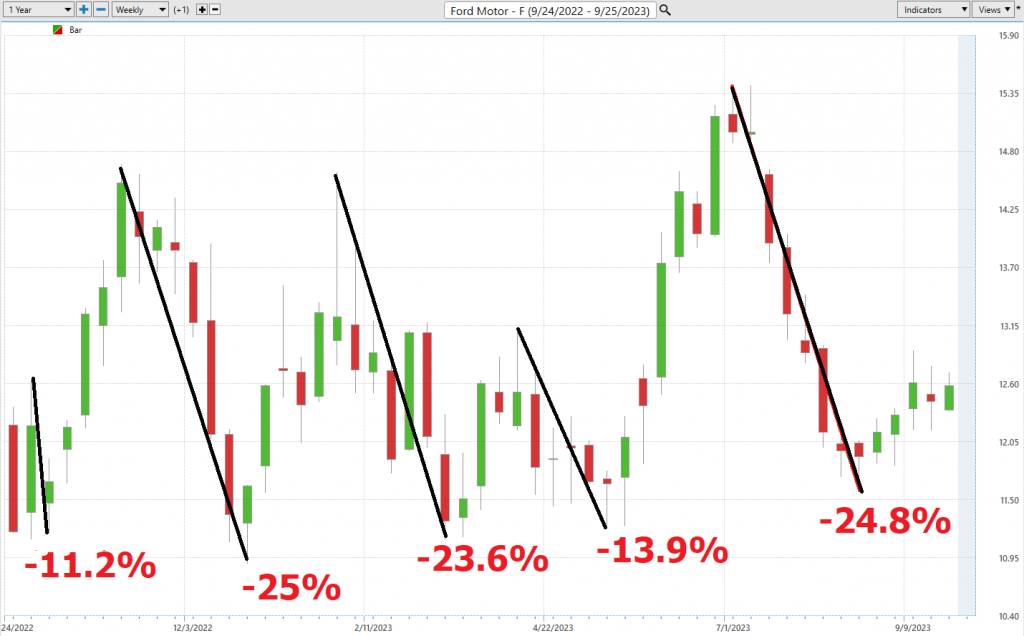
Regardless how I look at this analysis it appears that $F is in a very broad consolidation over the past year with slightly more upside than downside, but large volatility regardless.
Next, we want to evaluate $F is in comparison to the performance of the major stock market indexes which we have greater familiarity with and then look at the drawdowns of the stock over the past year to get a worst-case scenario idea for any conclusions that we might reach when we trade this asset.
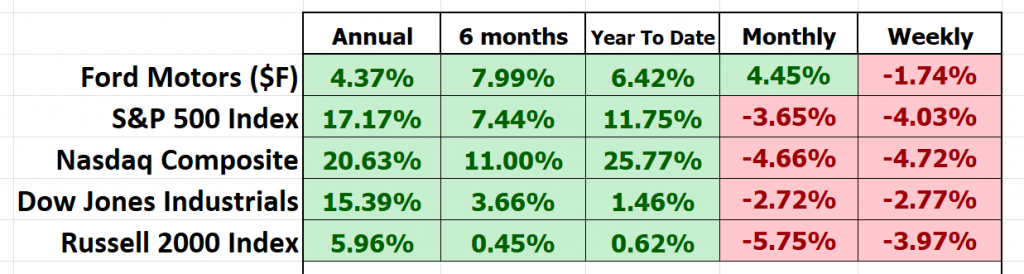
From this simple analysis we can see that $F has done better over the short term but has underperformed over the longer-term time frames.
Let’s shift our focus to Ford ($F) and assess its volatility and performance in the context of its standing among the market heavyweights. What we’re delving into here is a metric known to traders as “beta.” Think of beta (β) as akin to the Richter scale in the world of stocks; it serves as a gauge of how much a stock trembles and oscillates in comparison to the broader market, often benchmarked against a major index like the S&P 500. In simpler terms, beta offers insights into how responsive a stock is to the market’s ebbs and flows.
Let me explain:
– When Beta = 1: In this scenario, the stock’s price moves in lockstep with the market. So, if the market registers a 5% upswing, a stock with a beta of 1 should also experience a 5% increase.
– When Beta > 1: This indicates a stock akin to a rollercoaster ride. A beta exceeding 1, say 1.5, signals that the stock tends to be 50% more volatile than the market. Should the market witness a 5% ascent, this stock might surge by 7.5% (or decline similarly).
– When Beta < 1: Here’s where things take a more tranquil turn. A beta below 1, such as 0.5, implies that the stock is about half as volatile as the overall market. Should the market exhibit a 5% uptick, this stock might only realize a 2.5% increase.
In essence, beta provides investors/traders with valuable insights into how Ford’s performance aligns with broader market movements and the degree of turbulence or stability that the stock typically exhibits.
The beta for Ford ($F) is 1.17. this means that based upon its performance $F is expected to be 17% more volatile than the broader market.
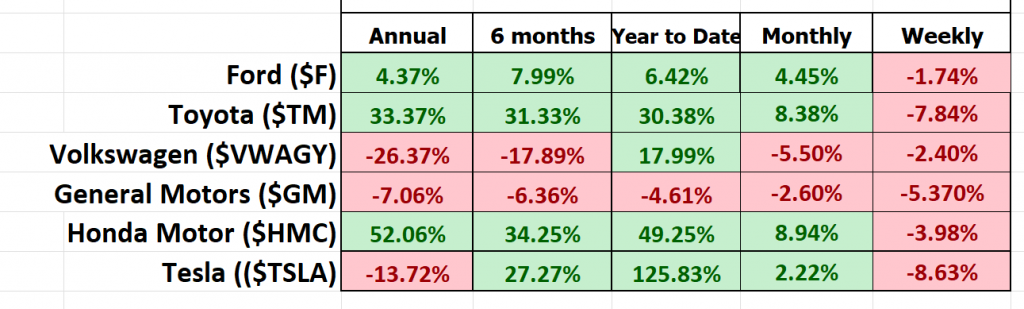
Lastly, let’s look at Ford comparatively to its key competitors.
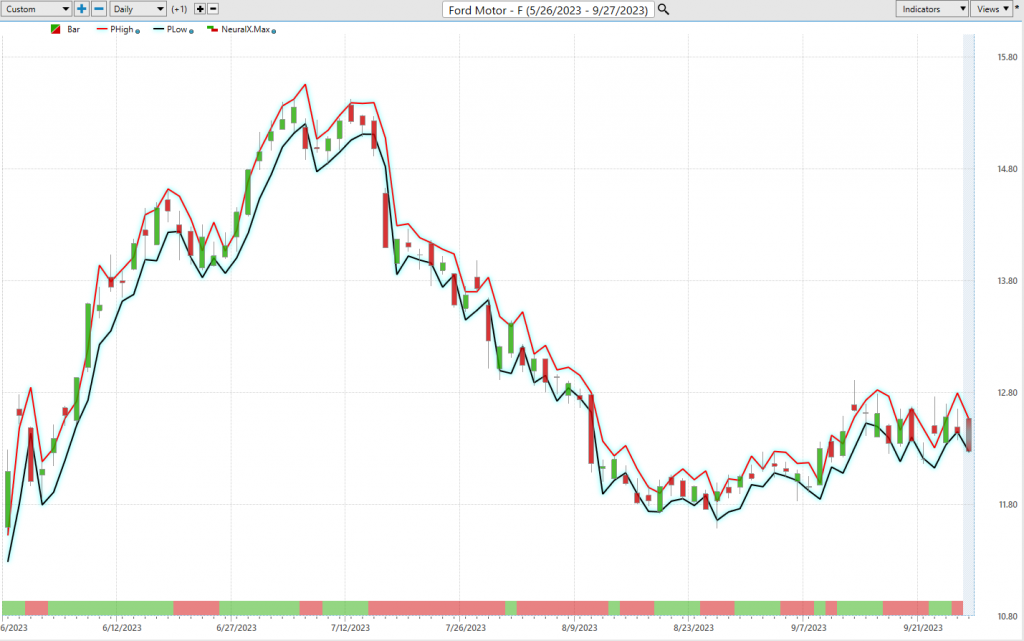
The Vantagepoint A.I. Predictive Blue Line
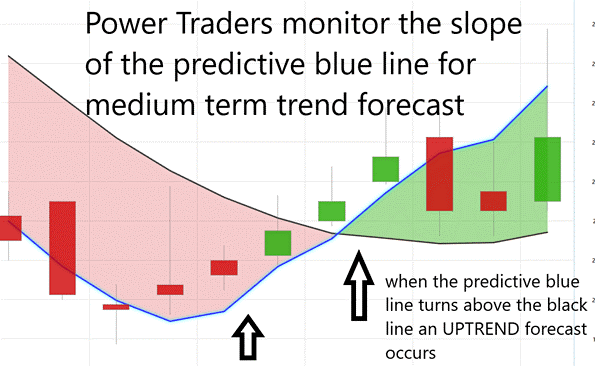
With the power of VantagePoint Software and its artificial intelligence capabilities, traders are kept in the know with trend forecasts that hinge on monitoring the slope of that all-important predictive blue line. Now, don’t let the simplicity of the black line fool you; it’s essentially a straightforward 10-day moving average of prices, telling us what’s already transpired in the market.
But let’s zero in on that predictive blue line, shall we? This line doesn’t just rest on its laurels; it functions as a value zone where savvy traders in uptrends aim to secure the asset at or below this elusive blue boundary. And how does this magical blue line come to life; you ask? Well, it’s the brainchild of VantagePoint’s patented technology, a masterful blend of artificial intelligence, neural networks, and intermarket analysis working in harmony to chart the most promising path forward.
Now, as we delve into the chart above, your eagle eye should zero in on the intricate dance between the black line and that predictive blue line. You see, the predictive blue line relies on VantagePoint’s patented neural network and Intermarket analysis to establish its worth. It’s not about hunches; it’s about scrutinizing the most robust price influencers of an asset via artificial intelligence and statistical correlations to pinpoint its true value.
And here’s the kicker, folks: whenever we spot that predictive blue line rising above the black line, it’s akin to a clarion call for an UP-entry opportunity. So, keep those eyes peeled and stay sharp!
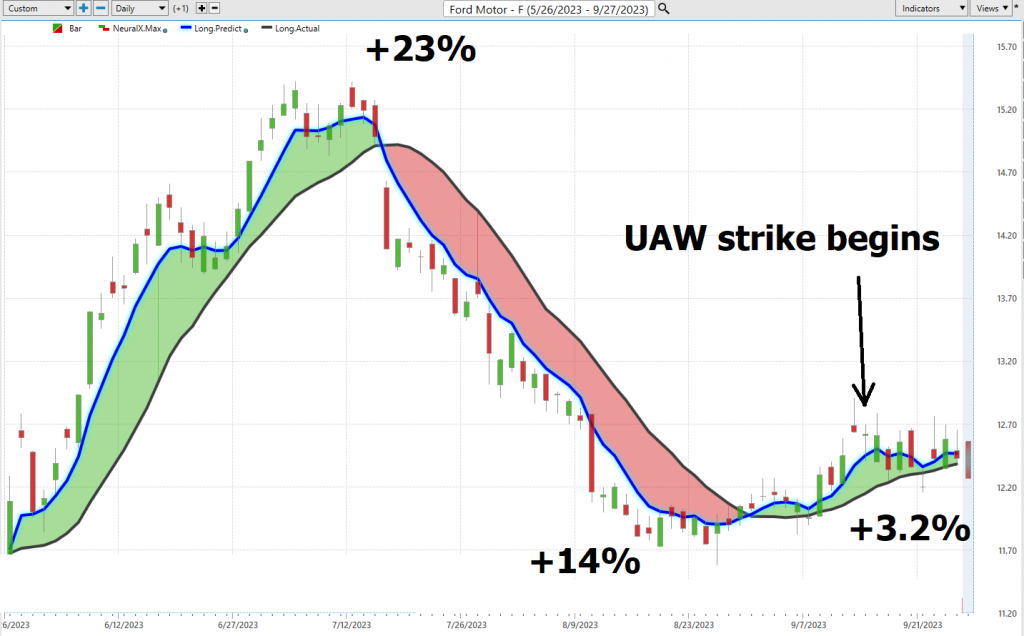
You can clearly see that over the last 4 months, 3 very clear trend forecasts have occurred.
#1 resulted in 23% gains on the long side.
#2 resulted in 14% gains to the short side.
#3 currently has 3.2% gains on the long side.
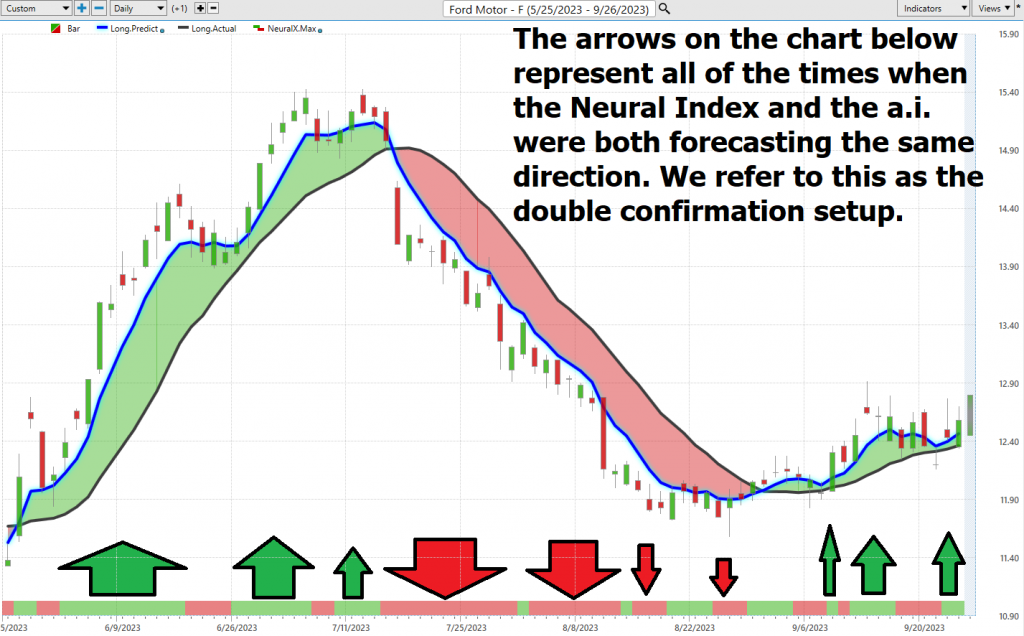
Fine Tuning Entries with The Neural Net Indicator
Neural networks, stemming from research dating back to the 1950s at institutions like Cornell and Carnegie Mellon, are essentially computer algorithms that traders use to forecast market movements. Think of them as the brains behind super-smart robots designed to make astute decisions when it comes to buying and selling assets.
Picture this neural network as a web of interconnected dots, akin to a spider’s web. Each dot represents a tiny decision the robot can make, connected by lines. Initially, the robot’s brain is a blank slate, so traders provide it with a slew of examples. They teach it that when prices are low, it’s often wise to buy, and when prices are high, selling is often the better choice.
The robot sifts through these examples and discerns patterns. It realizes that buying low and selling high tends to yield favorable outcomes. As it continues to practice with more examples, those connections between the dots strengthen. The robot becomes adept at recognizing when to buy and when to sell, almost as if it’s relying on its own intuition.
So, a neural network for trading is akin to a savvy robot’s brain that learns from real-life examples, allowing it to make optimal choices in the buying and selling process.
Right at the bottom of our chart, you’ll spot something called the Neural Index Indicator. When you see a splash of green there, it’s telling you the market’s got some pep in its step. But when it flashes red, it’s hinting we might be heading for a little bit of downside price action.
Incorporating AI and machine learning, neural networks are invaluable for forecasting stock prices, dissecting extensive financial data, and detecting irregularities. Astute traders harness the insights from these neural networks combined with A.I. for reliable trading opportunities.
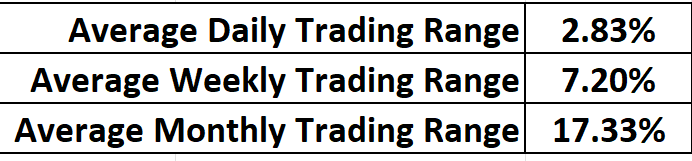
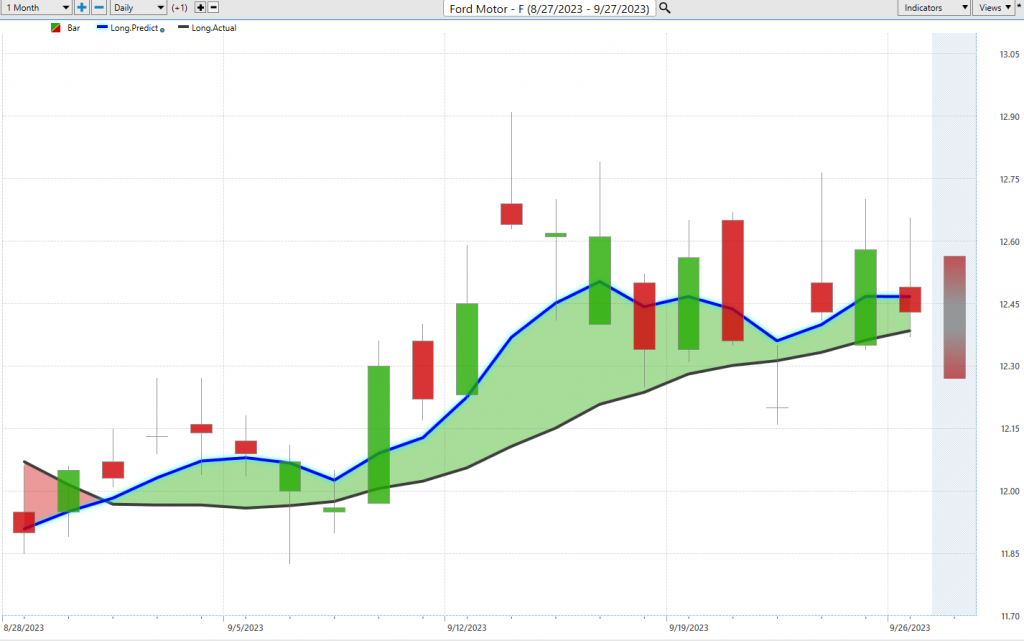
VantagePoint Software Daily Price Range Prediction
For those Power Traders who religiously swear by VantagePoint Software, there’s a feature they often turn to, like clockwork: the Vantagepoint Daily Price Range forecast. It’s as if this tool has become their market compass, guiding them through the tricky terrains of buying and selling.
Here are the average trading range metrics for $F over the past year for the daily, weekly, and monthly time frames.
Now, for any trader out there, the daily dilemma – and trust me, it’s an agonizing one – is pinpointing the exact moments to make a move in the market. But with VantagePoint’s A.I. and this Daily Price Range Forecast, it’s like having a seasoned mentor whispering wisdom in your ear.
That brings us to the three cornerstones of trading: volatility, opportunity, and risk. Think of volatility as the heartbeat of the market. It’s dynamic, it’s pulsating, but it also comes with its share of palpitations. For all its potential windfalls, volatility can be a double-edged sword, slashing your investments if you’re not careful. So, the savvy trader has a game plan, armed with risk mitigation tactics like stop-loss orders, a sprinkle of diversification, and a constant pulse check on how much risk they can stomach.
Enter the VantagePoint A.I.’s daily range forecast. Imagine if you could get a hint, a nudge, about where the market might venture next. By catching opportunities at the low end of the predicted range and potential exits at the peak, traders can potentially turn the tide in their favor, all while keeping risks on a tight leash.
But here’s the kicker: the stock market’s daily price isn’t just swayed by boardroom decisions or quarterly reports. Anything from a tweet to a tempest can tip the scales. So, forecasting? It’s no child’s play. But VantagePoint A.I. seems to have found a sweet spot, blending A.I., neural wizardry, and machine learning, all in the pursuit of that elusive, perfect forecast.
The KEY to successful trading is all about knowing the perfect moment to get in and out of the market. VantagePoint doesn’t just help you find that moment; it does it with remarkable precision. The Daily Range forecast is updated daily, giving you insights into where prices might be headed. Think of it like having a wise old mentor whispering market wisdom in your ear.
Now, check out that chart. It’s not just pretty lines; it’s a guide for placing your stops and managing risk. Notice how prices rarely break below the dark line? That tell you the ideal place to place buy stops is in that specific vicinity. It keeps the risk in check.
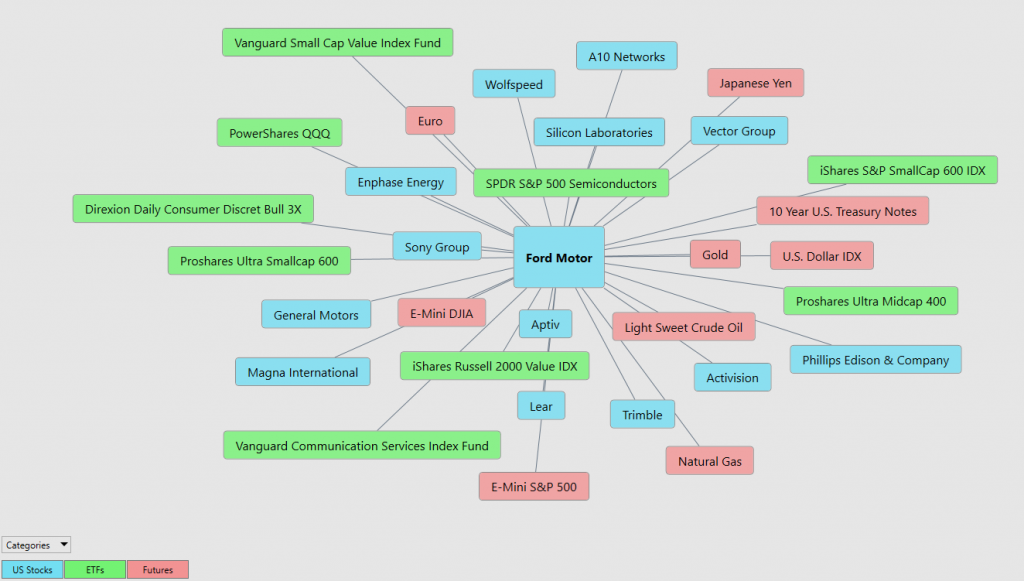
Intermarket Analysis
In the dynamic world of trading, it’s not just about what you know; it’s about how you wield that knowledge. Traders are akin to detectives, tirelessly seeking the true catalysts behind stock price movements. While headlines may capture everyone’s attention, traders are the ones delving deep, unearthing the genuine driving forces.
Enter Intermarket analysis, your exclusive backstage pass to the financial spectacle. It’s akin to peeking behind the curtain to witness how stocks, bonds, commodities, and currencies harmonize in a complex dance. You see, when one asset takes the spotlight, another may quietly recede into the shadows.
Let’s illustrate this with an example: Consider a stock like Ford ($F). Most folks might skim the surface, but experts? They’re examining the top 31 factors that sway its price.
So, what exactly is intermarket analysis all about? At its core, it’s about comprehending the intricate web that interconnects global markets. When oil prices surge, it doesn’t just mean higher gas prices at the pump; it could signal elevated costs for companies, potentially deflating their stock prices. A shift in bond yields? That might suddenly make other investments more enticing, sending ripples through the direction of capital flows and even impacting currency valuations.
For those entering the world of trading, John J. Murphy wrote the playbook on this strategy with his book “Intermarket Technical Analysis.” It’s akin to a deep dive into how markets are intertwined, swaying to the cadence of trends and signals. And then, you’ve got individuals like Lou Mendelsohn of Vantagepoint Software, leading the charge in refining these market relationships, simplifying them for traders.
So, traders, the next time you find yourself pondering why a stock is ascending or descending, consider the bigger picture. It’s about grasping these intermarket connections, where the true magic unfolds.
What sets Vantagepoint Software apart is its remarkable ability to perform Intermarket analysis and identify the interconnected assets that drive the price of Ford ($F) higher or lower.
While chart analysis provides objective insights into locating support and resistance levels, we dwell in a global marketplace where everything is interconnected. These invisible yet highly correlated intangibles, such as small shifts in interest rates, crude oil prices, and currency volatility, affect companies’ decisions to navigate these challenging times. Determining these factors remains a monumental task for investors and traders alike.
So, in essence, dear traders, Intermarket analysis allows you to decipher the intricate dance of global markets, helping you connect the dots and uncover the true drivers of asset prices. It’s like solving a captivating puzzle in the ever-evolving world of finance.
Suggestion
Let’s take a closer look at Ford’s stock based on some key fundamental metrics. First off, we’ve got a Price-To-Earnings (P/E) ratio of 12.1x, which is notably below the US market’s average of 15.3x. Now, that might raise some eyebrows and grab the attention of value-conscious investors. It suggests that Ford’s shares could be trading at a relative discount compared to the broader market.
Furthermore, earnings are expected to grow at a healthy clip, forecasting a robust 14.9% per year. That’s certainly an appealing prospect for investors seeking growth potential in their portfolios. Combine that with the lower P/E ratio, and it paints a picture of an undervalued stock with potential upside.
Now, let’s put Ford in context with its peers and industry. It’s trading at a good value compared to its counterparts. This could imply that, from a valuation perspective, Ford is holding its own in the highly competitive automotive landscape.
However, it’s important to exercise caution as we navigate these metrics. Ford does carry some red flags that merit consideration. Firstly, its debt isn’t well covered by operating cash flow, suggesting a potential liquidity challenge. Ford is bleeding in its attempt to bring EV’s to the market in a cost-effective manner. Secondly, the company has an unstable dividend track record, which may not sit well with income-seeking investors looking for reliability.
Lastly, profit margins have taken a dip, standing at 2.4% compared to last year’s 7.9%. This indicates a decrease in profitability, and investors should watch closely to see if Ford can reverse this trend.
What’s electrifying investors about Ford – their pivot to electric vehicles (EVs). Ford Model e, it’s been making some serious waves with a jaw-dropping 39% revenue surge in the most recent quarter, tallying up to a cool $1.8 billion. CEO Jim Farley has set the stage for a grand production plan. He’s saying Ford expects to be cranking out a whopping 600,000 EV cars on an annualized run rate by 2024, with a staggering 2 million as the ultimate goal. To put that in perspective, consider that Ford managed to sell just 47,000 EV units in the first half of this year.
We’re talking about a colossal shift in the automotive landscape. Ford, a veteran in the industry, is positioning itself to be a heavyweight contender in the electric vehicle arena. The numbers don’t lie – that 39% revenue surge is a testament to the growing demand for their electric offerings.
And when you’ve got a CEO like Jim Farley setting the bar so high, it’s evident that Ford is in this game for the long haul. The road to 600,000 EVs is a challenging one, but it’s a journey they’re determined to make. So, while they might have only sold 47,000 EVs in the first half of the year, don’t underestimate the potential for Ford to make some serious strides in the EV market in the years to come.
In conclusion, while Ford’s stock may appear attractive based on its lower P/E ratio, strong earnings growth forecasts, and relative value within its industry, there are caveats to bear in mind. Debt coverage and dividend stability are areas of concern, and declining profit margins warrant vigilance. Traders should approach Ford with cautious optimism, weighing the potential benefits against these risks before making any trading decisions.
Our advice: Follow the A.I. trend analysis and practice good money management on all of your trades. We like the idea of purchasing pullbacks in the stock as long as the overall a.i. guidance is bullish.
We will re-evaluate our opinion based on new data that affects the following which we have elaborated on in this study:
- Wall Street Analysts’ Estimates
- 52-week high and low boundaries
- Vantagepoint A.I. Forecast (Predictive Blue Line)
- Neural Network Forecast
- Daily Range Forecast
- Intermarket Analysis
FORD ($F) deserves to be on your trading radar.
Let’s Be Careful Out There!
Remember, It’s Not Magic.
It’s Machine Learning.
Disclaimer: THERE IS A HIGH DEGREE OF RISK INVOLVED IN TRADING. IT IS NOT PRUDENT OR ADVISABLE TO MAKE TRADING DECISIONS THAT ARE BEYOND YOUR FINANCIAL MEANS OR INVOLVE TRADING CAPITAL THAT YOU ARE NOT WILLING AND CAPABLE OF LOSING.
VANTAGEPOINT’S MARKETING CAMPAIGNS, OF ANY KIND, DO NOT CONSTITUTE TRADING ADVICE OR AN ENDORSEMENT OR RECOMMENDATION BY VANTAGEPOINT AI OR ANY ASSOCIATED AFFILIATES OF ANY TRADING METHODS, PROGRAMS, SYSTEMS OR ROUTINES. VANTAGEPOINT’S PERSONNEL ARE NOT LICENSED BROKERS OR ADVISORS AND DO NOT OFFER TRADING ADVICE.