


| This week’s a.i. Stock Spotlight is General Electric ($GE) |
General Electric (GE) is an American multinational conglomerate with a storied history that dates to its founding in 1892 by Thomas Edison and J.P. Morgan. GE has evolved from its early focus on electric light and power to become a diversified entity involved in a range of industries, including aviation, power, renewable energy, and healthcare. GE’s iconic logo, designed by Charles Edward Cleaves in 1892, features intertwined letters ‘G’ and ‘E’ enclosed in a circle, symbolizing their various interconnected businesses.
The company is headquartered in Boston, Massachusetts.
During World War II, GE played a crucial role in manufacturing military equipment, including aircraft engines and radar technology. GE’s research labs have been awarded numerous Nobel Prizes for their contributions to science and technology.
GE’s main competitors include other industrial giants such as Siemens AG, Honeywell International, and United Technologies Corporation (now part of Raytheon Technologies after a merger). These companies compete in various fields, including aviation, energy, and healthcare technologies.
GE generates revenue through its various business segments. Historically, it operated in numerous sectors, including lighting, transportation, and digital technology. However, in recent years, GE has streamlined its operations to focus on its core businesses of aviation, healthcare, and power, with renewable energy also playing a crucial role. Each of these sectors serves as a profit center, contributing to the conglomerate’s overall financial health.
The company’s journey is a tale of innovation, expansion, and adaptation. GE became profitable early in its history, leveraging the industrial boom in the United States and Edison’s patents. However, its financial performance has seen difficulties over the years, influenced by economic cycles, strategic decisions, and market competition. GE’s debt levels have been a point of concern for investors and analysts alike, with the company undertaking significant efforts to reduce its leverage through asset sales and restructuring initiatives.
The biggest opportunities for GE lie in its strong presence in the aviation and healthcare industries, sectors expected to see significant growth. Additionally, GE’s investments in renewable energy align with global trends towards sustainability. However, these opportunities come with risks, including technological disruptions, regulatory changes, and the cyclical nature of some of its key markets.
GE’s product portfolio is diverse, with its aviation and healthcare divisions traditionally being significant revenue generators. The company’s jet engines, medical imaging devices, and power generation equipment are among its most recognized products. In the last decade, GE has made several strategic acquisitions, particularly in the healthcare and power sectors, to bolster its market position and technological capabilities.
In terms of leadership within its niche, GE has been both a leader and a laggard at various times. Its aviation and healthcare divisions are considered leaders in their respective fields, thanks to their innovative products and strong market positions. However, the company has faced challenges in other areas, such as its power division, which has struggled amid shifting market dynamics and operational issues.
Despite its American roots, GE operates in more than 130 countries, highlighting its global footprint and employs 174,000 people.
GE’s revenue streams are diverse, stemming primarily from its various profit centers:
1. Aviation: GE Aviation is a global leader in aircraft engines and related services, serving both commercial and military markets.
2. Healthcare: GE Healthcare offers medical equipment, diagnostics, and healthcare information technologies.
3. Power: GE Power provides solutions for power generation, including gas and steam turbines, and renewable energy solutions.
4. Renewable Energy: This segment focuses on wind and hydroelectric power generation.
5. Capital: GE Capital was historically involved in financial services, but the company had been shedding these assets to reduce its debt burden and refocus on its core industrial operations.
6. Digital: GE Digital focuses on industrial software solutions.
Just five years back, saying “General Electric” was pretty much a synonym for trouble. People were predicting doomsday scenarios for the company. But lo and behold, against all odds, the stock shot up by a whopping 166% during that time. Talk about a turnaround!
Now, let’s get real. This wasn’t a walk in the park. GE was facing some serious hurdles, and there were some unlucky breaks along the way. But here’s the critical issue: Can they keep this winning streak going? Can they keep delivering solid returns for investors?
The whole transformation of GE kicked off when Larry Culp took the reins as CEO back in October 2018. He stepped into a mess—tons of debt and a bunch of businesses that just weren’t pulling their weight, especially that power segment.
But Culp had a plan. He mixed it up with some strategic moves: selling off the dead weight, spinning off divisions, and tightening things up operationally. And do you know what? It worked.
Look at GE Transportation, for example. It’s now under Wabtec’s roof. And GE Lighting? Sold off to Savant Systems. They made some smart moves with GE Healthcare too, shedding some parts and then spinning off the whole shebang in early 2023. And don’t forget about saying goodbye to Baker Hughes and GE Capital Aviation Services.
All these moves made GE leaner and meaner. Revenues took a hit, sure, but they’re still standing tall with an estimated $65 billion in revenue by the end of 2023.
Now, GE Healthcare is out on its own, and next up is the spinoff of GE Vernova in 2024. That’ll bring together GE Power and GE Renewable Energy under one roof, while the rest becomes GE Aerospace.
GE’s been knocking it out of the park operationally. Under Culp’s leadership, they’ve tightened things up big time. It’s not just about cleaning up the balance sheet; it’s about running a tight ship across the board.
Take GE Power, for instance. Revenues might be down, but profits are up. And they’re expecting even bigger profits by 2024. They’re cutting out the fat, getting disciplined on pricing, and hustling to get more done with less.
So, what’s next? Well, GE Aerospace is soaring high with the rebound in air travel. And the power division? It’s a steady cash cow now. The big challenge? Getting that renewable energy arm back in the black.
Historically, GE has faced its share of challenges, including a substantial debt load. By the end of 2020, the company had reduced its total debt to approximately $64 billion, down significantly from its debt levels earlier in the decade.
GE’s biggest revenue generator historically has been its aviation division, specifically the manufacturing of jet engines.
The biggest opportunity for GE lies in its commitment to clean energy and technological advancements in aviation. They are positioned to capitalize on the global shift towards sustainable energy solutions and the modernization of air travel.
However, the risks include ongoing challenges in restructuring and reducing debt, market competition, and potential macroeconomic downturns impacting their diverse businesses.
In an era where the giants of industry often find themselves grappling with the specter of decline, General Electric stands as a beacon of resilience and strategic prowess. Cast into the crucible of public scrutiny and financial volatility, this titan of American enterprise has staged a comeback nothing short of miraculous. In sum, General Electric’s narrative is one of resilience, strategic acumen, and unwavering commitment to excellence. As this storied company writes the next chapter of its illustrious history, it stands as a testament to the enduring power of visionary leadership and the relentless pursuit of innovation and growth. The saga of GE’s resurgence is not just a story of a company’s rebirth but a reflection of the indomitable spirit that defines the very essence of American enterprise.
In this stock study we will look at the following metrics and indicators.
Wall Street Analysts’ Estimates
Based on 13 Wall Street analysts offering 12-month price targets for General Electric in the last 3 months. The average price target is $147.54 with a high forecast of $165.00 and a low forecast of $130. The average price target represents a 7.24%% change from the last price of $184.91.
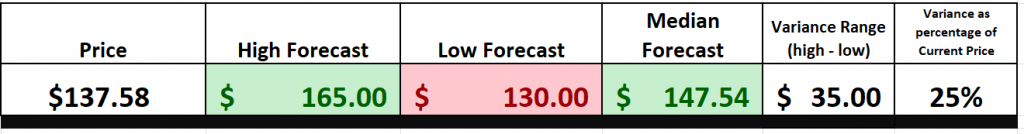
We typically like to look at the variance between the most bullish and bearish forecasts and use that as a gauge for future expected volatility. Currently this variance is 25% of the current price of $35. This is moderate.
We find this variance valuable as often rallies and declines are confined to this level of volatility.
We consider this to be a commonsense metric which allows us to perceive the tug of war easily and quickly between the most bullish and most bearish forecasts.
52-Week High and Low Boundaries
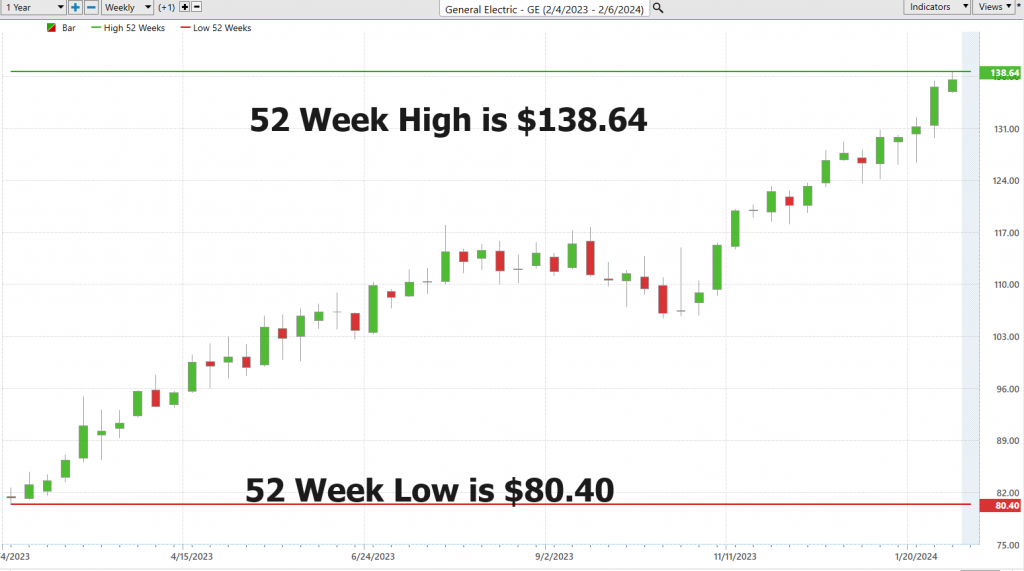
Over the past 52 weeks $GE has traded as high as $138.64 and as low as $80.40.
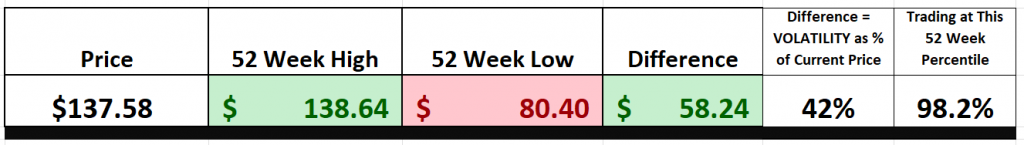
The annual trading range was $58.24. These numbers provide us with an accurate perspective of historic volatility which we can calculate by comparing the annual trading range to the current price Over the last 52 weeks the historic volatility was 42% which is higher than the broader stock market indexes. This value tells us that based upon the recent past it would be perfectly normal to expect prices to trade 42% higher and or lower over the next 52 weeks.
When analyzing a stock, we must first ground ourselves in the foundational principles. At the heart of this endeavor lies a fundamental element: the examination of a stock’s 52-week high and low. These delineations serve as more than mere numerical benchmarks; they are akin to a comprehensive report card, offering a tangible gauge of a stock’s performance throughout the preceding year. It is within this historical framework that we cultivate a deeper comprehension of the stock’s trajectory.
Ah, but do not be deceived by the simplicity of these numerical boundaries, for they unveil a wealth of insights into the stock’s momentum and underlying market sentiment. A stock ascending with higher highs and higher lows heralds a bullish narrative, while its counterpart, characterized by lower highs and lower lows, paints a bearish tableau. Furthermore, the proximity of investors to these thresholds – whether they exude optimism near the 52-week high or exhibit apprehension at the 52-week low – speaks volumes about prevailing market sentiment. Yet, here lies the crux of the matter: in the realm of decision-making, these 52-week highs and lows wield considerable influence. A breach beyond the 52-week high signals a potential buying opportunity, a moment of affirmation for investors. Conversely, a descent below the 52-week low serves as an unmistakable warning. These 52-week boundaries stand as steadfast pillars upon which we construct our investment strategies. They are the compass guiding us through the tides of market volatility, offering clarity amidst uncertainty.
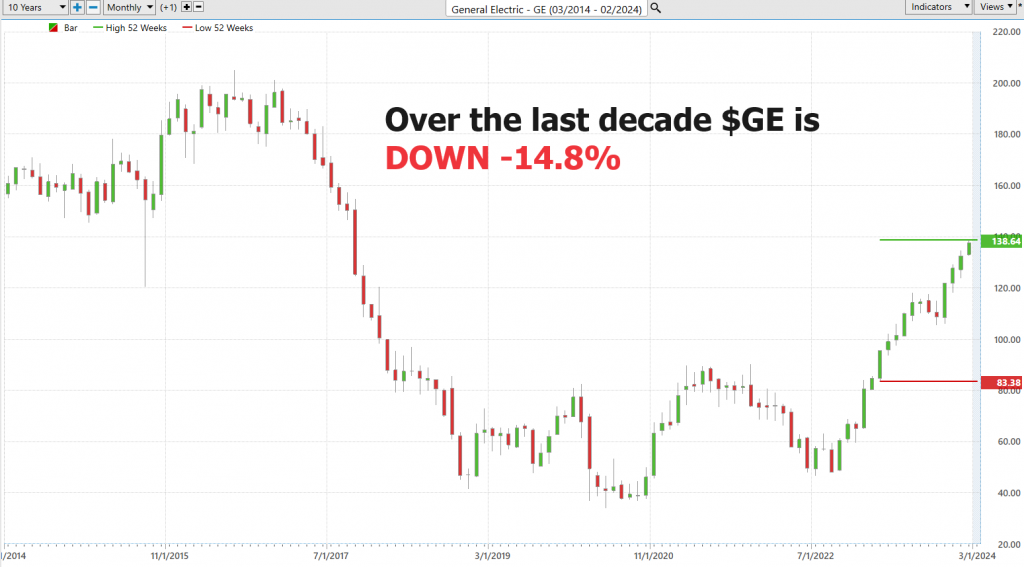
When we zoom out and look at the last decade, we see an entirely unique perspective. Over the last 10 years $GE is DOWN 14.87% and the stock is trading at the 60th percentile of the last decade.
Best Case – Worst Case Scenario
Let’s delve into a fundamental principle that every investor/trader should embrace: the delicate interplay between risk and reward. Amidst a sea of sophisticated techniques, one method stands out for its simplicity and efficacy – the best-case/worst-case analysis.
Imagine charting the highs and lows of a stock’s journey over the past year, akin to measuring the temperatures of a geographical region. This visual representation serves as our compass in deciphering the complexities of risk and reward amidst market volatility.
In essence, we must evaluate the rallies against the declines, to understand the financial landscape, and to gain a comprehensive understanding of the stakes involved. This strategic approach not only sheds light on future potential but also underscores the importance of risk assessment.
By meticulously analyzing both the zeniths and nadirs, we gain invaluable insights into a stock’s true potential. It’s not merely about forecasting profits; it’s about embracing a holistic perspective that encompasses the inherent risks.
This philosophy isn’t just a fleeting tactic; it’s a timeless strategy that empowers investors to navigate market fluctuations with confidence. It’s about making informed decisions, managing exposure, and crafting resilient investment strategies that strike a delicate balance between risk and reward.
Now, let’s apply this methodology to $GE.
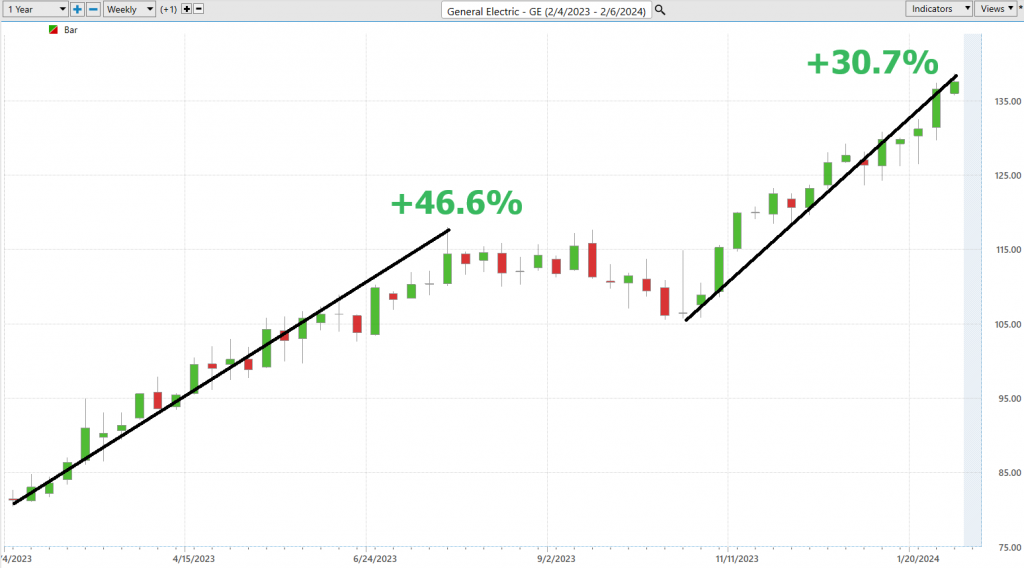
Here’s a best-case analysis,
Followed by a worst-case scenario analysis:
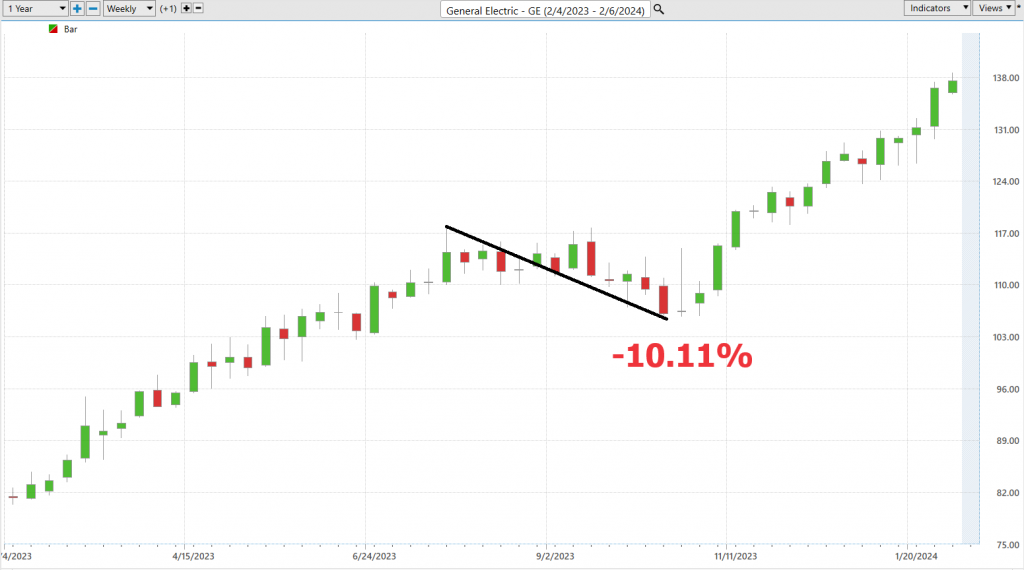
Through this methodology we can discern the nuanced dynamics of reward and risk within the context of General Electric’s performance over the past year and easily see that the bulls have been firmly in control.
Furthermore, juxtaposing $GE’s performance against broader market indices reveals its notable outperformance. This comparative analysis provides invaluable insights into $GE’s resilience amidst market turbulence.
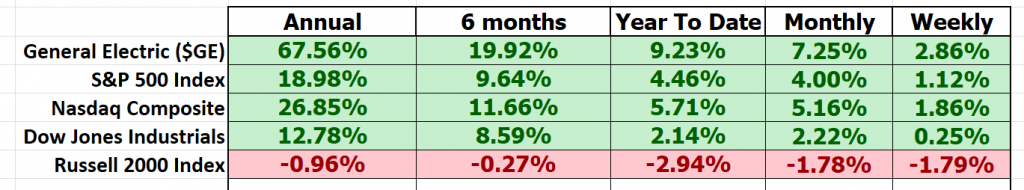
In essence, by embracing the best-case/worst-case analysis and comparing $GE’s performance to broader market trends, traders gain a deeper understanding of the inherent risks and rewards within their investment portfolios.
Let’s huddle up and talk turkey about something that’s hotter than a Florida summer – it’s this groundbreaking tool that’s shaking up the way smart folks look at the stock market. I’m talking about the Vantagepoint A.I. Triple Cross indicator. Now, this isn’t just another one of those fly-by-night gimmicks; it’s the real deal, a bona fide game-changer that’s bringing a whole new playbook to the field.
Last but not least we need to compare the volatility of $GE to the broader market. This is done by looking at BETA. Beta is a measure of a stock’s volatility in relation to the overall market. A beta of 1 indicates the stock tends to move in line with the market, while a beta greater than 1 suggests higher volatility, and a beta less than 1 implies lower volatility compared to the market.
General Electric ($GE), over the past 5 years, exhibits a beta of 1.19, indicating it is 19% more volatile than the broader market. So in $GE we have a stock which has performed comparably to the broader market with 19% more volatility and risk.
The VantagePoint A.I. Triple Cross Indicator
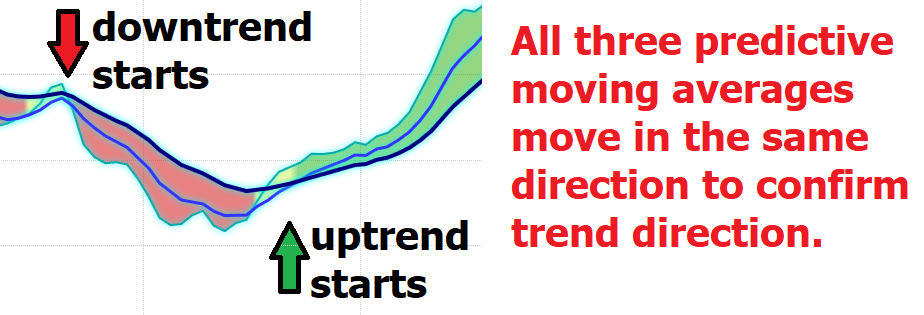
Picture this: we’re not just dealing with one or two, but three predictive moving averages. It’s like having a trio of wise old sages, each one giving you the lowdown on what’s happening in the market’s short-term, medium-term, and long-term trends. It’s as if you’ve got a 3-day, an 8-day, and an 18-day forecast, each one shining a light to guide you through the wild ups and downs of the stock market. This triple threat, my friends, is where the rubber meets the road.
Now, imagine these three moving averages lining up just so – it’s like watching a well-oiled machine, each part working in perfect harmony to cut through the noise and confusion of the market. When that short-term average crosses over the medium-term, it’s like a beacon in the night, signaling a potential shift on the horizon. And when the medium-term crosses the long-term? That’s your green light, the moment we’ve all been waiting for, a sign of a true-blue trend change.
The beauty of this Triple Cross indicator is its smarts – it’s like having a seasoned coach who knows when to play it safe and when to go for broke. It helps you steer clear of those too-good-to-be-true setups that end up going nowhere fast.
But here’s the kicker, the Triple Cross isn’t just any old indicator; it’s like your own personal lookout, always on guard, giving you a heads-up when it’s time to make your move. And it doesn’t just tap you on the shoulder once; it gives you the nod three times over, making sure you’re only putting your money on the line when the odds are stacked in your favor.
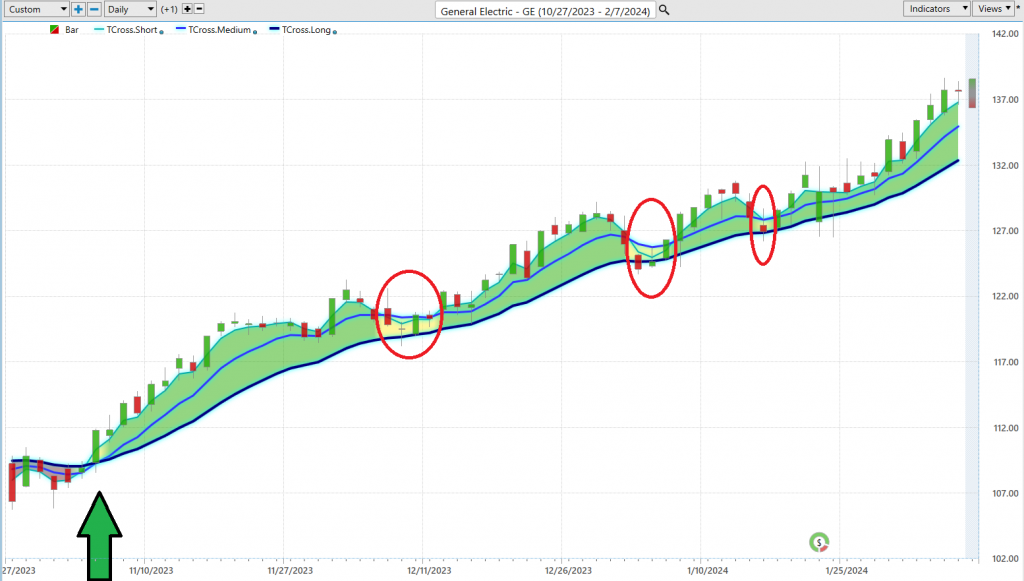
Now, let’s zero in on something that’ll really bake your noodle – the General Electric stock chart over these past few months. This, my friends, is where we roll up our sleeves and see the Triple Cross in action, where theory jumps off the page and into the real world.
The read circles on the chart are the times when prices retreated from the prevailing trend but you will see that they always found support at the 18 day predictive moving average,
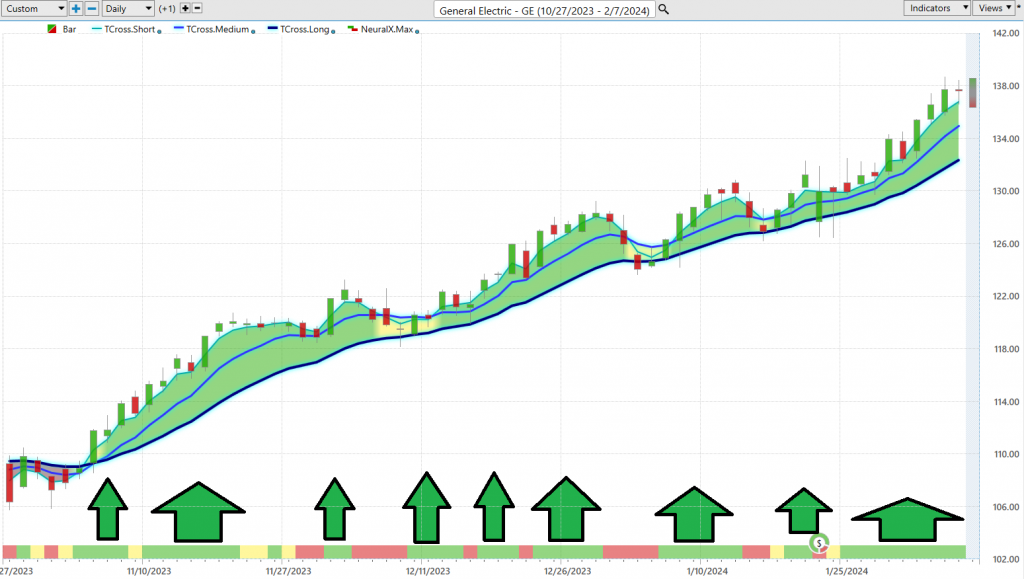
Neural Network Indicator (Machine Learning)
The Neural Network Indicator nestled at the chart’s base is a powerful predictive tool. This indicator acts as a harbinger of future market movements, signaling strength with a green hue and cautioning weakness with red. It’s akin to a weather forecast for market trends.
A neural network for traders is akin to having a supercharged assistant, capable of analyzing vast amounts of financial data and uncovering valuable insights. By mimicking the structure and function of the human brain, this sophisticated tool excels at recognizing patterns and relationships within market data, enabling traders to make more informed decisions.
Constructed with interconnected nodes organized into layers, a neural network learns from historical data through a process of trial and error, continuously refining its predictions over time. It excels at adapting to changing market conditions, automating certain tasks, and optimizing risk-return profiles.
In essence, a neural network serves as a powerful ally for traders, enhancing their decision-making process by providing accurate predictions, automating routine tasks, and improving risk management capabilities. With this technology at their disposal, traders can navigate financial markets with greater confidence and efficiency, aligning with my own philosophy of investing based on disciplined analysis and informed decision-making.
The chart of General Electric ($GE) is a testament to the power of these tools. The Neural Net Indicator, in tandem with the Triple Cross, has repeatedly offered Power Traders moments of ‘double confirmation,’ where the stars align for highly probable trading opportunities.
It’s in these instances, where technology meets probability, that traders can truly capitalize on market trends, turning data into decisive action.
VantagePoint Software Daily Price Range Prediction
The game-changer for Power Traders out there – is the Daily Price Range prediction forecast in VantagePoint Software. This is what Power Traders lean on every single day to fine-tune their market entries and exits. It’s like their secret sauce for making precise moves in the market.
Now, let’s dive into the numbers because, as we all know, data reigns supreme in the trading world. We’ve got metrics laying out the average trading ranges over the past year – daily, weekly, and monthly.
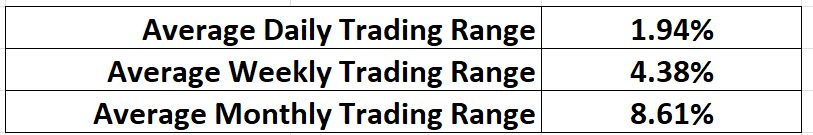
This kind of info gives traders a solid foundation to work from. But here’s the kicker – it’s not just about knowing the numbers; it’s about knowing how to use them effectively moving forward.
Imagine this: Every day, traders are faced with the challenge of figuring out where to make their market moves. It’s like trying to hit a moving target. But fear not, because VantagePoint’s A.I. swoops in to save the day with its Daily Price Range Forecast. This trusty companion helps you pinpoint exactly where to jump in and out of the market.
Take a gander at that chart, and you’ll finally see things clearly. It’s not just showing you where the market’s been; it’s giving you a glimpse of where it’s likely to head. And that’s pure gold for traders. But wait, there’s more – those dark lines on the chart? They’re your cues to place protective sell stops just below them, minimizing your risk in a trade.
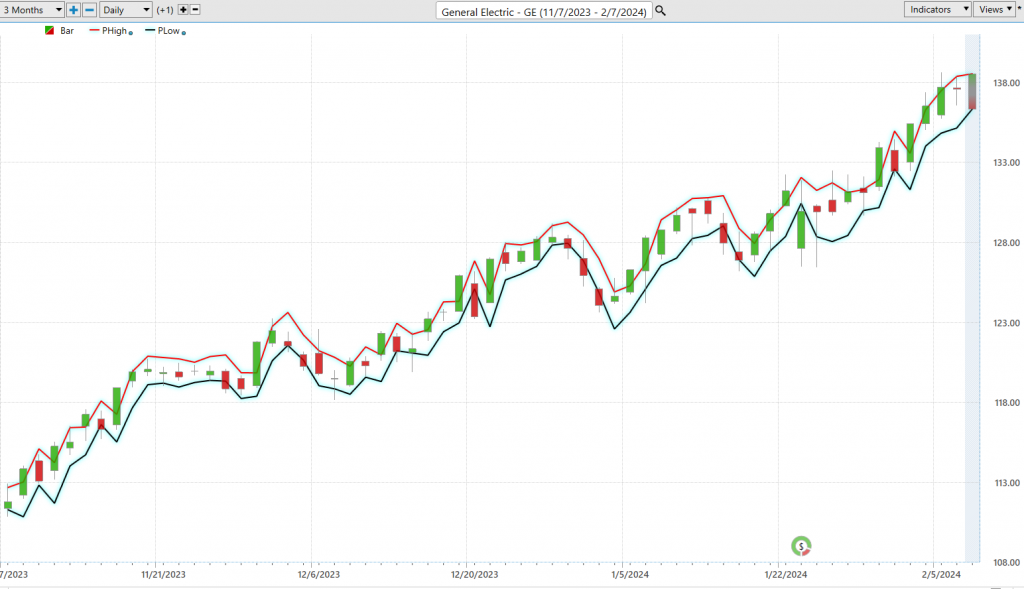
Now, let’s talk about those upper and lower bands of the price range forecast. They create a neat channel of trading activity. Swing traders, this is where you want to pay attention because this is your bread and butter. Look for buying opportunities at the bottom of that predicted channel and keep an eye out for selling opportunities near the top band.
In this ever-changing market, having the Daily Price Range Forecast at your fingertips can make all the difference between making a winning move or being left in the dust. Power Traders, listen up – this is your ticket to precision in a world full of uncertainty.
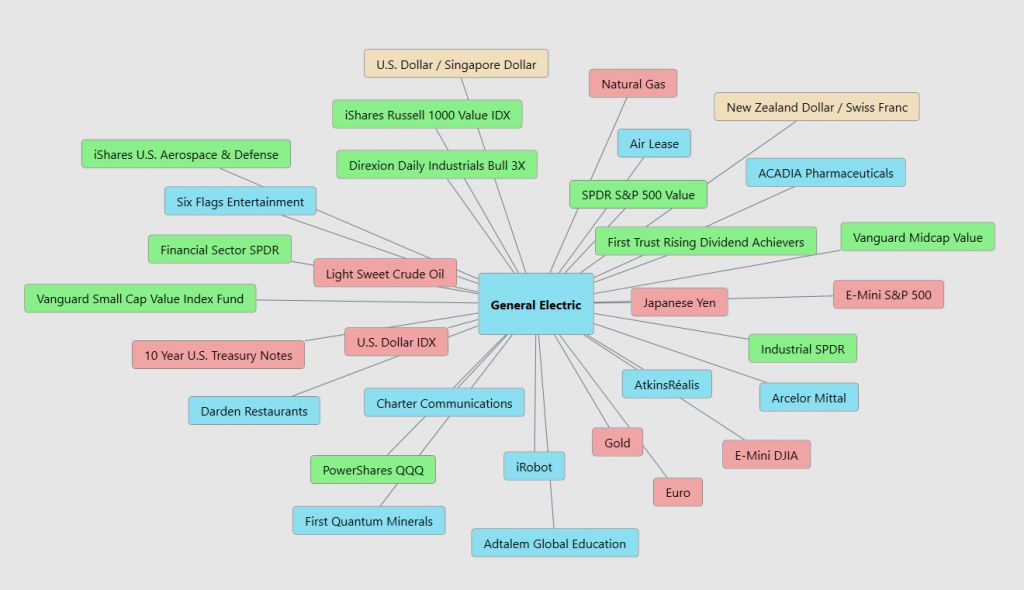
Intermarket Analysis
Alright, let’s break it down in simple terms, folks. Intermarket analysis is like putting on your detective hat in the world of finance. It’s all about understanding how different parts of the market connect and affect each other.
Here’s the deal: Instead of just looking at one stock or market, intermarket analysis zooms out and looks at the big picture. It’s like seeing how the pieces of a puzzle fit together. We’re talking about looking at stocks, bonds, commodities (like gold or oil), and currencies (like dollars or euros) all at once.
Why does this matter? Well, because what happens in one market can have a ripple effect on another. For example, if interest rates go up, it can make borrowing more expensive, which might slow down spending and affect the stock market. Or if oil prices shoot up, it could lead to higher costs for businesses, which might impact their stock prices.
Now, for new traders, this might sound overwhelming, but trust me, it’s worth it. By understanding these connections, you can spot trends early and make smarter decisions. It’s like having a roadmap that helps you navigate through the twists and turns of the market.
So, when you’re looking at a stock like $GE, don’t just focus on its performance alone. Dive into the intermarket analysis, and you might uncover some hidden clues for your trading journey. Think of yourself as a financial detective, piecing together the clues to crack the case of successful trading.
Our Suggestion
General Electric Company ($GE) has massively outperformed the broader market over the last 52 week and it looks like Wall Street is placing very close attention to the restructuring that is underway. The company still has $68 billion in long term debt which is concerning. However that value is positioned against $74 billion in revenue.
GE’s stock price marked a new 52-week high and showcased a robust one-year price change of 61.78%. The company’s commitment to diversifying its portfolio and its strategic moves, such as the upcoming spin-off of its power and renewable-energy business into GE Vernova, signal a transformative phase aimed at sharpening its focus and enhancing shareholder value.
GE has shown impressive short-term gains, with a 1.37% increase over the past 5 days and a 2.44% rise in the last 10 days. This momentum is supported by a 5.64% uptick in the past 30 days, indicating solid bullish sentiment among investors. The stock’s beta of 1.19 suggests it is slightly more volatile than the market, offering opportunities for traders to capitalize on price movements.
GE has consistently beaten EPS estimates in its last four earnings reports, demonstrating operational efficiency and the ability to exceed market expectations. This trend is a positive indicator for future performance, especially with the Q1 Earnings Report on the horizon scheduled for April 24, 2024.
Our suggestion is that traders should leverage artificial intelligence trend analysis when analyzing trading opportunities in $GE.
Th not just an advantage; it’s a necessity. AI algorithms excel in dissecting complex market data, identifying patterns, and predicting future movements with a level of precision and speed unattainable by human analysts alone.
For traders looking to navigate the volatile waters of the stock market, surrendering to the prowess of AI forecasts means embracing a tool that does the heavy lifting in trend analysis, risk assessment, and predictive modeling. With GE’s current trajectory and the transformative changes within the company, AI-driven insights can provide a critical edge in timing trades, optimizing entry and exit points, and managing portfolio risk.
Practice solid money management on all of your trades.
General Electric’s current market performance, combined with strategic corporate actions and solid earnings reports, paints a promising picture for short-term traders.
As GE continues to evolve, staying ahead of the curve with AI’s analytical power will be key to capitalizing on the stock’s potential.
Let’s Be Careful Out There!
Remember, It’s Not Magic.
It’s Machine Learning.
Disclaimer: THERE IS A HIGH DEGREE OF RISK INVOLVED IN TRADING. IT IS NOT PRUDENT OR ADVISABLE TO MAKE TRADING DECISIONS THAT ARE BEYOND YOUR FINANCIAL MEANS OR INVOLVE TRADING CAPITAL THAT YOU ARE NOT WILLING AND CAPABLE OF LOSING.
VANTAGEPOINT’S MARKETING CAMPAIGNS, OF ANY KIND, DO NOT CONSTITUTE TRADING ADVICE OR AN ENDORSEMENT OR RECOMMENDATION BY VANTAGEPOINT AI OR ANY ASSOCIATED AFFILIATES OF ANY TRADING METHODS, PROGRAMS, SYSTEMS OR ROUTINES. VANTAGEPOINT’S PERSONNEL ARE NOT LICENSED BROKERS OR ADVISORS AND DO NOT OFFER TRADING ADVICE.


