


This week’s ai stock spotlight is Hecla Mining ($HL)
Hecla Mining is not just another name in the precious metals space. It is, in fact, the largest primary silver miner in North America. That distinction carries enormous weight in today’s markets. Over the past two decades, countless mining companies operating in developing countries have faced a recurring problem: governments demanding a bigger slice of the pie. In some cases, that has meant giving away strategic metals at below-market prices. In others, it has meant strict export controls or outright nationalization — policies designed to keep silver, gold, copper, and other resources inside national borders rather than allowing them to flow freely to global markets.
By contrast, Hecla’s portfolio is anchored in the United States and Canada. Its mines — Greens Creek in Alaska, Lucky Friday in Idaho, Casa Berardi in Québec, and Keno Hill in the Yukon — are all located in jurisdictions with stable legal frameworks, reliable infrastructure, and a rule of law that protects both shareholders and long-term investments. That means traders don’t have to discount Hecla’s silver for political risk, nor worry about sudden government edicts siphoning away value.
For precious metals traders, this is a super big deal. Hecla offers direct exposure to silver prices without the geopolitical haircut. It is silver that is mined, sold, and priced in transparent markets — an essential feature at a time when resource nationalism is on the rise globally. In a world where stability is becoming as valuable as the metals themselves, Hecla’s North American footprint is not just a geographic detail. It is one of the company’s most strategic advantages.
Hecla Mining has been around since 1891, founded in the rough mining camps of Idaho, and it’s still standing tall more than 130 years later. Headquarters in Coeur d’Alene, Idaho. About 1,830 employees. And four profit centers that actually produce. That’s not a story stock — that’s real ore coming out of the ground every single day.
The revenue and earnings graphic lays out a clear turnaround story for Hecla Mining ($HL). From 2020 through 2023, the company struggled, piling up nearly $135 million in cumulative losses despite steady revenue. But 2024 marked a decisive shift: revenue surged to $929 million and earnings swung positive to $32.25 million. That strong performance, coupled with record results in the most recent quarter, has forced Wall Street to re-evaluate the company. Where once investors saw a chronic underperformer, many now see a miner finally hitting its stride — and believe that much brighter days may lie ahead for $HL.
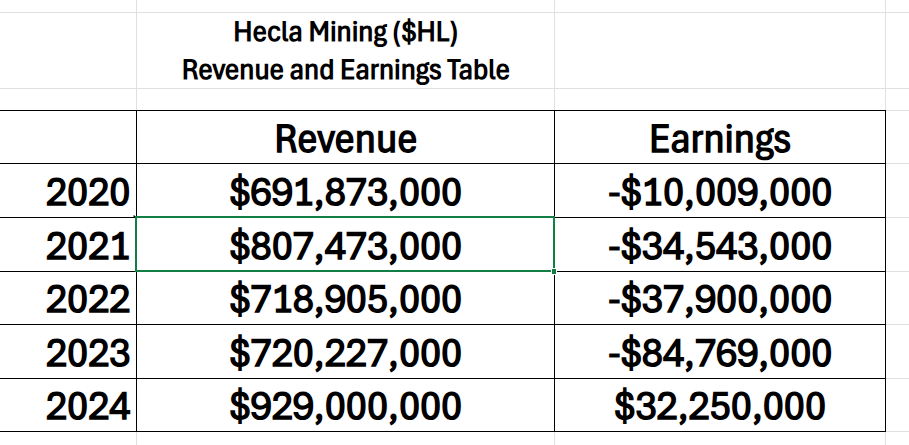
Now here’s the kicker: this year, Hecla didn’t just tread water. It exploded. In Q2 2025 they dropped record revenue of $304 million, $58 million in net income, and $133 million in adjusted EBITDA. Lucky Friday hit a new milling record. Greens Creek reaffirmed guidance with costs under control. Keno Hill finally posted its first profitable quarter. Management got on the earnings call and didn’t need hype, they just laid out the numbers, reaffirmed guidance, and let the scoreboard do the talking. Traders love that.
So, why’s the stock ripping higher, more than doubling in 2025? Simple. Silver’s been on a tear this year, and Hecla is the largest silver producer in the U.S. and Canada. They’re the liquid, North American proxy for silver. Funds need exposure? They buy $HL. Add in proof of execution — Lucky Friday and Greens Creek humming, Keno Hill finally delivering — and you get a runaway rally. Throw in momentum funds and retail traders piling on once the breakout started, and you’ve got liftoff.
But don’t kid yourself. This isn’t a free lunch. You’ve got to know the fine print. Hecla’s strength is in its capital structure — net leverage below 1x, balance sheet cleaned up, cash flowing. You’ve got the jurisdictional advantage — all mines in the U.S. or Canada, not some unstable regime halfway around the world. And you’ve got an exploration pipeline feeding the future. All good. But Casa Berardi has a looming production gap after 2027, and Keno Hill’s full ramp depends on permits and infrastructure that don’t come overnight. Those are the cards on the table.
Here’s the real trader’s edge: $HL trades like a leveraged bet on silver. When silver jumps 10%, Hecla can move 20–30%. Same on the downside. That’s why pros love it. It’s volatile, it’s liquid, and it’s tightly wired into the metal itself. Catalysts are clear: the next Keno Hill milestone, Casa Berardi’s long-term plan, and ETF flows into silver. Layer in the macro story — Fed policy, real yields, currency debasement — and you’ve got a stock at the intersection of execution and a monster commodity cycle.
Bottom line: Hecla isn’t just another mining stock. It’s the silver barometer for North America. Traders who get that — who know the company’s history, its profit centers, its balance sheet, and the risks — are the ones who won’t just chase the chart. They’ll trade it with conviction, backed by both fundamentals and the technicals that scream momentum. Winners keep winning. $HL has proven it this year. The question now is whether you’re sharp enough to ride it, or just another bystander watching history pass you by.
In this stock study, we’ll analyze the key indicators and metrics that guide our decisions on whether to buy, sell, or stand aside on a particular stock. These inputs serve as both our framework and behavioral compass, rooted in data and powered by predictive intelligence.
- Wall Street Analysts Ratings and Forecasts
- 52-Week High and Low Boundaries
- Best Case/Worst-Case Analysis
- VantagePoint A.I. Predictive Blue Line
- Neural Network Forecast (Machine Learning)
- VantagePoint A.I. Daily Range Forecast
- Intermarket Analysis
- Our Suggestion
While our decisions are ultimately anchored in artificial intelligence forecasts, we briefly review the company’s fundamentals to better understand the financial environment it operates in. For $HL this context helps us assess the quality of the A.I. signal within a broader economic and industry backdrop.
Wall Street Analysts Forecasts
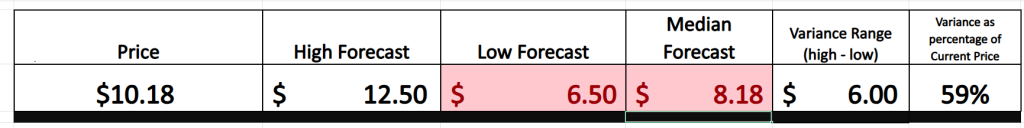
Wall Street’s forecasts for Hecla Mining ($HL) over the next 12 months tell a fascinating story. Analysts see a high target of $12.50, a low of $6.50, and a median of $8.18, with the stock currently trading near $10.18. That’s a spread of $6.00, or about 59% variance relative to today’s price. Now, here’s the secret: that variance is not just guesswork. It’s the market whispering to us about what’s already “baked in.” Analysts aren’t simply tossing darts at a board — they’re modeling future volatility, and that wide gulf between bullish and bearish tells us $HL will not be a sleepy ride.
This is what we always advise traders to watch like hawks: the variance range. Forget obsessing over whether the median forecast is right or wrong. What matters most is the distance between the most optimistic and the most pessimistic projections. That spread is the market’s early-warning system. It represents the volatility moving forward, the expected turbulence you can harness — or be crushed by. For disciplined traders, that’s not something to fear. It’s something to embrace. Volatility is opportunity, if you respect it.
So, when you see a 59% baked-in variance on $HL, understand what’s at stake. This isn’t a company Wall Street thinks will meander sideways. It’s a name that traders believe will test conviction — on both the upside and the downside. The winners will be those who prepare, manage risk, and ride the swings with eyes wide open.
52 Week High and Low Boundaries
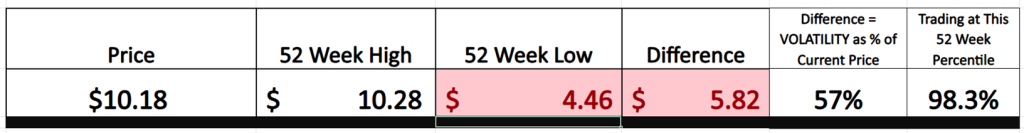
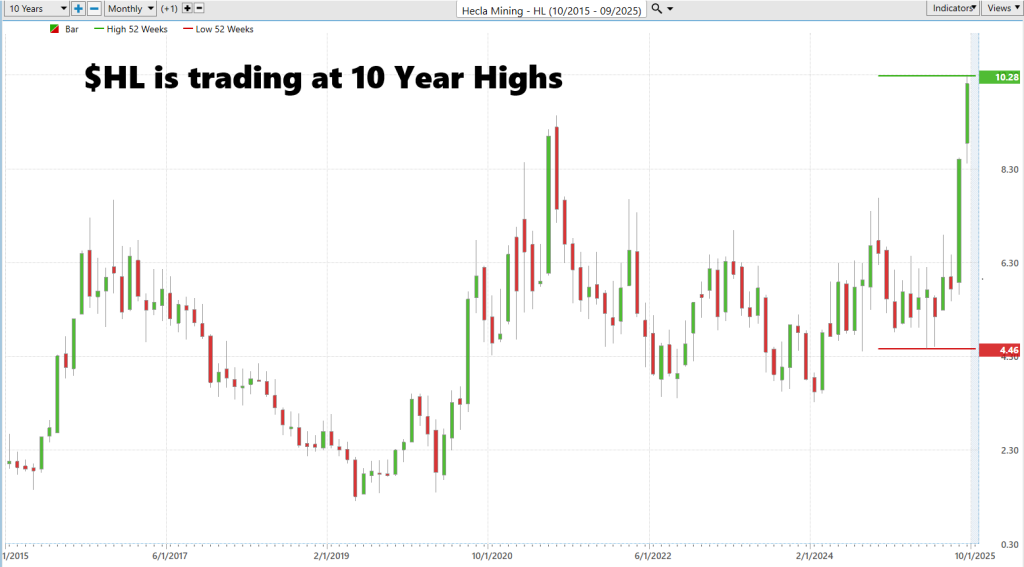
The attached graphic highlights a central truth about Hecla Mining ($HL): volatility has defined its past year. The spread between the 52-week high of $10.28 and the 52-week low of $4.46 is a staggering $5.82, equal to roughly 57% of the current share price. That variance is more than just a number — it is the stock’s historical volatility, the lived experience of traders and investors who have watched the stock swing almost six dollars from trough to peak in just 12 months. It underscores why silver miners, and Hecla in particular, are considered leveraged bets not just on commodities, but on the sentiment surrounding them.
Traders pay close attention to these 52-week boundaries because they serve as both psychological markers and technical guardrails. The low becomes a test of resilience: if broken, confidence falters. The high becomes a ceiling: if surpassed, it signals strength and triggers momentum buying. In Hecla’s case, the fact that the stock is currently trading within 98.3% of its 52-week high suggests something significant — investors are not just cautiously optimistic, they are leaning heavily into the bull case, forcing the stock to challenge and potentially redefine its upper boundaries.
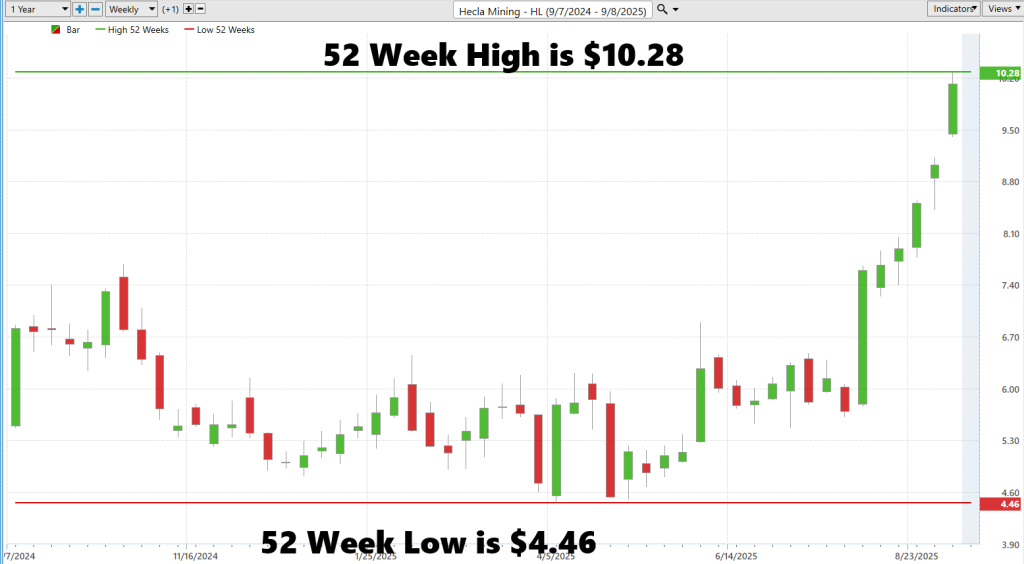
What makes this moment for $HL so potentially explosive is not simply that it is pressing on a 52-week high. It is that the stock is simultaneously breaking into 10-year highs, a rarity that traders interpret as a signal of structural strength rather than a short-term rally. When a stock overcomes both near-term and long-term barriers, it communicates something profound: management is delivering, the market is rewarding, and the path forward is being rewritten in real time. For Hecla, a company with over a century of history, this breakout carries a symbolic weight — it is a reminder that even old warhorses can enter new phases of growth when the conditions align. And for traders, it’s a moment to pay attention, because history suggests that when highs fall, momentum often builds into something much larger.
We also advise zooming out and studying the 10-year chart to better understand the long term trajectory that the stock has had.
Best-Case/Worst-Case Scenario Analysis
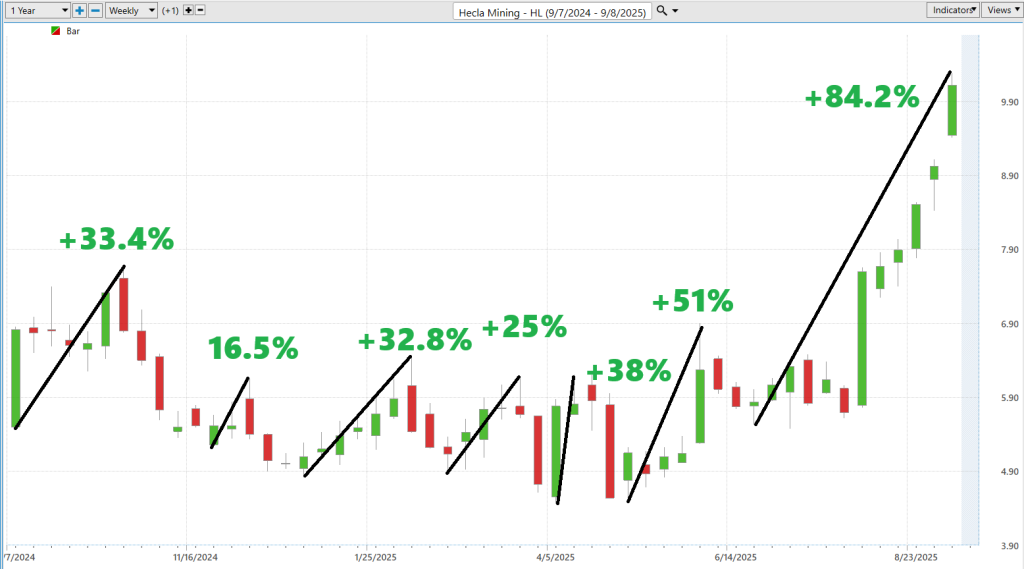
What these two charts reveal about Hecla Mining ($HL) is the kind of truth most traders ignore until it’s too late. Over the past year, this stock has staged six separate rallies, ranging from +16% to a jaw-dropping +84%. That is raw, undeniable evidence of upside potential. Not theory. Not prediction. Proof. And yet, alongside every one of those surges, the charts also record the punishment: sharp, uninterrupted declines of -20%, -25%, -32% or more. These swings are not noise — they’re the rhythm of the stock. The heartbeat of volatility.
Here’s why this matters: every trader wants opportunity, but few respect the cost of admission. $HL delivers both in abundance. Its rallies show you the power of catching the right wave. Its declines show you the consequence of mistiming the tide. Together, they paint a brutally honest picture of what’s at stake. You can’t erase the risk — but you can harness it. That’s the secret. The biggest winners aren’t the ones who avoid volatility; they’re the ones who prepare for it, plan for it, and profit from it.
We start by measuring the magnitude of the rallies.
Then we compare to the magnitude of the declines:
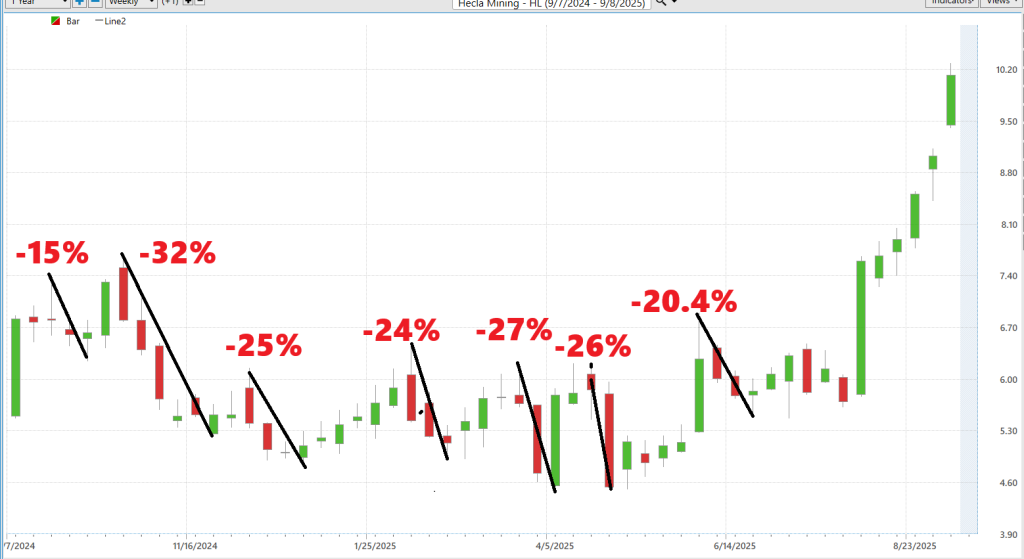
So, take these charts for what they are: your unvarnished guide to trading $HL. They kill delusion, strip away hype, and hand you the truth on a platter. This stock can soar 80%+ in a single stretch. It can also crater 30% without blinking. That’s the real-world range of motion. That’s the baked-in volatility. And for traders who want both excitement and opportunity, $HL isn’t just another silver miner. It’s a proving ground. Respect the swing, and it can reward you handsomely. Ignore it, and it will humble you just as fast.
Next, we compare $HL to the broader stock market averages:
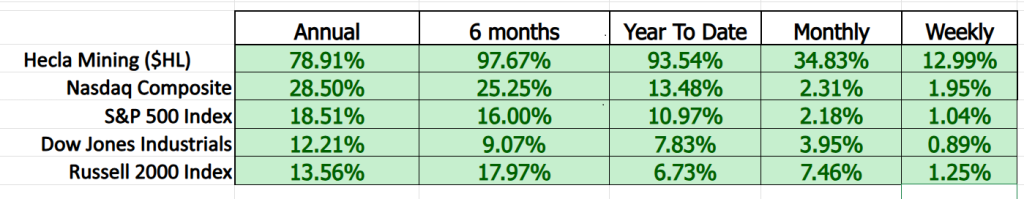
The beauty of a chart like this is that it cuts through the noise. No theories. No hype. Just the raw scoreboard. And what the scoreboard says is undeniable: Hecla Mining ($HL) is massively outperforming every major index. Over the past year, while the S&P 500 gained 18.5% and the Nasdaq climbed 28.5%, $HL surged nearly 79%. Stretch that to six months, and Hecla delivered a breathtaking 97.7%, compared to just 25% for the Nasdaq. Even week by week, the stock is clocking gains that leave the Dow, S&P, and Russell in the dust.
That’s what I call proof. Proof that something extraordinary is happening here. Traders don’t need to guess. The evidence is in black and white. When a stock beats the market averages by a factor of three, four, or even seven, it’s not luck — it’s momentum, fundamentals, and money flows converging into one irresistible force. That’s why the pros pay attention to relative strength. Because winners like this tend to keep winning, and you either ride them… or you watch others do it without you.
So, if this graphic does its job, it should trigger one response in you: curiosity. Curiosity about why $HL is crushing the Nasdaq, the S&P, and the Dow so decisively. Curiosity that leads you to put this stock on your radar. Because in trading, the numbers don’t lie — they persuade. And the numbers here are screaming that Hecla Mining isn’t just another miner. It’s a market leader in motion.
Vantagepoint A.I. Predictive Blue Line
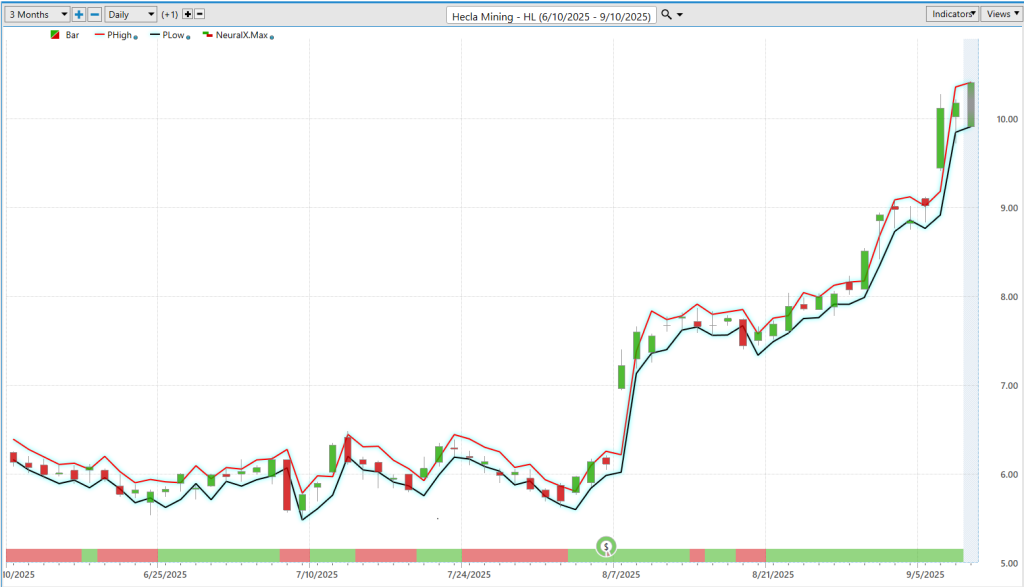
What you’re looking at here is one of the most remarkable stretches in Hecla Mining’s ($HL) recent history. In just five and a half weeks, the stock rocketed from $6.14 to $10.18 — a gain of nearly 66%. That’s not the kind of move you stumble into by accident. It’s the kind of run that can make or break a trading quarter.
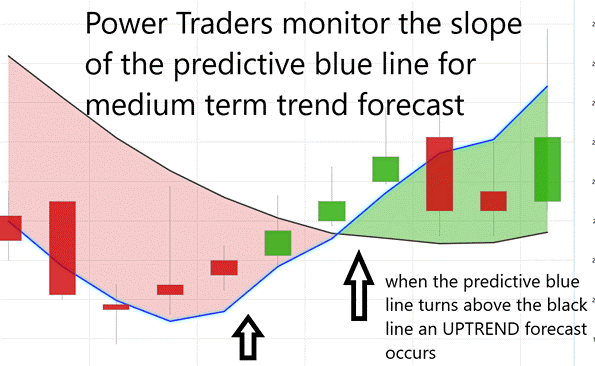
The golden rule of trading with the VantagePoint Predictive Blue Line is simple: when the blue line crosses above the black line (the actual moving average), it signals a shift to an uptrend — that’s your entry or confirmation to go long. When the blue line crosses below the black line, it indicates a likely downtrend, warning you to exit longs or consider shorts. The key is discipline: you don’t second-guess the signal, you align with it. Stay in trades as long as the predictive blue line holds its position relative to the black line, and let it guide you through short-term noise so you can ride the larger trend with confidence.
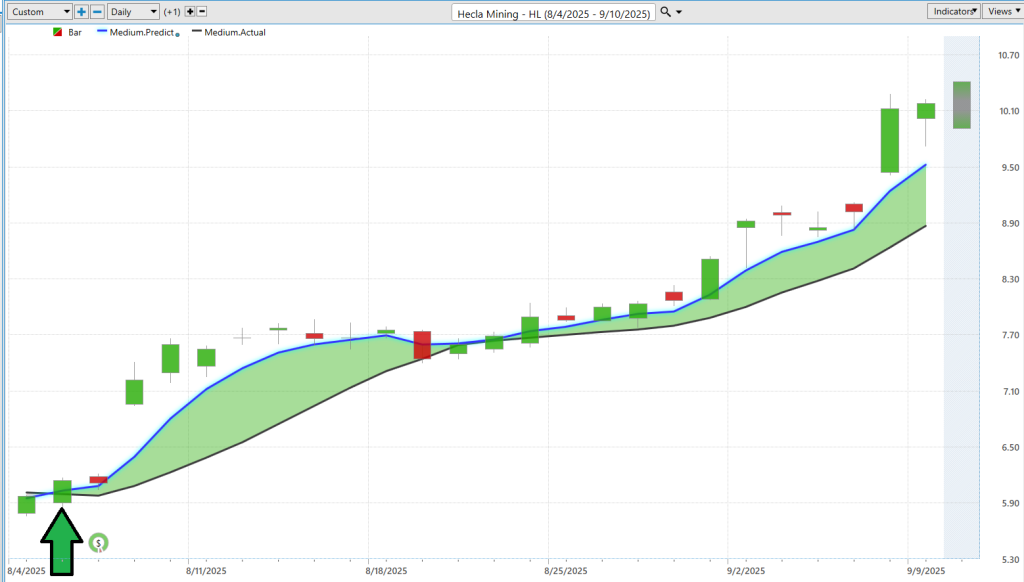
Now, here’s the critical part: the A.I. didn’t just participate in this move — it caught the entire thing. Look closely at the chart. The green arrow marks the moment when the predictive blue line crossed above the actual line, signaling the start of a bullish shift. From that point on, the blue line consistently guided traders upward, keeping them in the trade as the stock climbed week after week. Even during minor red days, the predictive signal held, reinforcing conviction when it was easiest to second-guess.
By the time $HL hit $10.18, the AI had captured the entire rally from the ground floor to the peak. That’s not hindsight, that’s foresight. For traders, this chart isn’t just evidence of a great stock run — it’s proof of what happens when advanced forecasting tools meet disciplined execution. The result? A front-row seat to one of the most powerful rallies in the silver sector this year.
Neural Network Forecast (Machine Learning)
A neural network in trading is, at its core, an attempt to replicate how the human brain processes information — only with infinitely more data, and without fatigue or bias. It’s constructed with layers of interconnected “neurons” that take in vast amounts of market data – price histories, intermarket relationships, technical indicators, even global correlations — and pass them forward, adjusting the weight of each input until the system can recognize patterns invisible to the human eye. The result isn’t a crystal ball, but rather a probability-driven forecast: a signal designed to help traders cut through noise and improve decision-making by focusing on where the odds are stacked.
The graphic below illustrates this point vividly. The neural index, a short-term forecasting tool derived from such a network, turned red — a warning that weakness was likely to develop over the next 48 to 72 hours. And that’s exactly what played out. Price softened, trading below the predictive blue line, which itself acts as a dynamic forecast of trend direction. In other words, the neural network flagged the coming shift before it showed up in price action. For traders, that’s not just a technical curiosity; it’s actionable intelligence. It allows them to adjust expectations, tighten risk, and be ready for near-term turbulence even while the broader trend remains intact.
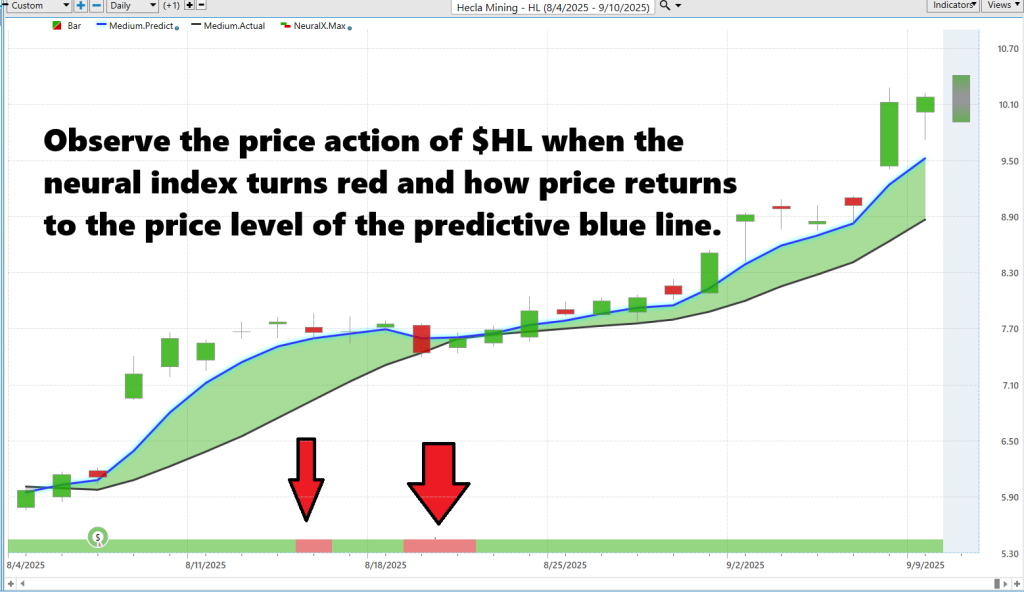
What we’re seeing here is the fusion of technology and trading discipline. By highlighting the moments when momentum falters — well before it becomes obvious on the chart — the neural index gives traders the ability to anticipate instead of react. And in markets like silver miners, where volatility is both opportunity and risk, that anticipatory edge can mean the difference between catching the wave and being crushed by it.
VantagePoint A.I. Daily Range Forecast
What all traders want — without exception — is a clear method of knowing where the risk and where the opportunity exists every day. Without that knowledge, trading becomes guesswork; with it, trading becomes strategy.
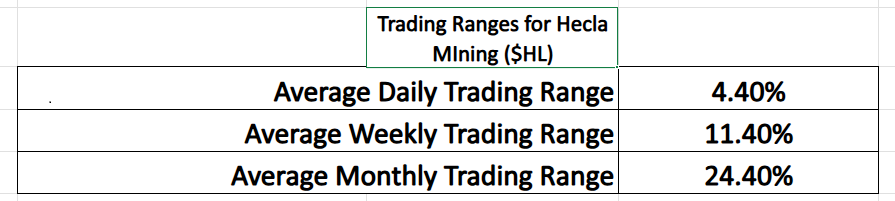
Folks, let’s be clear: the graphic above lays out the undeniable truth about Hecla Mining ($HL) — this is a stock that moves, and it moves big. On average, $HL swings 4.4% in a single day, 11.4% in a week, and an astonishing 24.4% in a month. That is volatility supercharged compared to the broader market. And here’s the point — those ranges aren’t just numbers; they represent both the risk and the remarkable opportunity in trading this stock. Traders must understand it’s precisely this kind of movement that demands discipline, proper position sizing, and respect for risk.
Now, the second chart drives it home. The VantagePoint Daily Range Forecast shows traders the expected highs and lows for each trading day. And what do we see? Accuracy — day after day, the price action of $HL falls neatly inside that forecasted range. That kind of precision is a tremendous advantage. Instead of guessing where the market might turn, traders have a roadmap: buy near the forecasted lows, take profits or protect capital near the highs, and manage stops with confidence.
Put together, these two visuals tell a powerful story. Yes, $HL is volatile. But that volatility is measurable, and with the right tools, it’s tradable. The average ranges prove the magnitude of opportunity, while the daily forecast shows you exactly how to navigate it. For traders, this isn’t chaos — it’s clarity, and it’s the difference between being tossed around by the market and using volatility to your advantage.
Intermarket Analysis
What drives Hecla Mining isn’t just about silver pulled from the ground. It’s about the big forces moving the entire marketplace.
You’ve got the obvious ones: the price of precious metals, investor appetite for gold and silver, and the relentless tug-of-war between the U.S. dollar and global currencies. When the dollar strengthens, it squeezes commodities; when it weakens, metals often shine. Then there are energy costs—oil and natural gas—critical inputs that can make or break mining margins.
Beyond that, the story is shaped by broader markets—Wall Street indexes, exchange-traded funds, and the performance of peers across the mining sector. Add in global demand trends, interest rates, and bond markets, and you have the financial crosscurrents that push this company’s stock higher or drag it lower.
And finally, let’s not overlook the intangibles: investor sentiment, speculation, and the hunger for safe havens when uncertainty strikes. Together, these events, cycles, and capital flows form the real price drivers for Hecla Mining.
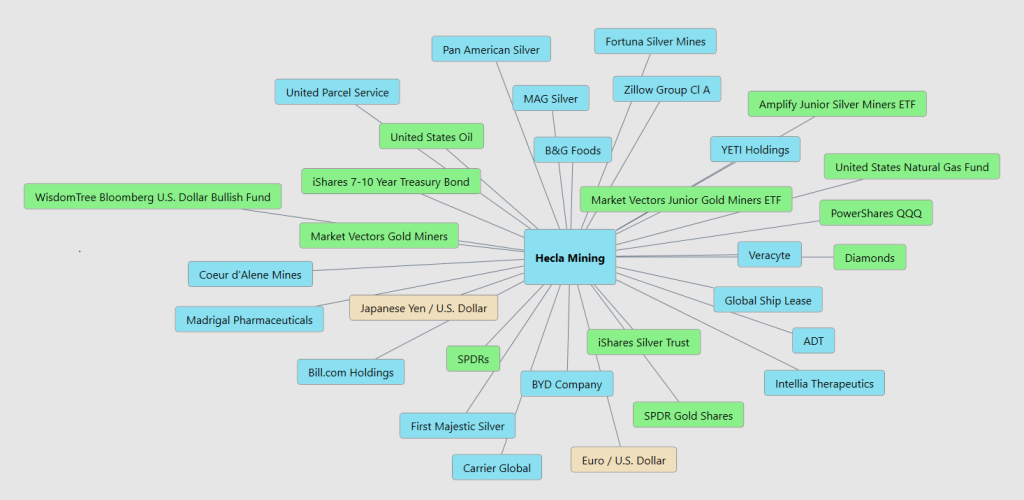
Here are the 31 key drivers of $HL price action:
Our Suggestion
Hecla’s inclusion in the S&P SmallCap 600 is no accident — it’s the market’s recognition that America’s largest silver producer has leveled up. They’ve earned it with operational strength, consistent execution, and a balance sheet that’s positioned to ride the next big wave. Index funds and institutions are about to pile in, bringing more liquidity and credibility with them. That’s a powerful tailwind for a stock that’s already outpacing every major benchmark this year.
Study the chart of Silver ($SI) over the last decade. When I study it, I remain very bullish.
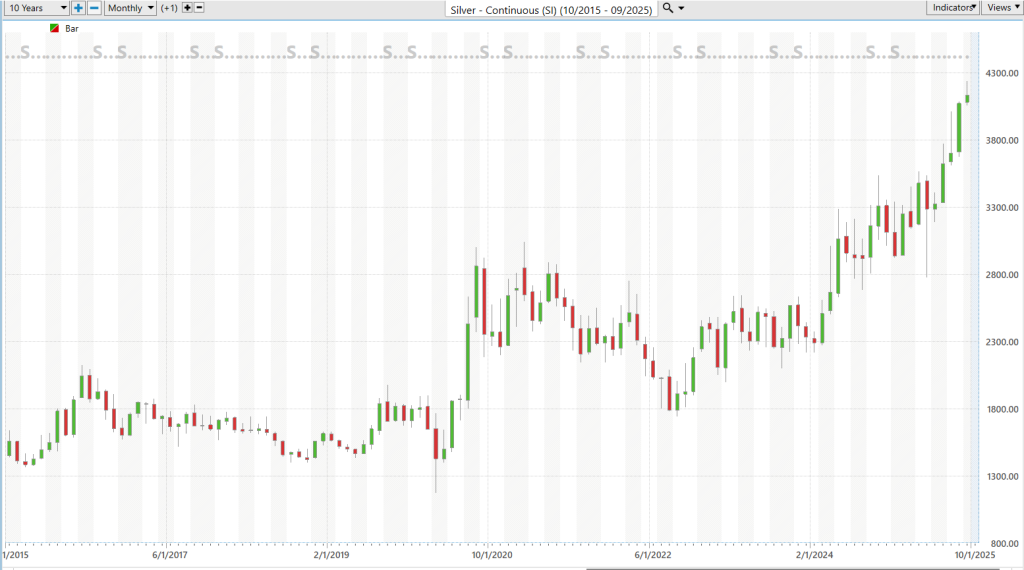
And here’s the bigger picture: silver is the only precious metal that still hasn’t broken through its 1980 high of $50 an ounce. Gold, platinum, palladium — all of them have already rewritten their records. Silver traders see that gap not as weakness, but as the ultimate setup. Industrial demand keeps growing, monetary demand is heating up, and sentiment is shifting. Silver isn’t just undervalued — it’s coiled like a spring, ready to explode higher.
Put those two forces together — Hecla’s rising prominence and silver’s historic undervaluation — and you have a story that every serious trader should be watching. But let me leave you with this: opportunity means nothing without discipline. Volatility cuts both ways, and silver stocks like $HL can hand you massive gains or gut-wrenching losses depending on how you manage them. So, practice good money management on every trade. Respect the swing, size your positions wisely, and you’ll give yourself the chance to not just ride history — but profit from it.
Let’s be careful out there.
It’s not magic.
Disclaimer: THERE IS A HIGH DEGREE OF RISK INVOLVED IN TRADING. IT IS NOT PRUDENT OR ADVISABLE TO MAKE TRADING DECISIONS THAT ARE BEYOND YOUR FINANCIAL MEANS OR INVOLVE TRADING CAPITAL THAT YOU ARE NOT WILLING AND CAPABLE OF LOSING.
VANTAGEPOINT’S MARKETING CAMPAIGNS, OF ANY KIND, DO NOT CONSTITUTE TRADING ADVICE OR AN ENDORSEMENT OR RECOMMENDATION BY VANTAGEPOINT AI OR ANY ASSOCIATED AFFILIATES OF ANY TRADING METHODS, PROGRAMS, SYSTEMS OR ROUTINES. VANTAGEPOINT’S PERSONNEL ARE NOT LICENSED BROKERS OR ADVISORS AND DO NOT OFFER TRADING ADVICE.


