| This week’s a.i. Stock Spotlight is Eli Lilly ($LLY) |
Eli Lilly and Company is a prominent pharmaceutical company with a rich history dating back to its founding in 1876. This Indiana-based company has made significant contributions to the healthcare industry and has established itself as a leader in the field of pharmaceuticals. Eli Lilly was founded by Colonel Eli Lilly, a pharmaceutical chemist, in Indianapolis, Indiana. The company’s headquarters remains in Indianapolis to this day, where it has become an integral part of the city’s business landscape.
$LLY generates its revenue primarily through the sale of pharmaceutical products. They focus on various therapeutic areas, including diabetes, oncology, immunology, and neuroscience. Over the past few years, they have brought several weight loss products to the market which have created tremendous enthusiasm on Wall Street. The company’s revenue streams are diversified across a range of drugs and treatments.
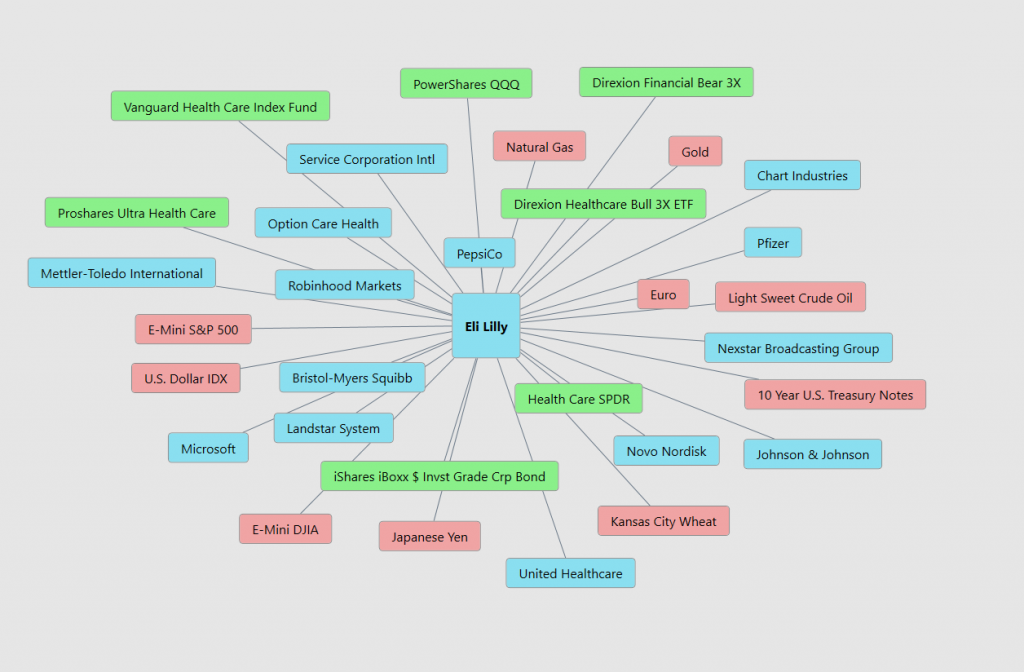
They face competition from other pharmaceutical giants like Bristol Myers Squibb, Johnson & Johnson, Novartis, and Merck. These companies operate in similar therapeutic areas and often vie for market share and innovation in the pharmaceutical industry. $LLY offers a diverse range of pharmaceutical products, including insulin products for diabetes management, oncology drugs like Alimta and Verzenio, and medications for various medical conditions. Their biggest revenue generator historically has been insulin products due to their longstanding presence in the diabetes treatment market, but Wall Street feels that their weight loss products will be generating several billion additional dollars to the bottom line. Eli Lilly offers a diverse range of pharmaceutical products, including insulin products for diabetes management, oncology drugs like Alimta and Verzenio, and medications for various medical conditions. Their biggest revenue generator historically has been insulin products due to their longstanding presence in the diabetes treatment market. Eli Lilly was one of the first companies to mass-produce insulin, revolutionizing diabetes treatment. Recently they introduced weight loss products under the names Zepbound™ (tirzepatide) and Mounjaro. Zepbound™ is FDA-approved for chronic weight management in adults with obesity or overweight
with at least one weight-related comorbid condition. It works by activating GIP (glucose-dependent insulinotropic polypeptide) and GLP-1 (glucagon-like peptide-1) hormone receptors. Mounjaro, also containing tirzepatide, is used for diabetes management but is also recognized for its weight loss potential.
The company played a pivotal role in developing the polio vaccine in the 1950s, and they participated in the development of the first commercially available chemotherapy drug.
Eli Lilly ($LLY) had an extraordinary year in 2023, defying expectations in the pharmaceutical industry. While most pharmaceutical giants are known for steady, reliable profits, Eli Lilly’s stock experienced an astonishing 59% gain in 2023, outperforming the S&P 500 index, which rose by about 25%. Investors are now eager to know if the company can sustain this remarkable ascent. The driving force behind Eli Lilly’s phenomenal success in 2023 was the soaring sales of its diabetes drug, Mounjaro. The Food and Drug Administration (FDA) approved Mounjaro in May 2022 as a groundbreaking treatment for type 2 diabetes. Notably, it’s the first glucagon-like peptide-1 (GLP-1) drug that also activates glucose-dependent insulinotropic polypeptide (GIP) to earn FDA approval. Studies have shown that this unique combination is highly effective in managing weight and blood sugar levels, leading to Mounjaro’s impressive sales of $3.0 billion in just the first nine months of 2023.
But the excitement doesn’t stop there. Eli Lilly’s oncology products, such as Verzenio, have also witnessed substantial growth. Verzenio, approved as an adjuvant treatment to prevent breast cancer recurrence post-surgery, experienced a remarkable 68% year-over-year sales increase in the third quarter, reaching an annualized rate of $4.2 billion.
The game-changer for Eli Lilly, however, is the recent approval of its new weight-management drug, Zepbound. Sharing the same active ingredient as Mounjaro, Zepbound was FDA-approved in November and is already available in U.S. pharmacies for adults with obesity. Forecasts for Zepbound’s revenue potential are promising, with most experts anticipating around $2.2 billion in sales for 2024, and the potential for even greater earnings in the future. With more than two-fifths of Americans living with obesity, the demand for Zepbound is substantial, with expectations of exceeding $25 billion in peak annual sales. Eli Lilly is set to make a significant mark in the lucrative weight-loss market. Market research experts foresee a substantial opportunity, projecting the global weight management market to soar to $300 billion by 2030, up from its current $154 billion valuation. This burgeoning market is experiencing a robust compounded annual growth rate of 9.9%.
Eli Lilly has already made its entry with the FDA-approved Zepbound, which has demonstrated astonishing results in clinical trials, helping individuals shed up to 26.6% of their body weight after 84 weeks. Additionally, the company is diligently working on a once-daily weight-loss pill, orforglipron, currently in phase 3 trials, showing the potential to facilitate a remarkable 15% weight loss after just 36 weeks.
In a strategic move in August 2023, Eli Lilly acquired Versanis for $1.9 billion. This acquisition introduced bimagrumab, another weight-loss drug, to the company’s portfolio. Unlike Eli Lilly’s weight-loss treatments, which function as glucagon-like peptide-1 agonists to induce a sense of fullness, bimagrumab operates by binding to cells, reducing fat mass without affecting appetite.
This acquisition, although modest in size, underscores Eli Lilly’s commitment to the weight-loss market, recognizing its potential not only in aiding weight loss but also in addressing various obesity-related health concerns.
But Eli Lilly’s growth prospects don’t end there. In October, the FDA approved Omvoh, a groundbreaking treatment for ulcerative colitis. The company’s clinical-stage pipeline is also teeming with potential new drugs, including donanemab, a candidate for Alzheimer’s disease, which passed its pivotal trial with flying colors. An FDA approval decision for donanemab is expected in the first quarter of 2024. The company is making strides in early-stage Alzheimer’s treatment with donanemab, which, if approved, could yield billions in additional revenue. Earlier this year, Eli Lilly received approval for Jaypirca, a blood cancer therapy.
With these abundant growth prospects, Eli Lilly is on the cusp of remarkable revenue expansion over the next five years. Coupled with the company’s consistent history of strong profit margins, typically exceeding 20%, it’s highly probable that its bottom line will witness substantial growth during this period.
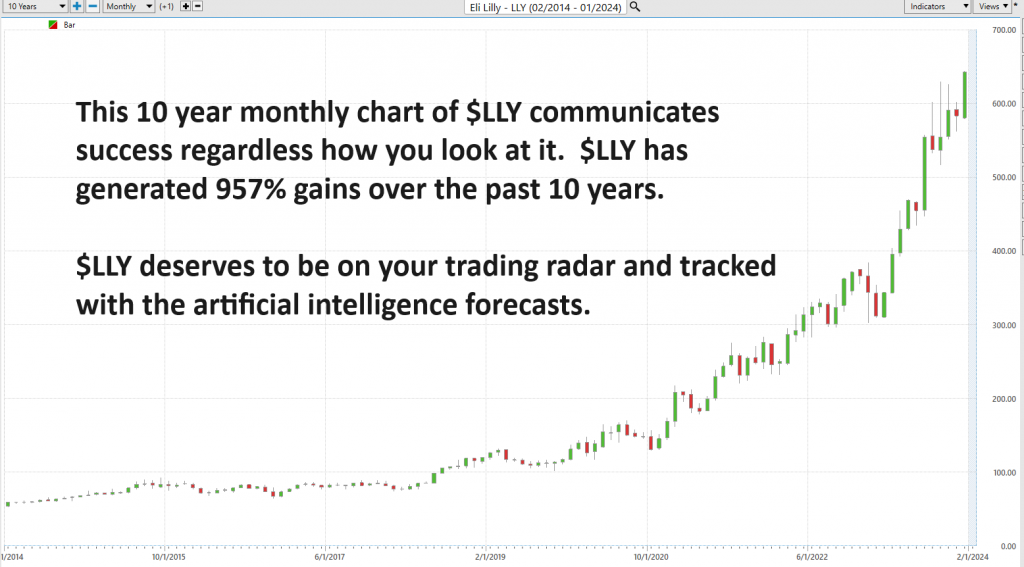
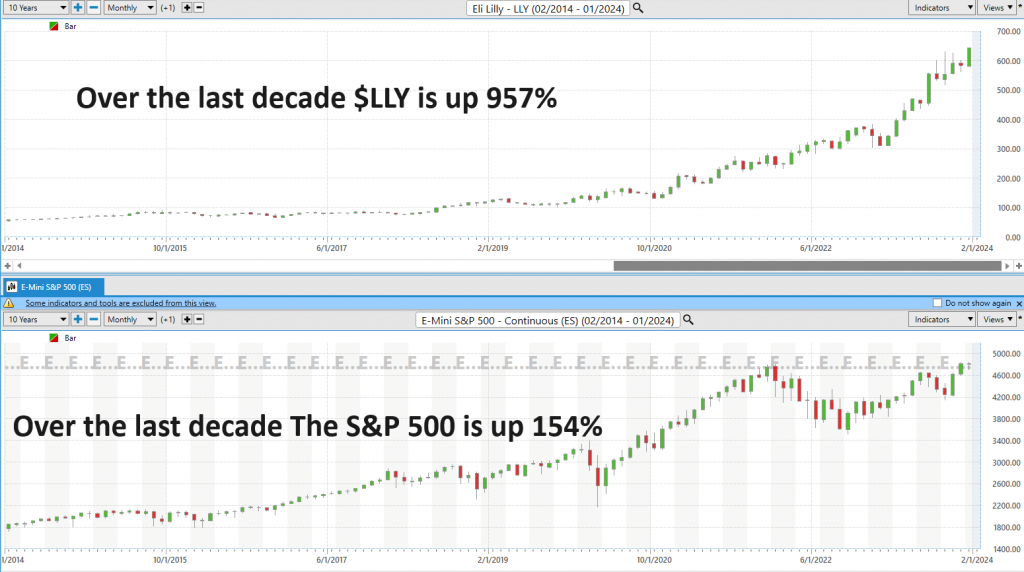
As of today, Eli Lilly boasts a valuation of around $598 billion, and its shares have surged. However, the potential for the company to be even more valuable in five years is palpable. If Eli Lilly fulfills its growth potential without significant setbacks, there’s a compelling possibility that it could become the first healthcare company to reach the illustrious $1 trillion market cap milestone. At this juncture, it’s not a question of if, but rather when, Eli Lilly will achieve this remarkable feat. On the flipside, while Wall Street is bullish on $LLY’s prospects they also feel that its 957% gain over the last decade shows that most of the gains have already occurred.
Investors are understandably optimistic about Eli Lilly’s future, with strong expectations for Zepbound sales and FDA approvals driving the stock higher in 2024. However, it’s crucial to consider the stock’s high valuation, currently trading at 88.6 times the midpoint of management’s earnings expectation for 2023. While there’s potential for Eli Lilly to grow into this valuation with the help of weight-management drugs and Alzheimer’s treatments, there’s also a risk of a downturn in the coming years. For investors with a high-risk tolerance, Eli Lilly presents an intriguing opportunity, but it’s advisable to include it within a diversified portfolio for a well-rounded investment strategy.
The pharmaceutical industry presents both significant opportunities and risks. One major opportunity for Eli Lilly is the potential for breakthroughs in drug development, especially in areas like cancer treatment and immunotherapy. However, the industry also faces risks such as regulatory challenges, patent expirations, and the need for continuous research and development.
In the past decade, Eli Lilly has made several strategic acquisitions to expand its portfolio. Notable acquisitions include the purchase of Loxo Oncology and Dermira, focusing on strengthening their oncology and dermatology offerings.
In conclusion, Eli Lilly ($LLY) is a venerable pharmaceutical company with a rich history, a diverse product portfolio, and a strong presence in the industry. While it faces the challenges typical of the pharmaceutical sector, its commitment to innovation and its legacy of healthcare contributions continue to define its role as a leader in its niche.
In this stock study we will look at the following metrics and indicators.
- Wall Street Analysts’ Estimates
- 52-week high and low boundaries
- Vantagepoint A.I. Triple Cross Forecast
- The Best Case – Worst Case Scenarios
- Neural Network Forecast
- Daily Range Forecast
- Intermarket Analysis
- Our trading suggestion
We don’t base decisions on things like earnings or fundamental cash flow valuations. However, we do look at them to better understand the financial landscape that a company is operating under.
Wall Street Analysts’ Estimates
Based on 20 Wall Street analysts offering 12-month price targets for Eli Lilly & Co in the last 3 months. The average price target is $660.29 with a high forecast of $763.00 and a low forecast of $535.00. The average price target represents a 4.05% change from the last price of $634.57.
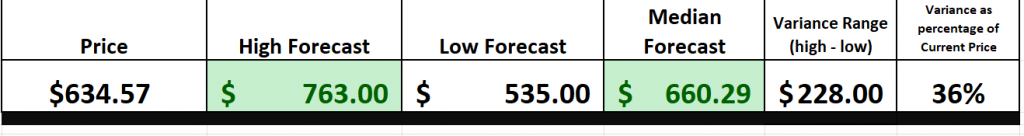
We typically like to look at the variance between the most bullish and bearish forecasts and use that as a gauge for future expected volatility. Currently this variance is 36% or $228.
We find this variance valuable as often rallies and declines are confined to this level of volatility.
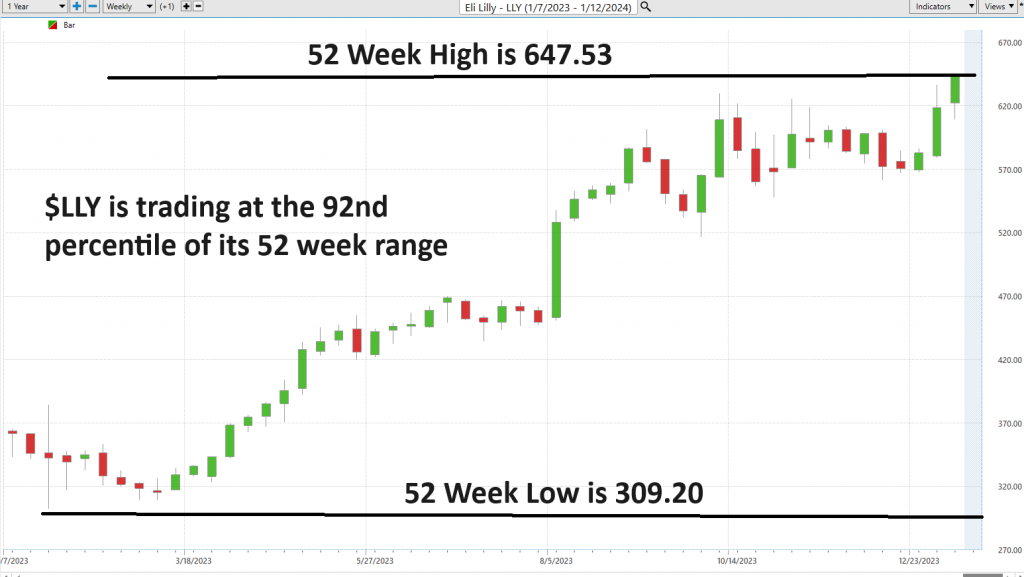
52-Week High and Low Boundaries
Over the past 52 weeks $LLY has traded as high as $647.73 and as low as $309.20. The annual trading range was $338.53. These numbers provide us with an accurate perspective of historic volatility which we can calculate by comparing the annual trading range and comparing that value to the current price Over the last 52 weeks the historic volatility was 53% which is extremely high. This value tells us that based upon the recent past it would be perfectly normal to expect prices to trade 53% higher and or lower over the next 52 weeks.

Let me break it down for you – understanding a stock’s 52-week high and low is crucial in the world of trading and investing. This is like the playbook for the big leagues, and here’s why you should care. First off, these levels give you the inside scoop on a stock’s recent price action. It’s like looking at a horse’s track record before placing your bets at the racetrack. You want to know if that stock has been galloping to new heights or stumbling in the mud.
These levels also have a psychological grip on the market. When a stock breaks through its 52-week high, it’s like a signal flare of confidence, and that can ignite a buying frenzy. On the flip side, when it dives below the 52-week low, it’s like a warning siren, and fear starts to creep in.
Now, here’s where it gets really interesting – these 52-week boundaries can act like your trusty support and resistance levels. Think of them as the floor and ceiling of a trading range. They can help you manage your risks and set those sweet price targets.
But hold on, don’t just stop at the past year! Take a step back and look at the bigger picture. A 10-year chart gives you context, my friends. It helps you separate the short-term noise from the long-term trends. You want to know if that stock is just having a little hiccup or if it’s on a marathon run.
So, in a nutshell, by keeping an eye on these levels and adding that 10-year perspective, you become a savvy trader or investor. You make informed decisions, and you tailor your strategy to the ever-changing market conditions. It’s like having a GPS for the stock market, guiding you to those profitable destinations. So, remember folks, know your 52-week highs and lows, and you’ll be on your way to understanding strength and weakness in the market.
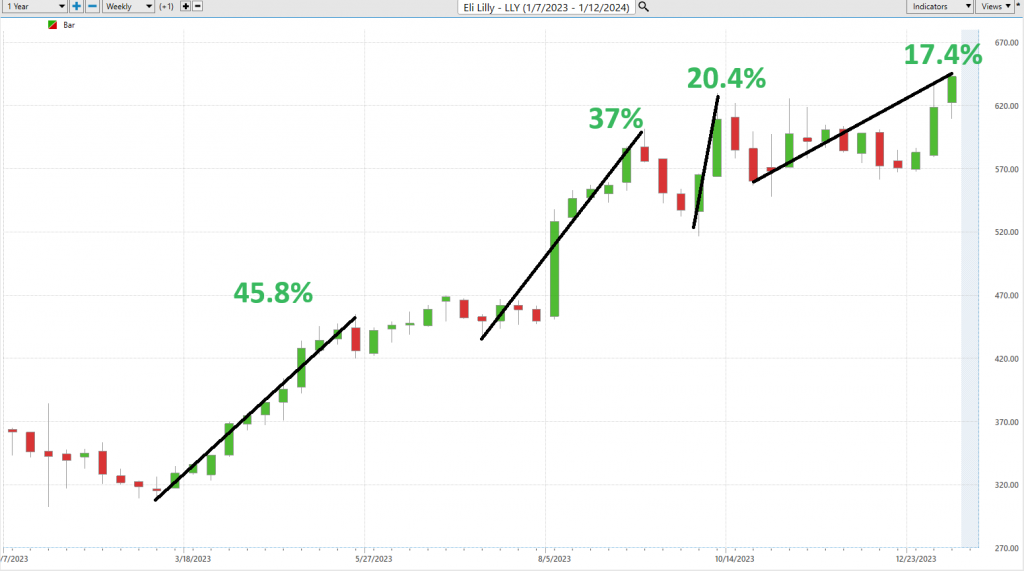
Best Case – Worst Case Scenario
One of the most fundamental principles in trading and investing is understanding the implications of risk versus reward. While there are numerous techniques that can assist with this challenge, the most practical and obvious technique is what we refer to as the best-case/worst-case analysis. What we do here is we assume the best and worst scenarios and measure them on the chart over the past year.
We can quickly accomplish this objective by simply connecting the high points and low points of all rallies and declines. By doing so, we can effectively measure the rallies against the declines.
When it comes to understanding real-world volatility, there’s a simple trick – look at the size of the rallies versus the declines on a chart. It’s like measuring waves in a stormy sea, and it tells you all you need to know about the risk and reward potential.
So, here’s the deal: you’ve got to gauge those rallies against the downturns. It’s like assessing the turbulence in that stormy sea, giving you a clear view of what you’re dealing with – risk and volatility, plain and simple.
Now, this isn’t just some fancy maneuver; it’s a strategic philosophy. By looking at both the good times and the tough times, you get the full picture of a stock’s potential. It’s not just about future gains; it’s about knowing the risks too. This is your compass through market ups and downs, revealing the essence of asset dynamics.
So, don’t just look at charts; understand them. It’s not just tactics; it’s a strategy that empowers you to make informed decisions, manage your exposure, and craft a resilient investment plan that balances risk and reward. And let me tell you, these charts I’m about to show you? They’re your best friends when it comes to defining volatility.
Here is the best-case analysis:
Followed by the worst-case analysis:
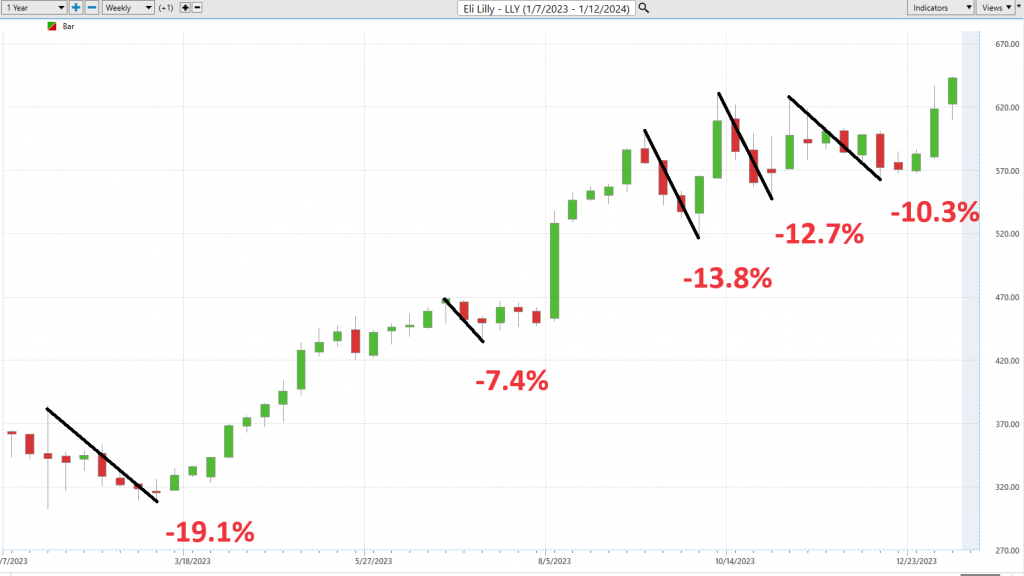
Viewed from this perspective we can immediately see the reward and risk of the past year for $LLY. A winning strategy over the past 52 weeks was using pullbacks of 10% or greater to put $LLY on your radar awaiting guidance from the artificial intelligence forecast.
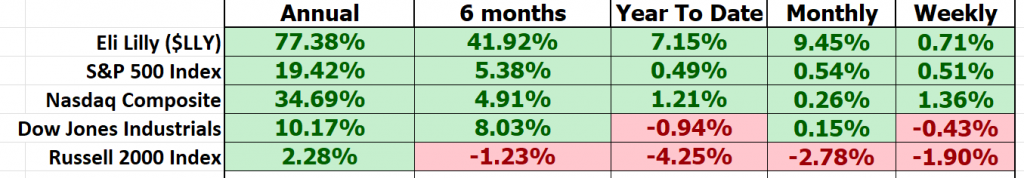
Next, we need to compare $LLY to the broader stock market indices. By doing so we can immediately see that $LLY has massively outperformed the broader market.
Next we often like to drill down to compare $LLY to its largest competitors to evaluate how it has done in its sector.
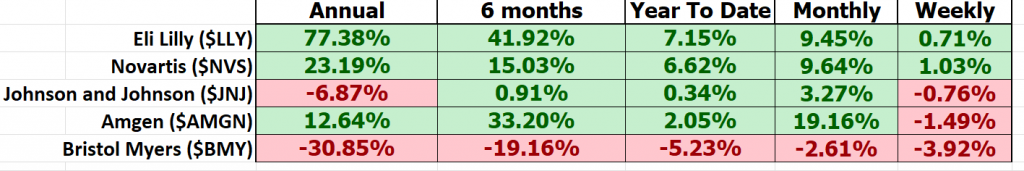
Clearly, $LLY has dominated its sector with its recent performance.
Last but not least we need to compare the volatility of $LLY to the broader market. This is done by looking at BETA. Beta is a measure of a stock’s volatility in relation to the overall market. A beta of 1 indicates the stock tends to move in line with the market, while a beta greater than 1 suggests higher volatility, and a beta less than 1 implies lower volatility compared to the market.
Eli Lilly ($LLY) has consistently outperformed the broader market indices across various time frames, warranting a closer examination of its volatility, particularly in relation to market heavyweights. In the world of finance, this assessment is encapsulated by the metric known as “BETA.” Amidst the complexities of Wall Street, beta (β) emerges as a financial yardstick akin to the Richter scale for stocks. It quantifies a stock’s sensitivity to the broader market’s movements, offering insights into its behavior during market fluctuations, often benchmarked against major indices like the S&P 500.
Eli Lilly ($LLY), over the past 5 years, exhibits a beta of .56, indicating it is 44% less volatile than the broader market. So in $LLY we have a stock which has almost tripled the performance of the S&P 500 with 44% less volatility. That is the type of stock you want to be aware of and have on your trading radar.
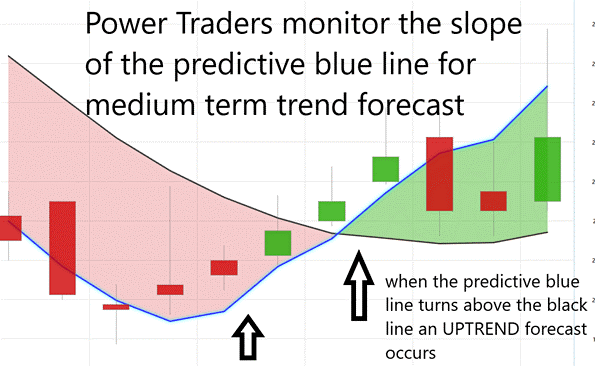
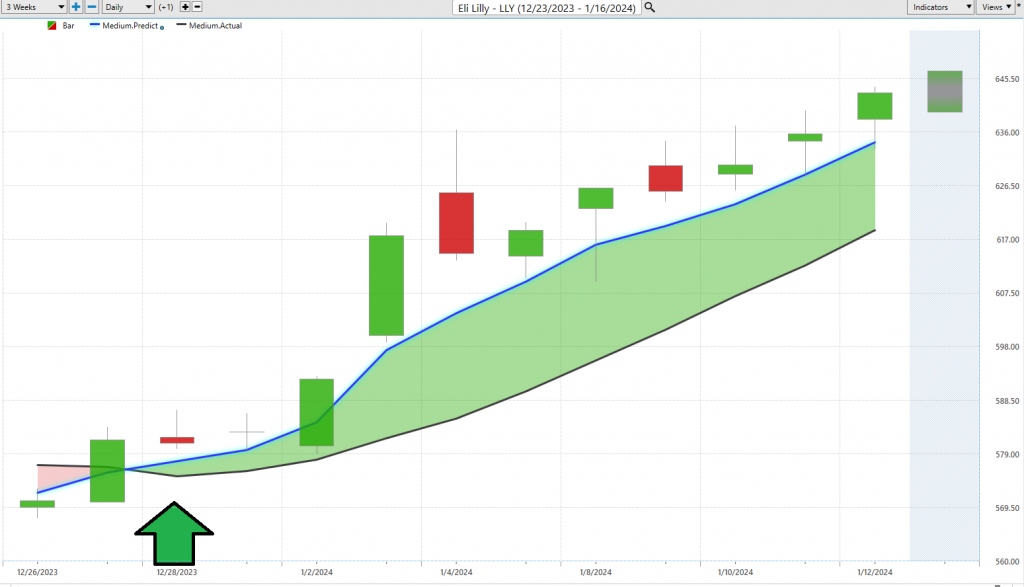
Vantagepoint A.I. Predictive Blue Line Forecast.
In the hustle and bustle of today’s ever-changing market, traders are on a constant quest for the best tools and strategies to navigate this complex financial landscape. Well, folks, I have got something special for you – VantagePoint Software. It is a real pioneer in the world of artificial intelligence, giving traders a precision-focused view of risk and reward.
Now, picture this – the predictive blue line. Think of it as your financial North Star, showing you where the market is headed. When it is going up, it means the market is on the rise, and that’s your signal for smart buying. If it is heading down, well, that’s a sign of a market downturn, and it might be time to consider selling.
But here is the kicker – that predictive blue line also reveals the ‘value zone.’ It’s like a hidden gem for traders. When the line is on the upswing, this zone right below it becomes your focus. It is where price meets intrinsic value, showing you the real worth of an asset.
And let me tell you, this is not some random guesswork. VantagePoint’s A.I. tech is behind it all, using neural networks, machine learning, and intermarket analysis to dig deep into what drives asset prices. It is like peeling back the layers to find the core.
Now, along with that predictive blue line, we have got the black line. It is like our market rearview mirror, tracking the 10-day moving average of prices. It gives you context for what the blue line is showing you. It is all about how these lines work together, giving you a clear view of market momentum and potential opportunities.
Here is the golden nugget for traders – when that predictive blue line crosses over the black line, it’s like a green light in the market. It is telling you it’s time to consider getting in on an upward trend. This is where price and potential value meet, a sign of an undervalued asset ready to climb.
So, as you navigate the market’s twists and turns, keep an eye on that predictive blue line. Understanding how it works with the black line can be your ticket to making informed decisions and finding success in your trading journey. Stay sharp, stay ahead, and let VantagePoint Software be your guide in this dynamic trading world.
Neural Network Indicator (Machine Learning)
Now, let us dive right into the core of this chart – the Neural Network Indicator, a true game-changer in predicting whether the market’s about to flex its muscles or take a breather in the short term. When that Neural Index turns green, it is like a signal saying, ‘Get ready for strength!’ But when it flips to red, it is telling you to ‘brace for short-term weakness.’ And here is the kicker – it’s not just a random guess; this Neural Index is looking ahead 48 to 72 hours. Now, I know you might be wondering, ‘What the heck is a neural network?’ Well, think of it as a computer system taking inspiration from our own brains. It has got these nodes – input nodes, output nodes, and hidden nodes. Input nodes soak up information from the outside world, output nodes send it back out, and those hidden nodes, well, they are
doing some heavy lifting behind the scenes. This thing is learned by adjusting the weights of the connections between these nodes. The stronger the connection, the more sway it has.
But here is where it gets exciting – it is all about translating massive amounts of data into clear predictions. A Neural Network is like a learning machine, always keeping an eye on itself and getting better at the task. Now, when our Power Traders are on the prowl for solid trading setups, they are looking for DOUBLE confirmation. That is when the predictive blue line and the Neural Net both give the green light. See that giant arrow on the chart? It is flashing a sign pointing at that double confirmation setup.
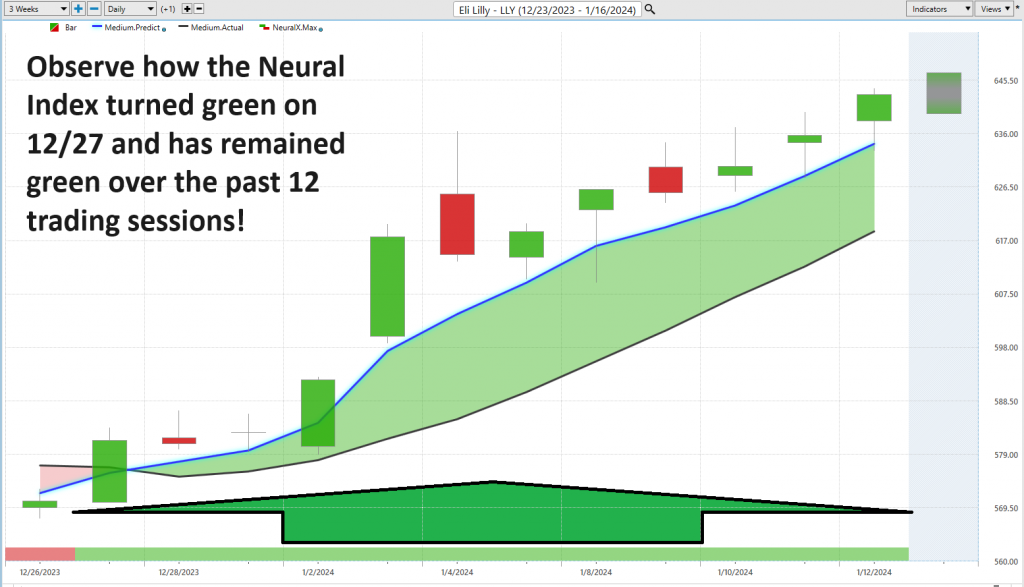
So, why should you care about neural networks? Because they are the secret sauce for traders. They are all about numbers and probabilities, and they can spot patterns that we humans might overlook. They are like that friend who can see a trend change coming from a mile away. So, when we talk about a stock like $LLY, it is about taking that chart, adding the triple cross, and tossing in that neural network indicator. That is how you uncover those golden moments to enter and exit trades.
For all you Power Traders out there, harness the power of neural networks and A.I. to conquer these markets. It is about gaining that edge and making smart decisions on when to pull the trigger. That is the name of the game!
VantagePoint Software Daily Price Range Prediction
We are always on the hunt for that perfect moment to make our move. And to stay ahead of the game, Power Traders, they swear by the Daily Range Forecast.
Now, what is the big deal about this? Well, it is all about getting those entries and exits just right, especially for those traders who thrive in the fast lane, looking for those quick opportunities.
Look at the average trading ranges for $LLY on a daily, weekly, and monthly basis. It is a thermostat of volatility. But these ranges still require us to answer the question: where are the ideal entry and exit points?

Focus your attention on the Daily Range Forecast chart. This right here is your guide to what short-term swing traders can expect every trading day.
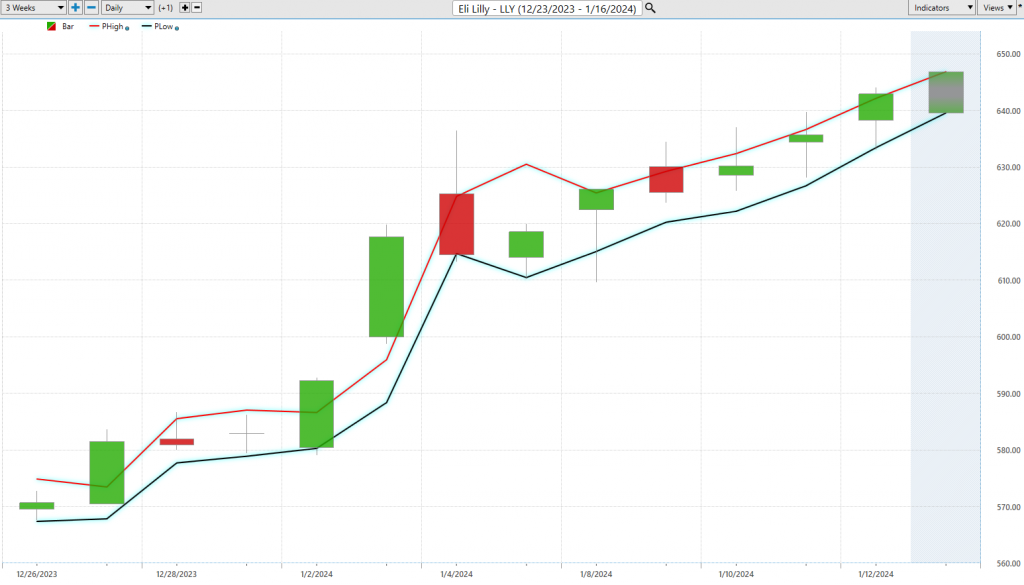
In the high-speed world of trading, precision is king. And that’s where Vantagepoint A.I.’s Daily Range Forecast steps up to the plate. It has got the power of AI, machine learning, and neural networks, serving up a daily forecast for each trading session. Think of it as your GPS in the market, helping Power Traders strategically ride those trends, nail those entries, and time those exits just right.
Intermarket Analysis
Intermarket analysis is like when you are trying to figure out how different things are connected.
Imagine you are at the beach, and you throw a pebble into the water. That pebble makes ripples, right? Those ripples can affect the sand, the shells, and even the waves. That is how things work in the financial world – what happens in one market can affect others.
Now, here is where it gets interesting. Vantagepoint Software is doing something cool with this. They are not just looking at charts; they’re digging deep into how all these markets are connected. They are finding out which things tend to move together, and that can tell us a lot about where prices might go.
See, it is not just about one market. It is about how stocks, bonds, commodities, and currencies all dance together, and how that can steer the big market ship. For example, if interest rates go up, it can make people like bonds more than stocks, which might cause the stock market to drop.
Now, some smart folks like John Murphy and Lou Mendelsohn have been big fans of this approach. They have written books about it. They’re telling us that markets are like a big web, where everything is connected.
For traders, this is like having a wide-angle lens instead of tunnel vision. It helps us make better predictions and understand what is happening in the market. Plus, it is great for managing risks. If one thing is going down, you can invest in something else that is going up.
But remember, it is not the only tool in the toolbox. We should use it along with other ways of looking at the market.
In today’s world, everything is linked, just like those ripples in the water. To be successful, traders need to figure out what’s driving prices, even if it is not obvious. And that’s where Intermarket analysis comes in handy.
So, when you’re looking at a stock like $LLY, dive into the intermarket analysis, and you might uncover some hidden clues for your trading journey. It is like being a detective in the financial world!
Our Suggestion
In conclusion, it’s crystal clear that Eli Lilly and Company ($LLY) is a stock that deserves your attention. Over the past decade, this pharmaceutical giant has proven its mettle by delivering an impressive 957% return on investment. Now, let’s put that into perspective – while the broader market, represented by the S&P 500, has seen a respectable 154% gain during the same period, $LLY has outshone it by a wide margin.
But what makes $LLY truly intriguing is its low BETA of 0.56. What does that mean? Well, it’s like this stock has its own set of rules. It’s less influenced by the wild swings of the market compared to most other stocks. In simple terms, it’s a steadier ship in a sometimes turbulent sea.
So, if you’re looking for a stock that offers the potential for substantial returns while also providing a measure of stability, Eli Lilly and Company ($LLY) should unquestionably be on your trading radar. It’s a shining example of how a well-established company can continue to deliver growth and reward investors over the long haul. Keep a close eye on $LLY; it may just be the prescription for your portfolio’s success.
Caution is urged in investing or trading $LLY as it is trading at roughly 115 times managements earnings expectations for 2024. The next earnings release for $LLY is February 6, 2024.
We advise that you practice good money management on all of your trades and that you follow the A.I. forecast for your trend anaysis to determine optimal entries and exits.
Let’s Be Careful Out There!
Remember, It’s Not Magic.
It’s Machine Learning.
Disclaimer: THERE IS A HIGH DEGREE OF RISK INVOLVED IN TRADING. IT IS NOT PRUDENT OR ADVISABLE TO MAKE TRADING DECISIONS THAT ARE BEYOND YOUR FINANCIAL MEANS OR INVOLVE TRADING CAPITAL THAT YOU ARE NOT WILLING AND CAPABLE OF LOSING.
VANTAGEPOINT’S MARKETING CAMPAIGNS, OF ANY KIND, DO NOT CONSTITUTE TRADING ADVICE OR AN ENDORSEMENT OR RECOMMENDATION BY VANTAGEPOINT AI OR ANY ASSOCIATED AFFILIATES OF ANY TRADING METHODS, PROGRAMS, SYSTEMS OR ROUTINES. VANTAGEPOINT’S PERSONNEL ARE NOT LICENSED BROKERS OR ADVISORS AND DO NOT OFFER TRADING ADVICE.