


| This week’s a.i. Stock Spotlight is Super Micro Computer ($SMCI) |
Super Micro Computer, Inc. (ticker: $SMCI) represents a fascinating narrative in the realm of technology and retail stock analysis. Founded in 1993 by Charles Liang, Wally Liaw, and Sara Liu, this San Jose, California-headquartered company has carved out a notable niche in the IT sector, particularly in designing, developing, manufacturing, and selling server solutions based on modular and standardized computing architecture. This innovative approach has allowed Super Micro Computer to establish itself as a significant player in the high-performance, high-efficiency server technology market.
The company’s revenue model is intricately woven through the sale of these server solutions, including servers, storage systems, and other related products that cater to a wide range of market segments including data centers, cloud computing, enterprise IT, big data, high-performance computing (HPC), and embedded markets. Super Micro Computer’s ability to provide customers with a high degree of flexibility and customization has been a key revenue driver, allowing it to cater to specific client needs while maintaining high efficiency and performance standards.
Super Micro Computer operates through various profit centers within its organization. These include the design and manufacturing of server and storage systems, networking solutions, and the development of software solutions that complement its hardware offerings. While the company has not publicly detailed the exact number of profit centers, its diversified product range and services act as multiple streams of revenue.
$SMCI employs 5,000 people globally.
Since its inception, Super Micro Computer quickly made a name for itself in the server technology domain, achieving profitability within a few years post-foundation. This rapid ascent to profitability underscored the company’s strong product-market fit and the burgeoning demand for high-performance computing solutions.
Regarding financial health, Super Micro Computer’s debt level is a critical factor for investors and analysts alike. Like many technology companies, it has leveraged financing to fuel growth, investment in research and development, and expansion into new markets.
San Jose, California, not only serves as the headquarters of Super Micro Computer but also as a strategic location in the heart of Silicon Valley, offering proximity to a vibrant ecosystem of technology innovation, talent, and entrepreneurship. This geographical advantage has facilitated Super Micro Computer’s access to cutting-edge research, skilled workforce, and a synergistic network of partners and suppliers.
In the competitive landscape, Super Micro Computer faces stiff competition from both established giants and nimble startups in the server and data center solutions market. Key competitors include Dell Technologies, Hewlett Packard Enterprise (HPE), and Lenovo, among others. These companies compete on technology innovation, performance, reliability, and price, making the market highly dynamic and competitive.
The biggest opportunity for Super Micro Computer lies in the ever-increasing demand for data processing and storage, driven by trends such as cloud computing, big data, artificial intelligence (A.I.), and the Internet of Things (IoT). The company’s commitment to high-efficiency, eco-friendly server solutions positions it well to capitalize on this trend. However, this opportunity comes with risks, including intense competition, the rapid pace of technological change, and the potential for supply chain disruptions.
Super Micro Computer’s product lineup is extensive, focusing on server technology, including blade servers, rackmount servers, and storage solutions. Its biggest revenue generator has historically been its server solutions, which are renowned for their performance, efficiency, and customization options.
In terms of acquisitions, Super Micro Computer has been strategic, focusing on acquisitions that bolster its technology stack, expand its product offerings, or enhance its market position. The specifics of these acquisitions over the last decade would be detailed in the company’s financial reports and press releases, showcasing its growth strategy through both organic and inorganic means.
Wall Street analysts have had varying views on Super Micro Computer, with assessments often depending on the company’s financial performance, market trends, and competitive positioning. Traditionally, the company has been viewed as a solid performer within its niche, noted for its innovation, financial stability, and strategic positioning in a competitive landscape.
Over the past five years, $SMCI has demonstrated a trajectory of consistent growth and resilience. Starting in 2019 with a revenue of $2.5 billion, the company embarked on a path of progressive enhancement. By 2020, revenue escalated to $3.3 billion. This momentum continued through 2021, with revenue reaching $3.5 billion. The years 2022 and 2023 witnessed further expansion, culminating in revenues of $5.1 billion and $7.1 billion showcasing sustained growth.
For its Q2 FY2024, Super Micro Computer reported a substantial increase in earnings. The company saw its net sales surge to $3.66 billion from $2.12 billion in the previous quarter and $1.80 billion year-over-year. Net income grew to $296 million, up from $157 million in Q1 FY2024 and $176 million year-over-year. Earnings per share (EPS) increased to $5.10, from $2.75 in Q1 FY2024 and $3.14 in the same quarter last year.
The reported EPS for the quarter was $5.59, surpassing the consensus estimate of $4.94 by $0.65. This performance indicates significant year-over-year growth, with quarterly revenue up 103% compared to the same quarter last year.
The company is actively working on capturing the current A.I. growth opportunity by accelerating the development of new A.I.-optimized platforms. Significant developments include launching and delivering end-to-end Liquid-Cooled Data Center Solutions, expecting up to 20% of data center deployments to move to liquid cooling. Super Micro is also introducing innovative solutions like the NVIDIA CG1, CG2 Grace Hopper Superchip, and NVIDIA Grace CPU Superchip, aiming to address the power consumption and thermal challenges of new A.I. technologies.
Super Micro’s aggressive growth strategy, including expanding its product lineup and strategic focus on A.I. and data center solutions, suggests a strong alignment with the overall technology sector’s upward trend.
In a dramatic turn of events on March 19th, after the market close, shares of Super Micro Computer took a nosedive. The plummet follows a Tuesday tumble, where Super Micro’s stock valuation felt gravity after the initial disclosure of an additional 2 million impending stock shares sale. $SMCI disclosed their ambitious plans to release an additional 2 million shares thereby diluting shareholders, boosting its total share count to a staggering 58.5 million. The tech giant set the price for these new shares at a hefty $875 each.
Super Micro is looking to rake in a colossal $1.75 billion in gross proceeds from this offering, before accounting for the costs of underwriting discounts, commissions, and other related expenses.
The funds amassed from this offering are earmarked for a variety of operational enhancements. Among these are the procurement of inventory, bolstering working capital reserves, expanding manufacturing capacities, and fueling the fires of research and development endeavors.
Shareholder dilution is often a major concern for analysts and traders because shareholders ownership is minimized through this practice. Dilution affords companies an alternative to more expensive means of financing. It is like the company has a printing press and its currency is additional shares of stock.
Imagine you have a pizza divided into 10 slices, and you and your friends are going to share it. If you have 4 friends, each of you gets 2 slices, right? Now, imagine if 2 more friends join your group. To include them, you have to divide the same pizza into more slices, so now everyone gets fewer slices than before. This is like shareholder dilution. When a company issues more shares (like adding more friends to share the pizza), each existing share represents a smaller piece of the company. So, if the company makes money, the profit each share gets is less because it has to be shared among more shares.
Investors get concerned about dilution because their shares often become less valuable. If they owned 1% of the company before new shares were issued, they might own less than 1% after, without selling any shares. This means their vote on company decisions becomes weaker.
This financial synopsis reveals Super Micro Computer’s adeptness in navigating the competitive and ever-evolving tech landscape, underscored by a strategic blend of innovation, market adaptation, and customer-centric solutions.
Wall Street analysts believe that earnings are forecasted to grow by 33.9% per year moving forward.
Super Micro Computer has been a pioneer in green computing, emphasizing energy-efficient server technologies long before it became a mainstream concern. From its humble beginnings in a small Silicon Valley garage, Super Micro Computer has evolved into a global leader in high-performance, high-efficiency server technology. The company’s unique selling proposition lies in its ability to offer highly customized server solutions, catering to specific customer needs without compromising on performance. Super Micro Computer recognized the potential of edge computing early on, investing in solutions that bring data processing closer to the source of data generation. A significant portion of its revenue is reinvested into R&D, underlining the company’s commitment to innovation and technological advancement. The company’s growth strategy includes strategic acquisitions that enhance its technology offerings and market position, though it carefully selects these opportunities to align with its core values and objectives.
These facets of Super Micro Computer weave together a narrative of innovation, sustainability, and strategic growth, distinguishing it in the competitive landscape of server technology and beyond. As a company deeply embedded in the tech industry’s evolution, Super Micro Computer continues to navigate the future with a clear vision, solid financial grounding, and an unwavering commitment to serving the ever-expanding needs of the digital world.
In this stock study we will look at the following metrics and indicators.
- Wall Street Analysts’ Estimates
- 52-week high and low boundaries
- Vantagepoint A.I. Predictive Blue Line
- The Best Case – Worst Case Scenarios
- Neural Network Forecast
- Daily Range Forecast
- Intermarket Analysis
- Our trading suggestion
We don’t base decisions on things like earnings or fundamental cash flow valuations. However, we do look at them to better understand the financial landscape that a company is operating under.
Wall Street Analysts’ Estimates
Based on 19 Wall Street analysts offering 12-month price targets for Super Micro Computer in the last 3 months. The average price target is $819.09 with a high forecast of $1350 and a low forecast of $250. The average price target was $819.09.
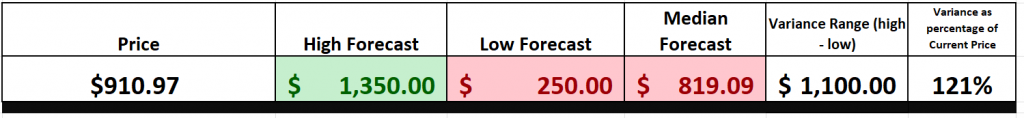
We typically like to look at the variance between the most bullish and bearish forecasts and use that as a gauge for future expected volatility. Currently this variance is 121% or $1,00. This represents the difference between the most bullish and most bearish forecasts and is considered to be exceptionally high.
We find this variance valuable as often rallies and declines are confined to this level of volatility.
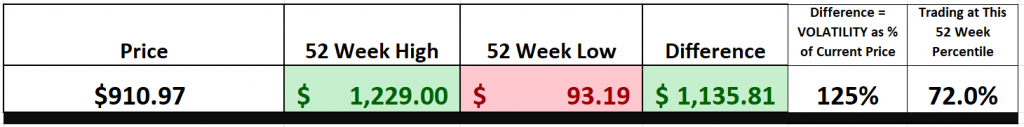
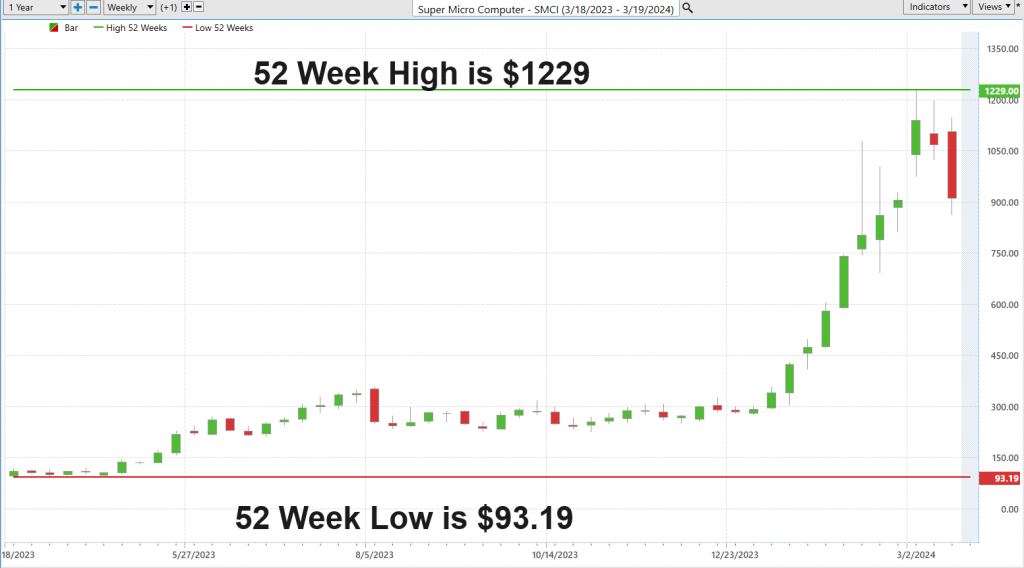
52-Week High and Low Boundaries
Over the past 52 weeks $SMCI has traded as high as $1229 and as low as $93.19. The annual trading range was $1135.81. These numbers provide us with an accurate perspective of historic volatility which we can calculate by comparing the annual trading range and comparing that value to the current price. Over the last 52 weeks the historic volatility was 125%, which is exceptionally high.
Also, $SMCI is currently trading at the 72nd percentile of its last 52-week range.
Traders and investors often monitor the 52-week high and low boundaries of a stock for several reasons, as these metrics can provide valuable insights into the stock’s performance, market sentiment, and potential investment strategies.
The 52-week high and low serve as significant psychological benchmarks for traders and investors, influencing decision-making. A stock approaching its 52-week high might be seen as strong and in a potential uptrend, whereas a stock nearing its 52-week low could be viewed as weak or undervalued. These boundaries offer a snapshot of a stock’s performance over a relatively long period, helping to assess its volatility, stability, and trend direction.
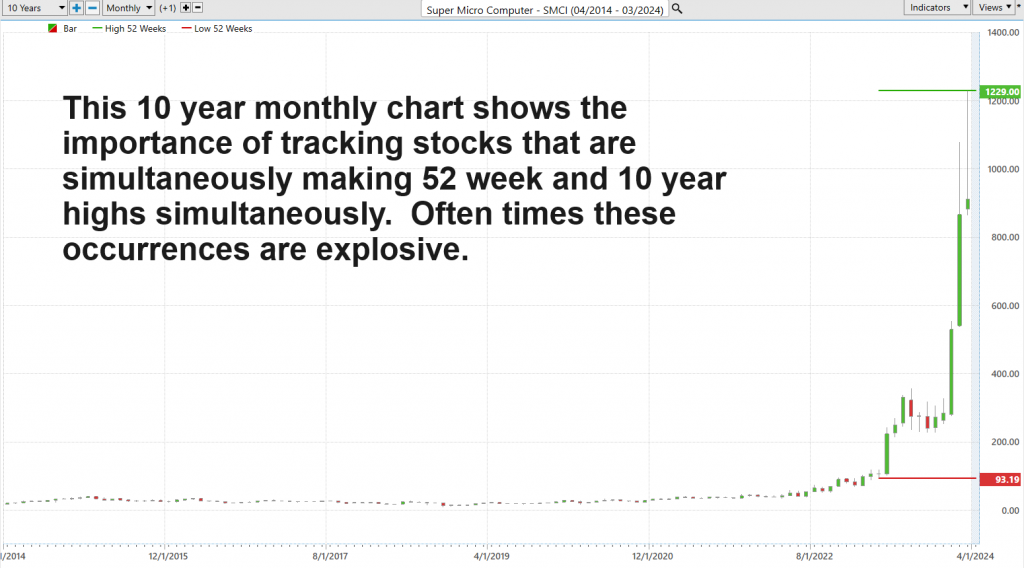
Stocks trading near their 52-week highs are often perceived positively, with strong investor sentiment, suggesting the stock is performing well and might continue to do so. Conversely, stocks near their 52-week lows might indicate negative sentiment, potentially signaling a lack of confidence from investors. For momentum traders, a stock breaking past its 52-week high can indicate strong momentum and the possibility of continuing to climb, as breaking past a historical resistance level can lead to increased buying interest. As a matter of fact, one of our all-time favorite trading setups is to find stocks that are simultaneously trading at 52-week highs as well as 10-year highs. Often times these stocks are the most explosive as they are demonstrating that they are overcoming all obstacles related to their growth. $SMCI certainly has met these requirements over the last few months.
Yet, we mustn’t fall into the trap of shortsightedness. The astute trader/investor casts their gaze beyond what recently occurred, to the vast expanse of a decade’s landscape. It’s this wide-lens approach that allows understanding of the long-term trends to emerge.
Make no mistake, understanding these yearly markers isn’t merely advantageous; it’s paramount for those aspiring to leave their footprint in the corridors of trading excellence. Consider this knowledge your indispensable manual for navigating the major league of finance. Why so? Because tracking these metrics places you in the front row, witnessing firsthand the unfolding saga of a stock’s annual journey.
When a stock vaults over its 52-week summit, it’s as though it’s shooting a beacon of confidence sky-high, igniting a frenzy among purchasers. On the flip side, a descent below its 52-week nadir rings the tocsin of caution, heralding potential storms on the horizon.
And here’s the crux of the matter—these 52-week landmarks transcend mere digits; they’re the market’s own lexicon of psychological waypoints, offering both a bastion against risk and a lodestar for establishing those pivotal price targets. But don’t just draw the line there. Extend your vision. A peek into the decade-long trajectory can illuminate the difference between knee-jerk reactions to minor fluctuations and the discernment of genuine market evolution. It’s about winnowing the transient from the lasting, deciding if you’re confronting a brief stumble or a marathon contender.
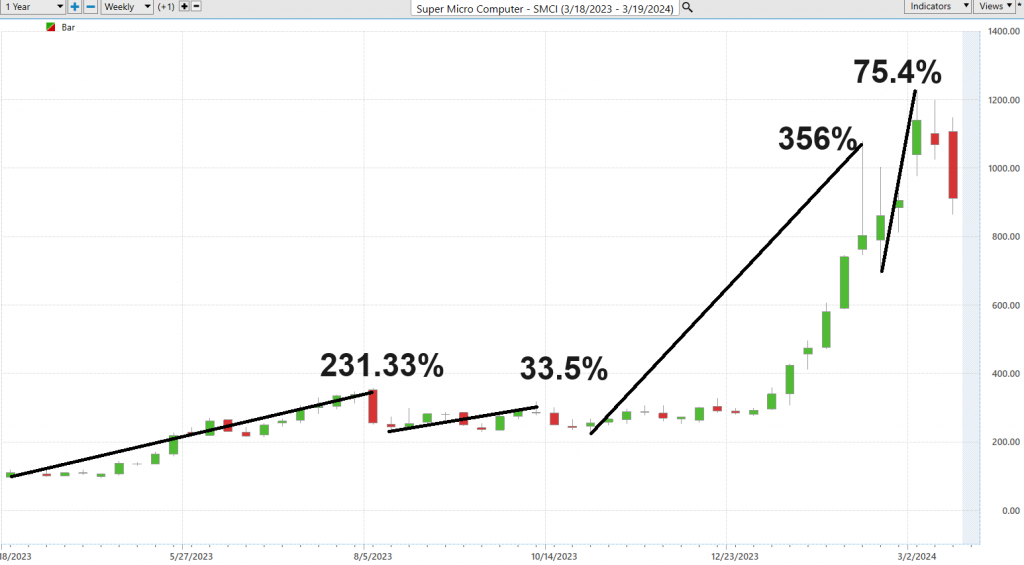
Best Case – Worst Case Analysis
In the world of trading and investing, one of the cornerstone concepts is balancing the scales of risk and reward. Now, there’s a whole arsenal of strategies out there to tackle this, but sometimes, the most straightforward approach hits the nail on the head. I’m talking about what’s known in the trenches as the best-case/worst-case analysis. It’s essentially where we play out the optimist and the pessimist, laying out the scenarios side by side, looking back over the last year on the charts.
All it takes is a bit of chart magic, connecting the dots between the peaks of prosperity and the valleys of decline. This method lets us weigh the periods of growth against the setbacks.
Now, if you want to get a bead on market volatility, there’s a nifty little technique – juxtapose the size of those climbs with the falls on a chart. It’s akin to sizing up the swells in a tempest-tossed ocean, giving you the skinny on the potential risks and rewards lurking.
So, here’s the skinny: sizing up those highs against the lows isn’t just an exercise; it’s about reading the tea leaves of market turbulence. It provides an accurate perspective on the risks and the volatility you’re signing up for – no frills attached.
But let’s not kid ourselves into thinking this is merely some highfalutin theory; it’s a tactical roadmap. By casting an eye over both the triumphs and trials, you snatch a glimpse of a stock’s full spectrum of possibilities. It’s not solely about banking on the gains; it’s about bracing for what’s at stake. This approach steers you through the market’s ebbs and flows, shedding light on the core dynamics of your trade.
So, when you’re poring over those charts, it’s not just about playing the numbers game; it’s about crafting a strategy that arms you with the knowledge to navigate, adjust your sails, and devise an investment strategy that skillfully mediates between risk and reward. And believe me when I say, the charts I’m going to walk you through? They’re not just illustrations; they’re your navigational stars in charting the course of volatility.
First off, here is the best-case analysis:
Followed by the worst-case analysis:
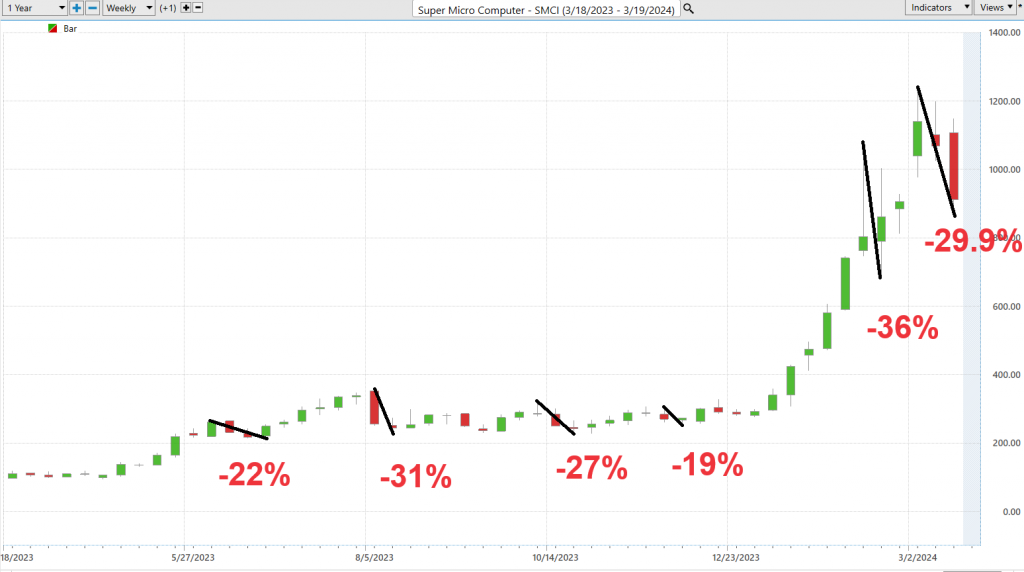
Clearly the bulls are in control. What is fascinating to ponder is the magntiude of these moves. When trading something as volatie as $SMCI position sizing is critical. Also learning to take profits off the table when the market moves in your direction is paramount.
Clearly the bulls are in control. What is fascinating to ponder is the magntiude of these moves. When trading something as volatie as $SMCI position sizing is critical. Also learning to take profits off the table when the market moves in your direction is paramount.
Next we compare $SMCI to the major broader market indexes.
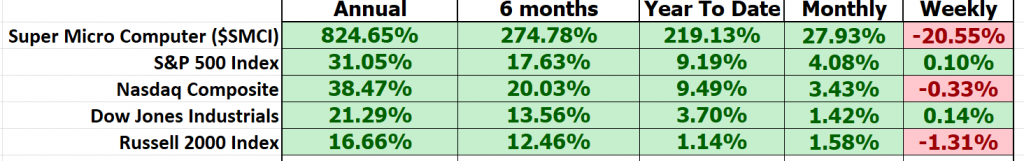
You can see that over the longer term time frames $SMCI has massively outperformed all of the market indexes. However, to provide context and better understand the volatility simply examine the weekly values and you need to comprehend that over the past 5 sessions $SMCI is down a whopping 20.55%! This loss is because the company is issuing 2 million more shares and the initial response to this announcement was massive selling.
I want to stress that position sizing is crucial when trading $SMCI because the volatility is so massive.
Last but not least we need to compare the volatility of $SMCI to the broader market. This is done by looking at BETA. Beta is a measure of a stock’s volatility in relation to the overall market. A beta of 1 indicates the stock tends to move in line with the market, while a beta greater than 1 suggests higher volatility, and a beta less than 1 implies lower volatility compared to the market. Super MicroComputer ($SMCI), over the past 5 years, exhibits a beta of 1.27, indicating it is 27% more volatile than the broader market. So in $SMCI we have a stock which has massively outperformedthe broader market with 27% more volatility and risk
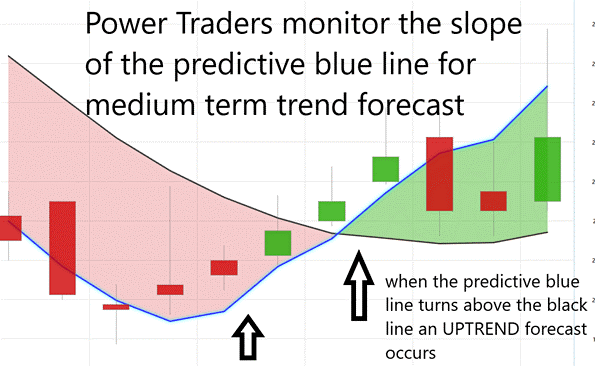
Vantagepoint A.I. Predictive Blue Line Forecast.
One of the huge challenges for traders is correctly anticipating where the market is going. There are hundreds of technical tools that do an excellent job of telling you what the market has done in the recent past. It is an entirely different issue to know where the market is heading. This is the power of artificial intelligence, neural networks, and machine learning.
Here is the predictive blue line, akin to a financial North Star, illuminating the path ahead. When this line ascends, it heralds a market on the rise, a beacon for astute investments. Should it decline, it whispers of a forthcoming downturn, advising a timely retreat.
But the tale of the blue line is one of profound insight, not mere foresight. It reveals the ‘value zone,’ a sanctuary where price and intrinsic value dance in harmony, unveiling the true essence of an asset on that given day and moment.
This indicator is the fruit of VantagePoint’s ingenious A.I. framework, a symphony of neural networks, machine learning, and intermarket analysis. Together, they peel away the market’s layers, exposing the heartbeat within.
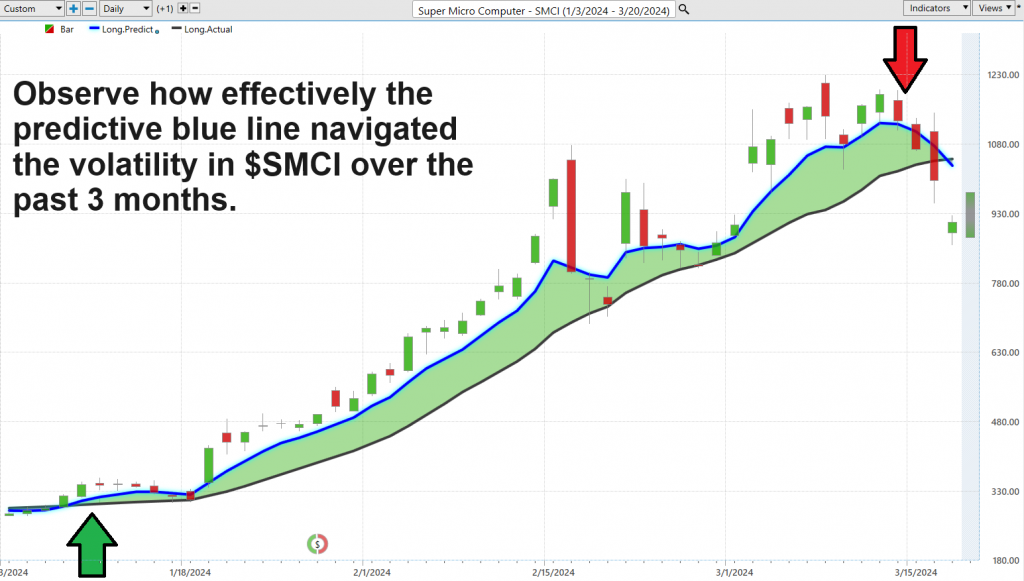
Enter the black line, a chronicle of the past ten days’ average prices, a shadow of history that enriches the story told by the blue. This partnership between past and prediction crafts a narrative of momentum and opportunity, with the blue line’s ascent over the black heralding a chapter of growth, a signal of undervalued assets ripe for discovery.
As we navigate the market’s volatility, the dialogue between the blue and black lines becomes our compass. It arms us with the clarity to make decisions that are not just informed but enlightened, paving the way for triumph in the arena of trade. With eyes wide and minds sharp, let the wisdom of VantagePoint Software be your guide on this journey through the ever-evolving world of trading.
Neural Network Indicator (Machine Learning)
The term “neural network” has transcended buzzword status to become a cornerstone of sophisticated market prediction techniques. Rooted in the structure and function of the human brain, a neural network in the computational realm is a complex assembly of nodes, or “neurons,” organized into layers: input, hidden, and output. These layers work in concert to process and interpret data, with the hidden layers performing the heavy lifting—analyzing patterns and relationships in the data that might not be immediately obvious.
Construction of a neural network involves initializing it with a random set of weights, which are then continuously adjusted and tested. This adjustment process is based on the network’s performance in making predictions versus known outcomes, effectively enabling the network to learn from its mistakes and enhance its predictive accuracy over time.
For traders, the application of neural networks can dramatically refine decision-making processes. By digesting vast arrays of market data and identifying underlying patterns, these digital brains offer predictions on market directions, effectively transforming raw data into actionable trading insights. This is not merely a matter of augmenting traditional analysis; it’s about leveraging the depth and speed of A.I. to capture nuances and trends that might elude human analysts, thereby offering a quantitative edge in a highly competitive arena.
The Neural Network Indicator is essential for forecasting stock market movements in the near term, providing traders with insights on potential rallies or downturns. A shift in the indicator to green signifies a bullish outlook, suggesting an impending rally. Conversely, a red shift warns of a potential short-term decline. The Neural Index, a component of this indicator, offers forecasts 48 to 72 hours in advance, granting traders a valuable window to strategize their moves.
The intrigue of neural networks lies not only in their ability to emulate the human brain’s processing capabilities but also in their proficiency in distilling complex datasets into precise, actionable trading insights. This predictive capability, constantly honed through learning and adaptation, offers traders a means to identify high-probability trading signals. Particularly compelling is when neural network predictions converge with other indicators, such as the predictive blue line, highlighting optimal entry or exit points marked by a clear chart arrow for double confirmation.
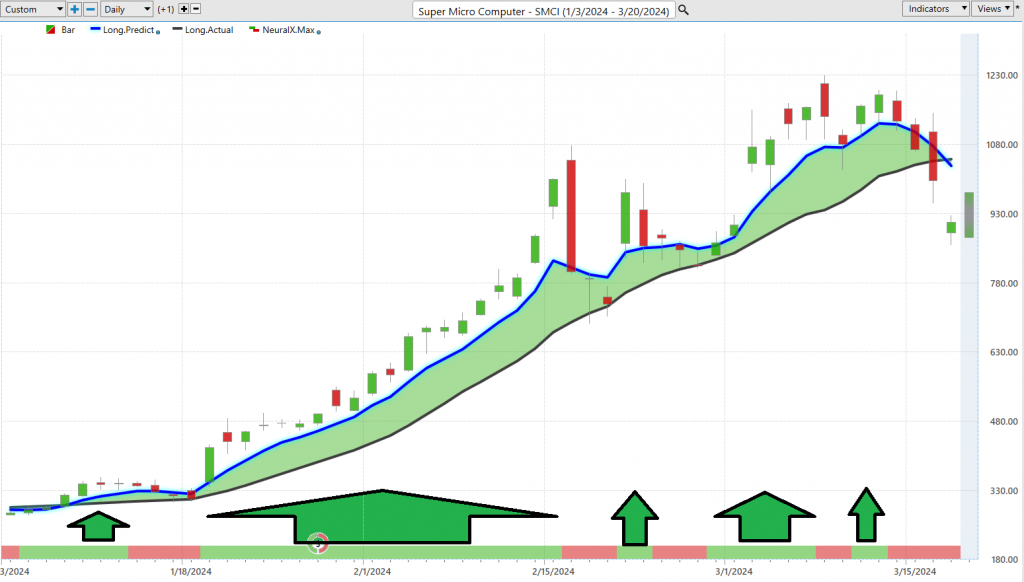
The arrows on the chart above are all the times when the neural index and the predictive blue line were both forecasting the same trend. We refer to this as the double confirmation setup which is a high probability trade.
As we stand at the intersection of cutting-edge technology and financial trading, the message is clear: incorporating neural networks and A.I. into the analytical toolkit is not just beneficial—it’s imperative for those seeking to thrive in the dynamic landscape of modern trading. This approach doesn’t just elevate the analytical process; it redefines it, ensuring traders are well-equipped to capitalize on fleeting market opportunities, marking the essence of success in today’s trading world.
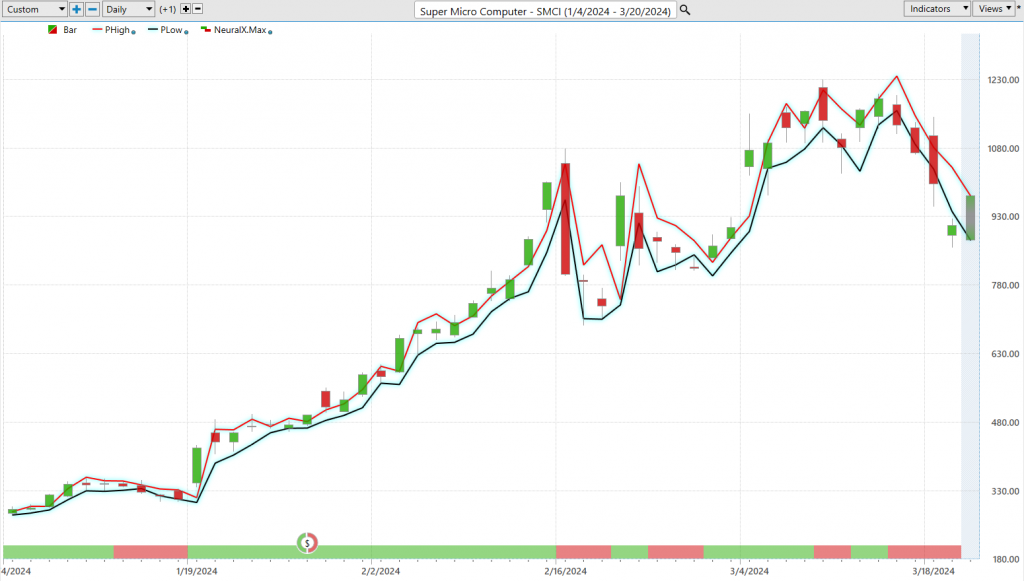
VantagePoint Software Daily Price Range Prediction
Every day, traders grapple with the decision of where to get in and out of the market.
In the relentless quest for better trading, Power Traders turn to an indispensable tool: the VantagePoint A.I. Daily Range Forecast. This isn’t just another tool in the arsenal; it’s a cornerstone of strategy, particularly for those who thrive on the adrenaline of fast-paced swing trading, constantly seeking swift, strategic, and immediate opportunities.
To appreciate the power of this tool let’s look at the average trading ranges of $SMCI over the past year.

These trading ranges show you the level of volatility that exists in $SMCI. These values spell massive risk to the uneducated and huge opportunity to those who have learned to harness volatility correctly.
These numbers, my friends, they’re not just digits on a screen; they are the very heartbeat of the market’s swings and roundabouts, a vital sign for any trader worth their salt. And here’s the million-dollar question we’re all grappling with: how do we zero in on those golden moments to jump in and step out of this whirlwind?
Enter the stage, the VantagePoint A.I. Daily Range Forecast chart. Think of it as your crystal ball for the trading day, offering up a play-by-play of what’s to come, all thanks to the wizardry of AI and machine learning. This isn’t just any old chart; it’s a beacon in the chaos, showing you the lay of the land with the kind of clarity only cutting-edge tech can deliver.
Observe how clearly the range and trend are clearly delineated each and every trading day.
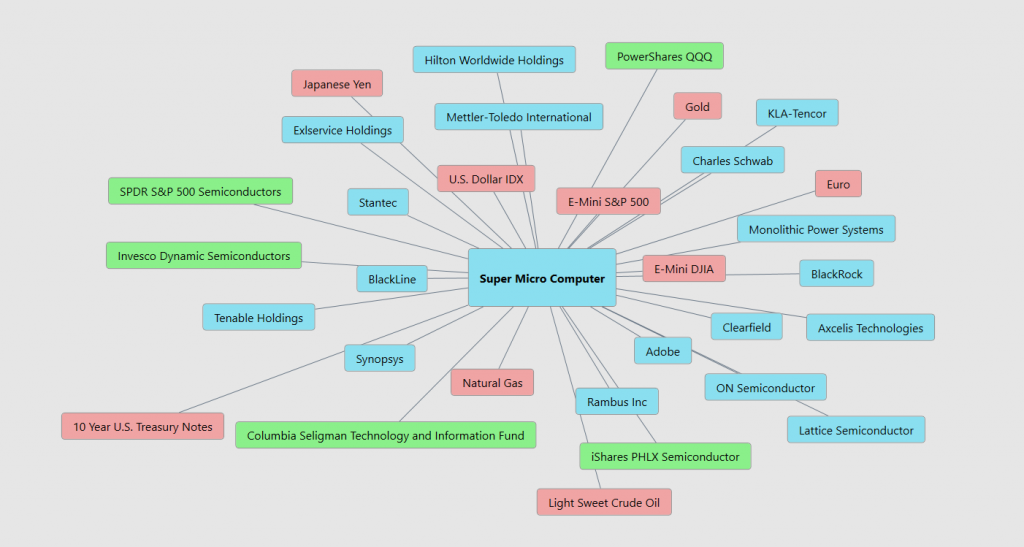
Intermarket Analysis
Intermarket analysis is like looking at a big puzzle made up of different pieces that represent various financial markets. Imagine you have four puzzles in front of you: stocks, bonds, currencies (like dollars or euros), and commodities (like gold or oil). Each puzzle piece shows you how one of these markets is doing.
Now, if you only look at one puzzle piece at a time, you might not get the whole picture. For example, if you only look at the stock market, you might miss important clues about what’s happening in other markets that could affect stocks.
Intermarket analysis is all about putting these puzzle pieces together. It’s about looking at how changes in one market, like bonds or currencies, might affect another market, like stocks. By understanding how different markets influence each other, investors can get a better idea of what’s going on overall and make smarter decisions about where to put their money.
Think of it as connecting the dots between different markets to see the bigger picture of how they all fit together. It’s like seeing how changes in one part of the economy can ripple out and impact other parts, helping investors make more informed choices.
We owe a debt of gratitude to pioneers like Louis Mendelsohn, founder of VantagePoint Software, and John Murphy for their groundbreaking contributions to Intermarket Analysis. Through their dedication and insight, they paved the way for investors to understand the intricate connections between various financial markets. Mendelsohn’s innovative approaches and Murphy’s seminal works have empowered countless traders and analysts to navigate the complexities of global finance with greater clarity and foresight. Their legacies continue to inspire and guide us as we seek to unravel the interconnected web of markets in pursuit of sound investment decisions.
The graphic below shows you the top 31 drivers of $SMCI’s price action.
Our Suggestion
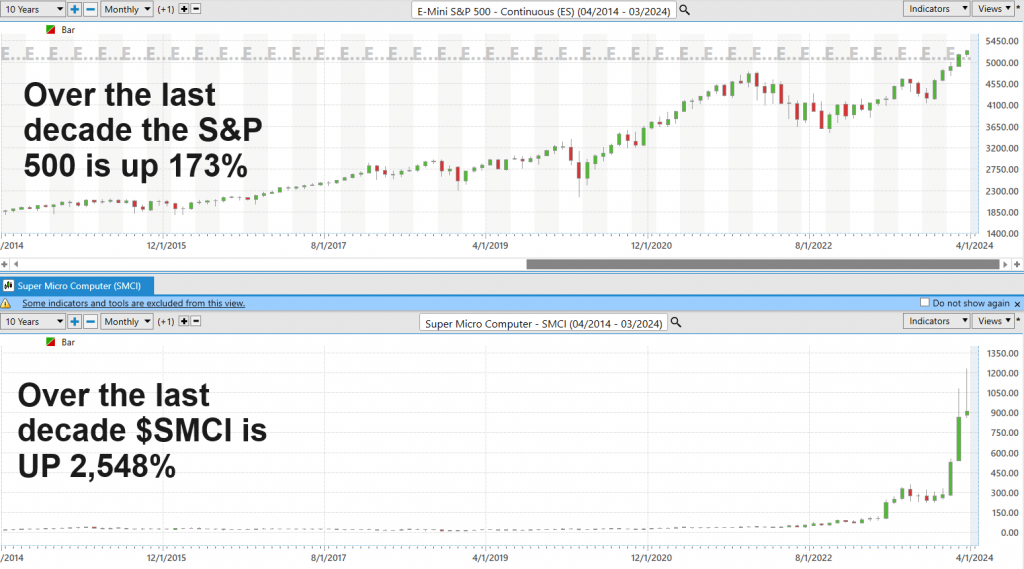
Over the last 10 years $SMCI is up 2548%. Meanwhile the S&P 500 is up 173% over the same time frame.
Stocks like $SMCI can be a life changer when they are traded correctly. Position sizing is vital as the volatility of this stock is higher than anything you’ve ever traded before.
Two of the huge winners of the ai surge into the economy have been $NVDA and $AMD.
Let’s flip the script for a moment and talk about the high-flying SMCI. This company has been nothing short of a rocket, folks! When we drill down into the numbers, SMCI stands tall as the undisputed champion of percentage gains. Just think about this: the stock is up a staggering 219% since the start of the year and, hold your hats, an astronomical 824% over the last 12 months. Now, despite hitting a bit of turbulence recently, with the shares pulling back to south of $900 after soaring to an intraday pinnacle of $1,229 on March 8, the journey of SMCI has been one for the record books. This, my friends, is a story of resilience, a testament to the sheer velocity of growth that certain companies can achieve. It’s the kind of performance that makes investors’ hearts race, and rightly so. It also speak to the power and narrative of artificial intelligence fueling a companies growth.
$SMCI is perfectly poised to benefit from building archirtectural server side solutions powered by the growth and demand for artificial intelligence.
Next earnings will be reported on May 7, 2024. This will be a key driver moving forward. In the interim we anticipate a pullback on the stock and will be monitoring the ai daily range for future guidance.
We expect earnings and revenue growth will propel $SMCI higher.
Long term the prospects look very positive here. Short term we expect price action to be quite choppy.
We advise that you practice good money management on all of your trades and that you follow the A.I. forecast for your trend anaysis to determine optimal entries and exits.
Let’s Be Careful Out There!
Remember, It’s Not Magic.
It’s Machine Learning.
Disclaimer: THERE IS A HIGH DEGREE OF RISK INVOLVED IN TRADING. IT IS NOT PRUDENT OR ADVISABLE TO MAKE TRADING DECISIONS THAT ARE BEYOND YOUR FINANCIAL MEANS OR INVOLVE TRADING CAPITAL THAT YOU ARE NOT WILLING AND CAPABLE OF LOSING.
VANTAGEPOINT’S MARKETING CAMPAIGNS, OF ANY KIND, DO NOT CONSTITUTE TRADING ADVICE OR AN ENDORSEMENT OR RECOMMENDATION BY VANTAGEPOINT AI OR ANY ASSOCIATED AFFILIATES OF ANY TRADING METHODS, PROGRAMS, SYSTEMS OR ROUTINES. VANTAGEPOINT’S PERSONNEL ARE NOT LICENSED BROKERS OR ADVISORS AND DO NOT OFFER TRADING ADVICE.


