| This week’s a.i. Stock Spotlight is Under Armour ($UAA) |
Under Armour, Inc. ($UAA), an emblem of innovation in the athletic apparel industry, stands as a testament to American entrepreneurial spirit. Founded in 1996 by the tenacious Kevin Plank, a former University of Maryland football player, the company took root in his grandmother’s basement with a vision that was nothing short of revolutionary. Plank’s initial focus was on creating moisture-wicking fabric to keep athletes cool and dry—a goal that not only met but exceeded expectations, propelling Under Armour from a niche market into a global powerhouse headquartered in Baltimore, Maryland.
Today, Under Armour is a beacon of innovation with about 15,000 employees worldwide, dedicated to pushing the boundaries of performance wear. The company’s product line, which spans from the original moisture-wicking t-shirts to an expansive range of footwear, sports gear, and casual wear, has historically seen apparel as its largest revenue generator. Yet, footwear has rapidly ascended to become a significant contributor to the company’s revenues. Under Armour’s strategic acquisitions, such as MapMyFitness and Endomondo, have further diversified its offerings, enhancing both its technological edge and market reach.
Financially, Under Armour navigates a competitive landscape dominated by giants like Nike and Adidas, with total liabilities amounting to approximately $1.47 billion against cash reserves of about $1.04 billion. The company has leveraged its direct-to-consumer channels to bolster profit margins and maintain control over its brand, a move critical in an era where digital presence reshapes market dynamics. Despite these efforts, Under Armour faces ongoing challenges from market saturation in North America, although international expansion presents new opportunities.
Under Armour’s journey is a compelling narrative of relentless pursuit and innovation—an American dream brought to life. From selling shirts out of the trunk of a car to outfitting Olympic teams, the company has not only reshaped athletic wear but also crafted a legacy of resilience and strategic growth. As Under Armour continues to navigate the complexities of global markets and shifting consumer preferences, its story remains a source of inspiration, demonstrating the profound impact of vision, leadership, and the courage to redefine the possible.
Amid the challenges and triumphs, Under Armour has not only focused on growing its product line and market share but has also committed to sustainability and community involvement. The company’s initiatives include the use of recycled materials in its products, reflecting a broader commitment to environmental responsibility. Furthermore, Under Armour has played a significant role in promoting health and fitness through its global community of connected fitness apps. These efforts underscore the company’s dedication not just to innovation in product design and marketing strategies but also to fostering a positive impact on society and the planet. This holistic approach to business, coupled with a robust strategy to tackle financial and competitive pressures, positions Under Armour as a leader not just in sportswear but in global corporate citizenship.
Under Armour Inc. ($UAA) has a market capitalization of approximately $2.945 billion. The average daily trading volume for the stock is around 7,380,293 shares.
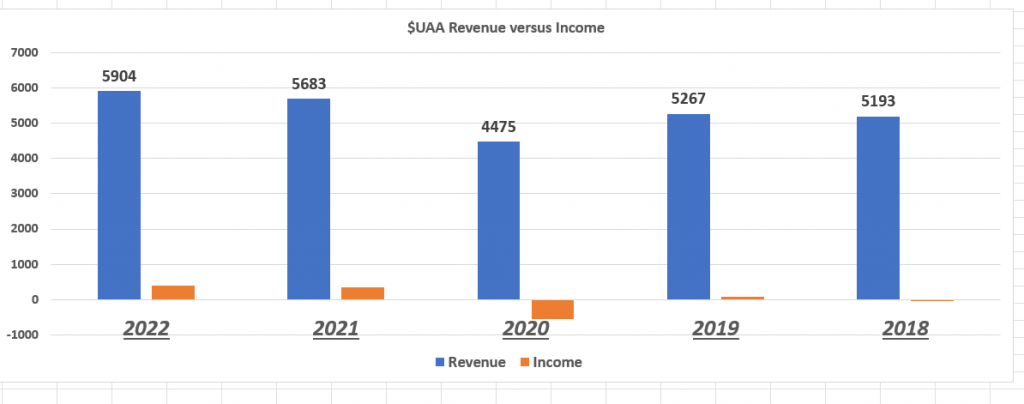
When we analyze the financials of Under Armour ($UAA) we see flat revenues, and less than impressive earnings.
In a twist that’s got Wall Street scratching its heads, Kevin Plank is once again taking the reins at Under Armour. The company’s founder is stepping back into the CEO role after Stephanie Linnartz’s surprisingly short tenure of just about a year. Now, why the sudden switch? It’s raising more than a few eyebrows and sending Under Armour’s stock down to all-time lows as well as 52-week lows. Not exactly what you’d call a warm Wall Street welcome.
Kevin Plank, the original visionary behind Under Armour, had handed over the CEO baton four years ago, leaving the company he launched from his grandmother’s basement back in 1996. Linnartz, a three-decade Marriott veteran, was expected to spearhead a major turnaround, injecting new life into the brand with initiatives like a loyalty program and expanding the women’s line. But here we are, with Plank back at the wheel, and Linnartz shifting to an advisory role through April. It seems her strategies weren’t producing the smooth turnaround the board of directors had originally hoped for.
Now, Plank is talking a big game about reconstituting strengths and driving success, but let’s be real – investors are jittery. The market doesn’t really like surprises, especially the kind that suggests all’s not well. And with Plank previously steering the company to rapid North American growth, replicating this success in today’s market is a tall order. Over the past 5 years $UAA has generated $26.5 billion in revenue and only $243 million to the bottom line. That means their cumulative net income is less than 1% over the past 5 years.
It’s a dicey time for Under Armour, with the stock still staggering 85% below its all-time highs. With this leadership shuffle, investors are left wondering: Is this just a bump in the road on the way to recovery, or a sign of deeper troubles ahead? Only time will tell, but one thing’s for certain—this isn’t going to be an easy run for Plank.
In this stock study we will look at the following metrics and indicators.
1. Wall Street Analysts’ Estimates
2. 52-week high and low boundaries
3. Vantagepoint A.I. Predictive Blue Line
4. The Best Case – Worst Case Scenarios
5. Neural Network Forecast
6. Daily Range Forecast
7. Intermarket Analysis
8. Our Trading Suggestion
We don’t base decisions on things like earnings or fundamental cash flow valuations. However, we do look at them to better understand the financial landscape that a company is operating under.
Wall Street Analysts’ Estimates
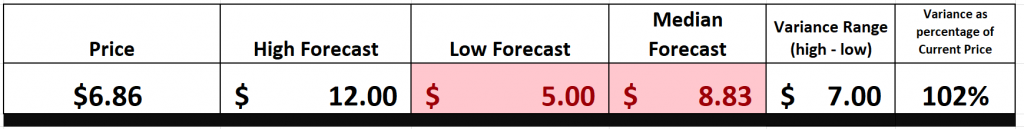
18 Wall Street analysts have provided their 12-month price targets for Under Armour. The consensus suggests a median target of $8.83, with projections ranging from a low of $5.00 to a high of $12.00. This spread indicates varying levels of optimism about the athletic apparel company’s financial outlook and market performance potential over the coming year.
In this part of our analysis, we like to look at the variance between the most bullish and most bearish Wall Street analysts. This variance provides us with a range of expected volatility for the year ahead. Currently this variance is $7 or 102% of the current price. This is a very high level of expected future volatility.
52-Week High and Low Boundaries
We always advise that traders pay attention to a stock’s 52-week boundaries. These levels act as a report card on a stock, particularly when focused over the past year and compared to the broader market as a whole.
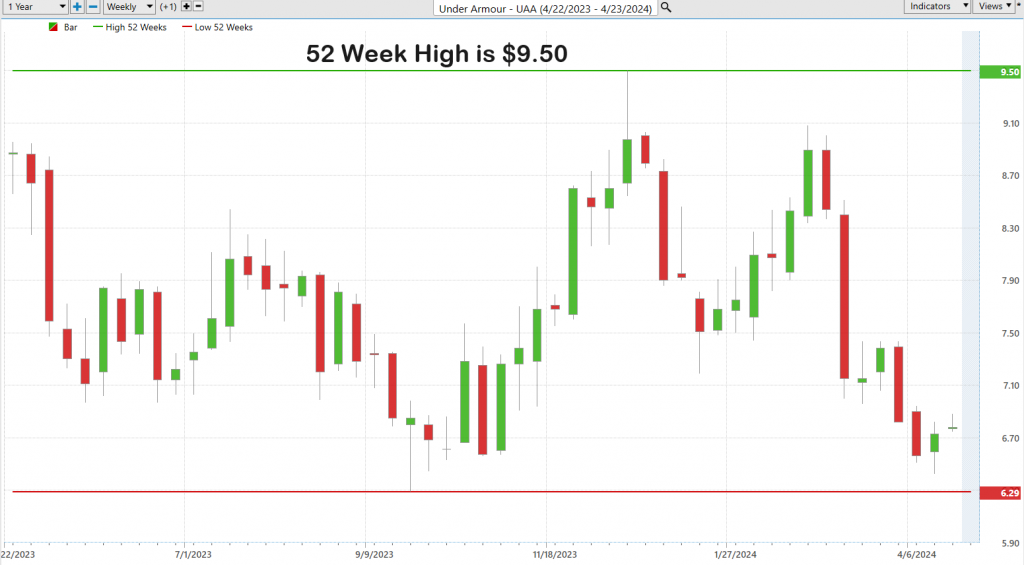
Over the past 52 week $UAA has traded as high as $9.50 and as low as $6.29.
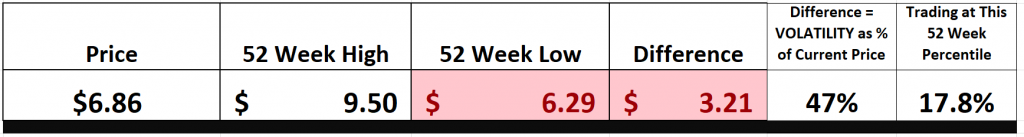
The annual trading range, the difference between the 52-week high and 52 week low was $3.21 or 47% of the current price. The Stock is trading at its 17th percentile of the last 52 weeks.
In the world of finance, the 52-week high and low markers are more than just numbers—they’re a barometer of a stock’s health and investor sentiment, much like a thermometer gauges temperature. These critical points represent the zenith and nadir of a stock’s journey over the past year, acting as key psychological landmarks for market participants. When a stock touches its 52-week high, it’s often seen as a sign of strength, an indication that the stock is in high demand and could climb even higher. This is the kind of momentum that catches the eye of investors looking for robust performers.
Conversely, when a stock plummets to a new 52-week low, it rings alarm bells, signaling potential trouble and often triggering a sell-off as investors rush to reassess its value. These levels, time-tested through decades of market history, serve as fundamental tools in technical analysis, helping to paint a clearer picture of market dynamics and investor behavior.
These benchmarks are not just for seasoned traders but are incredibly insightful for novices too. Observing stocks as they reach these highs and lows can provide a real-time education in market trends and the psychological forces at play in trading. It’s a practical demonstration of how external factors such as news releases and economic shifts influence investor decisions and stock valuations.
In essence, these 52-week markers do more than outline the boundaries of stock performance; they provide a narrative on market sentiment, offering a window into the collective psyche of the investment community. This kind of insight is invaluable, whether you’re a day trader reacting to short-term movements, or a long-term investor aiming for strategic entries and exits. Such wisdom is drawn from generations of market watchers, embodying the enduring spirit and evolving intellect of the financial world.
As already noted in the introduction, over the last month $UAA has replaced its CEO, and that position will now be held by its founder. There is plenty of drama simply trying to understand this backdrop which the company is operating under. Some analysts feel that the stock is incredibly undervalued while others feel that the earnings outlook for the company is grim and until net income starts increasing considerably the company is nothing to write home about. The net result is we can expect boatloads of future volatility and this is where artificial intelligence trading excels.
Here is the 52-week chart which isolates the journey $UAA has had over the past year.
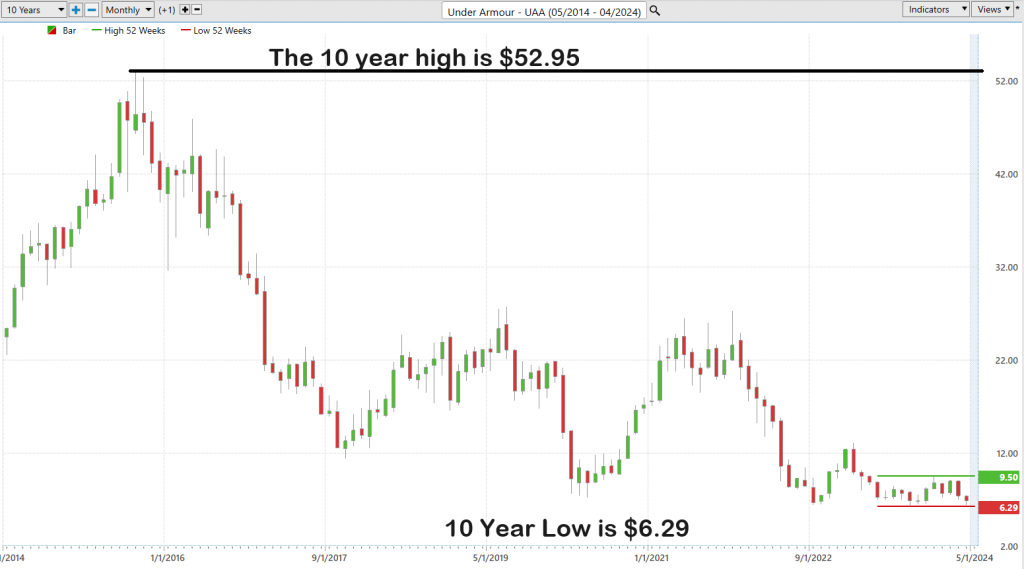
To truly grasp the long-term trajectory of any stock, it’s essential to pull back for a broader perspective—think of it as taking in the panoramic view of a 10-year chart. This approach doesn’t just highlight what’s happened in the past year; it contextualizes it within the last decade, offering us a clearer, more comprehensive snapshot of trends over time. It’s a powerful method that gives us not just data, but insight, revealing the broader movements beneath the market’s daily ups and downs. This kind of long-range analysis is invaluable for anyone serious about understanding the forces that shape market trends.
So far, the charts paint a picture that is riddled with more problems than successes. This is why we dig deeper and continue our analysis to try and better understand the risk and reward associated with $UAA.
Best Case – Worst Case Scenario
What all traders need to do to succeed is to develop and objective understanding of risk and reward. While there are many quantitative tools and metrics designed to assist in this regard, the most practical thing a trader can do is to simply look at the past year and compare the magnitude of the rallies with the size of the declines. This simple exercise forces traders to understand what normal price action and volatility is. It is invaluable for developing a realistic perspective related to risk.
Achieving success demands more than just savvy trading—it requires a profound understanding of risk and reward. Every investor, from Wall Street tycoons to the small-time trader, must develop a clear-eyed perspective on potential returns versus potential pitfalls. Consider adopting what I refer to as the “Feast or Famine” analysis. This method involves scrutinizing a stock’s performance over the past year, comparing the robustness of its rallies against the severity of its declines. This not only aids in grasping the stock’s typical price actions and volatility but also in setting realistic expectations for future performance.
Consider this approach akin to a financial weather forecast that helps you anticipate whether your trade will experience sunny prosperity or need to endure severe market downturns. By analyzing the best rallies and worst declines of market performance, you gain essential insights into its potential risks and rewards, which can critically inform your decisions. This strategic analysis not only deepens your understanding but also prepares you to handle the volatile nature of the stock market more effectively, allowing you to navigate with increased confidence and control. Such preparation ensures you’re ready for the best outcomes while being well-equipped to manage the worst, thus clearing the fog of uncertainty that often surrounds investment choices.
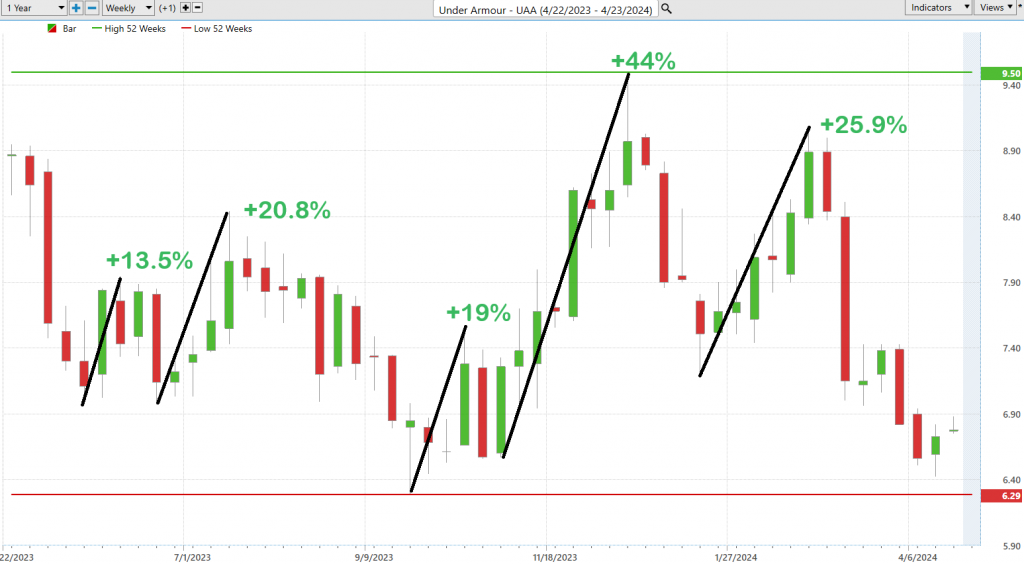
– **In the Best-Case Scenario**: You’re essentially mapping out the strongest rallies. This provides a glimpse into the heights and trading psychology of the past year. It’s about being aware and creating grounded expectations based on historical reality.
– **In the Worst-Case Scenario**: Flip the script and trace the worst declines. This exercise acquaints you with the risks, prepping you for what’s in store in a worst-case scenario.
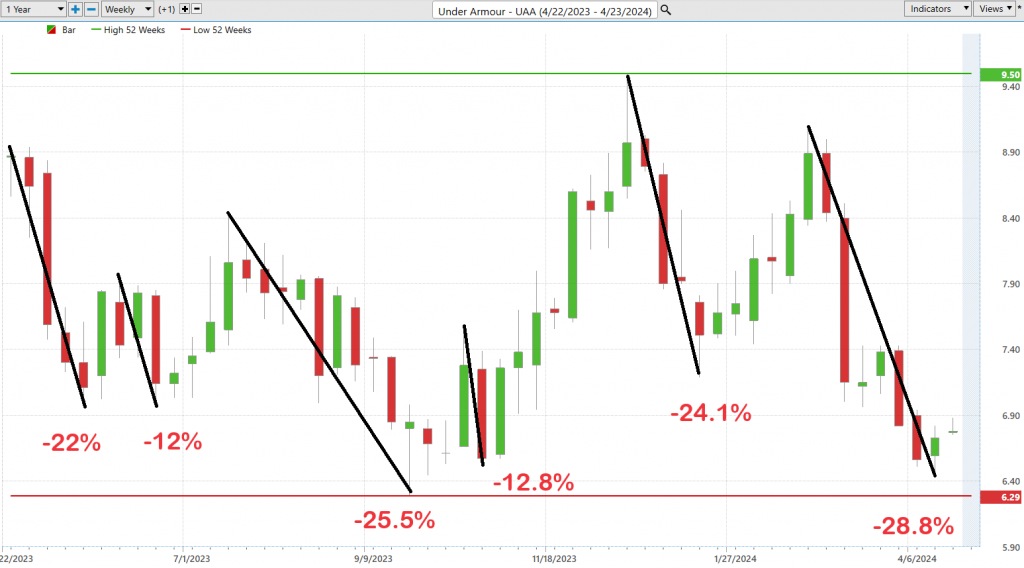
Before you allocate your hard-earned money to the markets, pause to perform a detailed analysis; think of it as lighting your way through the financial landscape, preparing you for potential uncertainties ahead. This method goes beyond simple savvy investing—it’s about developing a tailored strategy that resonates with your financial goals and risk tolerance. By applying this analytical approach, we can clearly see the risk-reward scenario for Under Armour ($UAA) over the past year. For instance, understanding that the stock experienced declines of 28.8% while also observing rallies as high as 44% equips you with the necessary insights to make well-informed and personalized trading decisions. Such awareness is crucial as you prepare to handle the inherent volatility in $UAA’s market movements.
What is also very interesting to note was that Stephanie Linnartz stepped down as CEO of Under Armour on April 1, 2024. Upon the news, $UAA sold off an additional 13%.
Moving forward, a comparative analysis of $UAA against broader market indices is crucial. This comparison not only highlights where $UAA has outperformed or underperformed in relation to the broader market.
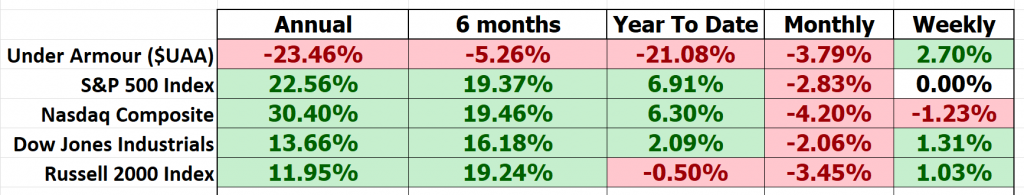
We can see that $UAA has massively underperformed the broader stock market indexes.
When we dig deeper, we look and compare $UAA with its largest publicly traded competitors.
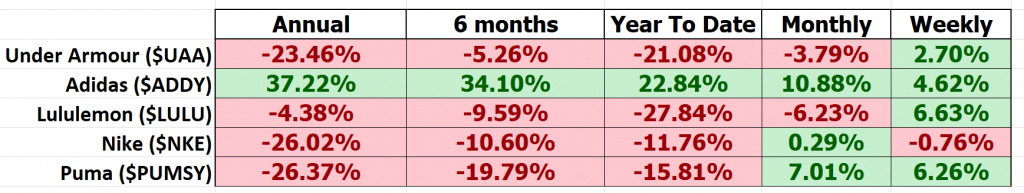
Performing this simple analysis allows us to see the sector and how $UAA has performed in relation to its peers. In the sector Adidas is clearly the winner while the rest of the players, including $UAA have clearly struggled over the past 52 weeks.
A critical component of this analysis involves assessing $UAA’s volatility relative to the broader market, through the lens of the beta coefficient. Beta is a measure of a stock’s volatility in relation to the overall market; a beta of 1 suggests that the stock moves in concert with the market, a beta above 1 indicates higher volatility, and a beta below 1 denotes lower volatility. Under Armour, Inc. ($UAA) has a beta of 1.64, indicating that the stock is more volatile than the market average. This means that the stock’s price movements are more 64% more pronounced in comparison to the overall market movements.
These simple practical steps now lead us into the Artificial Intelligence analysis.
VantagePoint A.I. Predictive Blue Line Analysis
Our guiding principles are as follows:
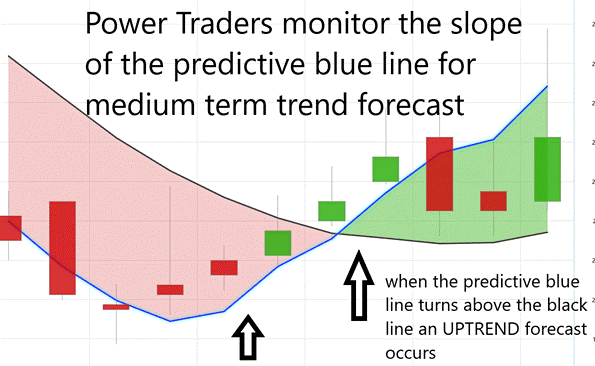
**Trend Analysis**: The slope or trajectory of the predictive blue line is critical for forecasting the trend direction of $UAA. A rising slope suggests an upward trend, while a downward slope indicates a potential decline in the stock’s price.
**Value Zone Identification**: The area around the predictive blue line serves as the ‘Value Zone.’ For traders, this means looking for buying opportunities when the price is at or below this line during an upward trend, or selling when the price is above this line in a downward trend.
**Market Positioning**: As the predictive blue line trends downward, it signals to traders that lower prices may be expected. In response, traders might either move to the sidelines, waiting for more favorable conditions, or they might hedge their positions to manage risk as they anticipate further declines.
These artificial intelligence capabilities are transforming the way traders approach the market, especially with assets like $UAA, through its trend-forecasting prowess. The predictive blue line, a cornerstone of this sophisticated system, acts as a lighthouse in the foggy seas of stock trading, guiding investors towards potentially lucrative shores.
The predictive blue line utilized by VantagePoint Software emerges as a crucial tool, transcending its initial role as a mere analytical feature. This line acts not just as a guide but as a direct conduit to market dynamics, offering investors real-time insights and foresight into upcoming trends. VantagePoint’s innovative use of AI technology elevates this tool, providing users with the capability to anticipate market movements before they happen. The software’s A.I.-driven analysis helps demystify complex intermarket relationships and forecast potential market shifts, presenting a clear advantage in a landscape where conditions change rapidly. By integrating this technology, investors gain a strategic edge, enabling them to make informed decisions, pinpoint opportunities, and shield their investments from volatility. This combination of advanced A.I. and intuitive market analysis tools like the blue and black lines offers a beacon of clarity, guiding traders through the financial market’s turbulences with increased confidence and precision.
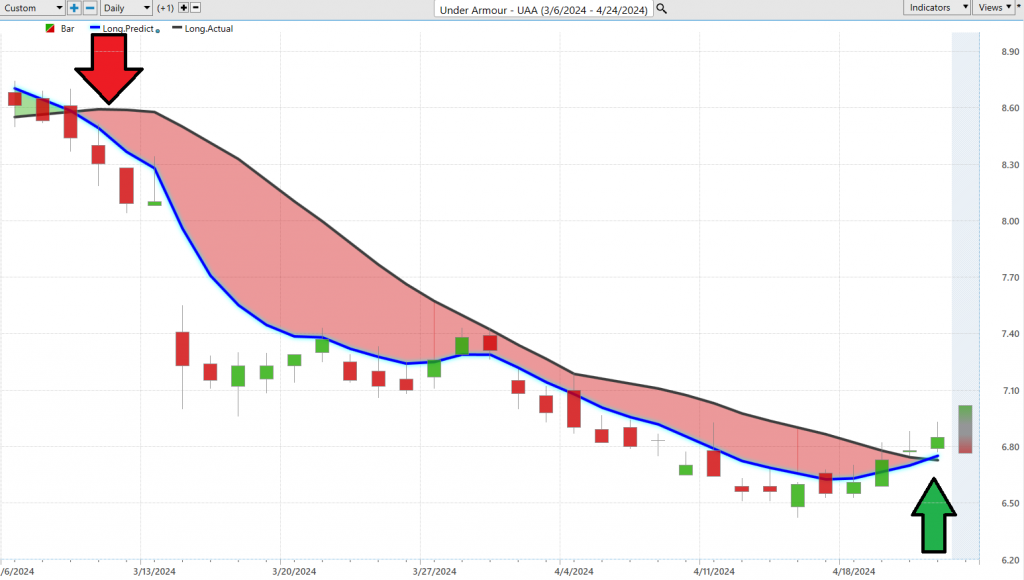
You can see how effective the blue line has been at navigating the trend in $UAA.
Before stepping into this trade on one indicator signal alone we look for confirmation from other ai tools as well.
Neural Network Indicator (Machine Learning)
Neural networks for trading are advanced computational models inspired by the human brain’s structure and function. These models consist of layers of interconnected nodes, or “neurons,” which perform calculations and process data similarly to the way our brains process information. In trading, neural networks excel in pattern recognition, allowing them to identify complex, nonlinear relationships in market data that might be invisible to human traders or conventional statistical methods. This capability is crucial in the dynamic environment of financial markets where these models continuously learn and adapt from new data.
The practical application of neural networks in trading is transformative. They provide traders with a sophisticated tool that can predict market trends, enhancing decision-making, risk management, and potentially increasing returns. These networks parse vast datasets to uncover patterns and correlations that escape even the most experienced traders, functioning almost as if they can foresee market movements. This predictive power helps traders identify profitable opportunities and emerging trends quickly, giving them a significant advantage in making timely and informed trading decisions.
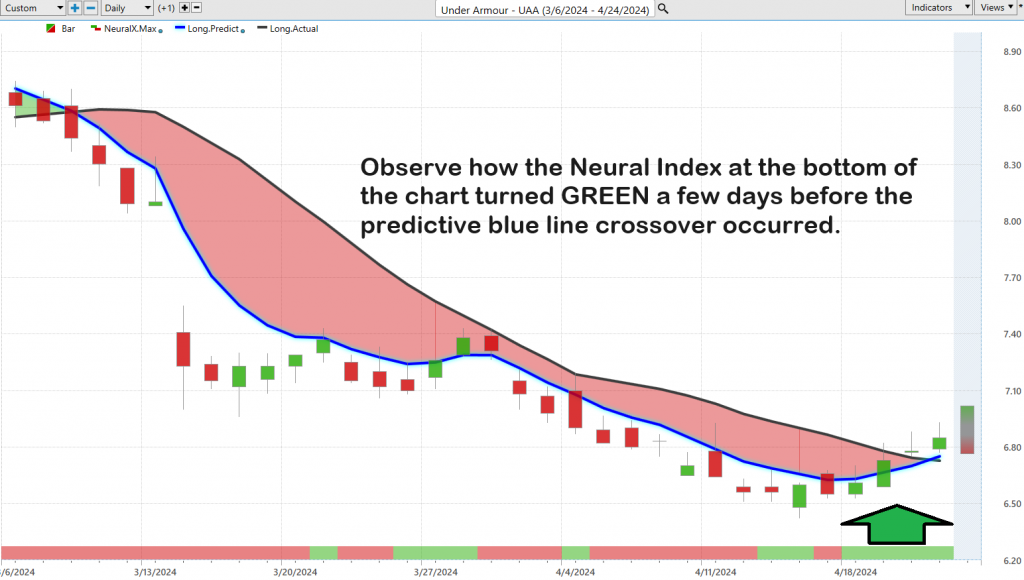
For instance, within trading software platforms like VantagePoint, the neural network indicator serves as a strategic ally. It is represented visually on charts, often glowing green to indicate strong market conditions or red to warn of potential declines. This integration of neural networks with traditional charting tools like the Predictive Blue Line creates a powerful synergy, enhancing the tool’s efficacy by confirming trends through “double confirmation” signals. This dual-layered approach not only points traders towards likely profitable trades but also navigates them through the market’s complexities with precision and foresight. This technology elevates trading strategies, making it a critical component for traders looking to leverage cutting-edge technology to maximize their market presence.
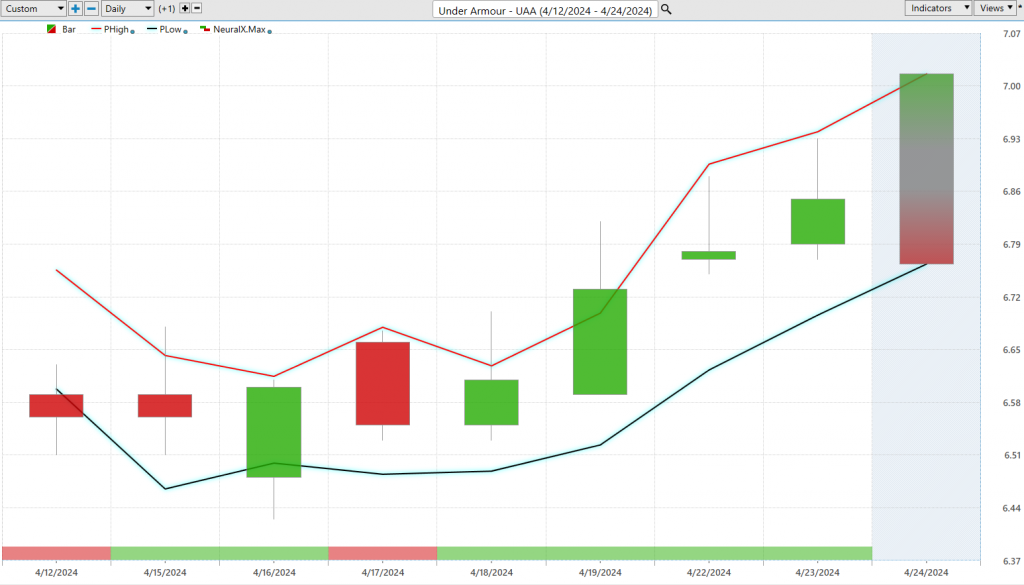
Short term traders on $UAA have been in the trade riding price higher.
Intermediate term traders will often look to buy at or near the value zone at 6.73 or lower.
The rationale for this trade is that $UAA has bounced off its 52-week lows and its founder is back in the saddle as CEO. Traditionally ai traders are short to intermediate term traders, looking for opportunity when guided by artificial intelligence.
Vantagepoint A.I. Daily Range Forecast
Identifying the best moments to enter and exit the market poses a significant challenge for traders, particularly due to the deceptive nature of market volatility. Success in trading hinges not only on understanding the variations in daily, weekly, and monthly trading ranges for stocks like Under Armour ($UAA) but also on effectively leveraging this knowledge in practical trading scenarios.
The real skill in mastering the market extends beyond mere access to data; it involves transforming this data into actionable strategies. This transformation is facilitated by advanced technologies such as artificial intelligence (A.I.), machine learning, and neural networks. These technologies act as navigational tools through the often-chaotic financial markets, offering clear insights into market trends and precise forecasts of trading ranges, thereby minimizing the guesswork traditionally associated with trading decisions.
Here is what the volatility on $UAA looked like over the past year based on the daily weekly and monthly time frames.
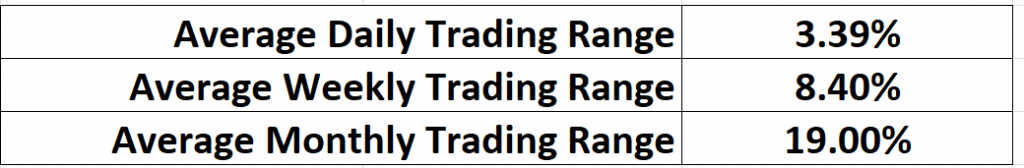
There is a whole lot of volatility going on here.
This is where the VantagePoint A.I. Daily Range Forecast assists traders greatly with its exacting precision and analysis allowing short-term swing traders the opportunity to excel.
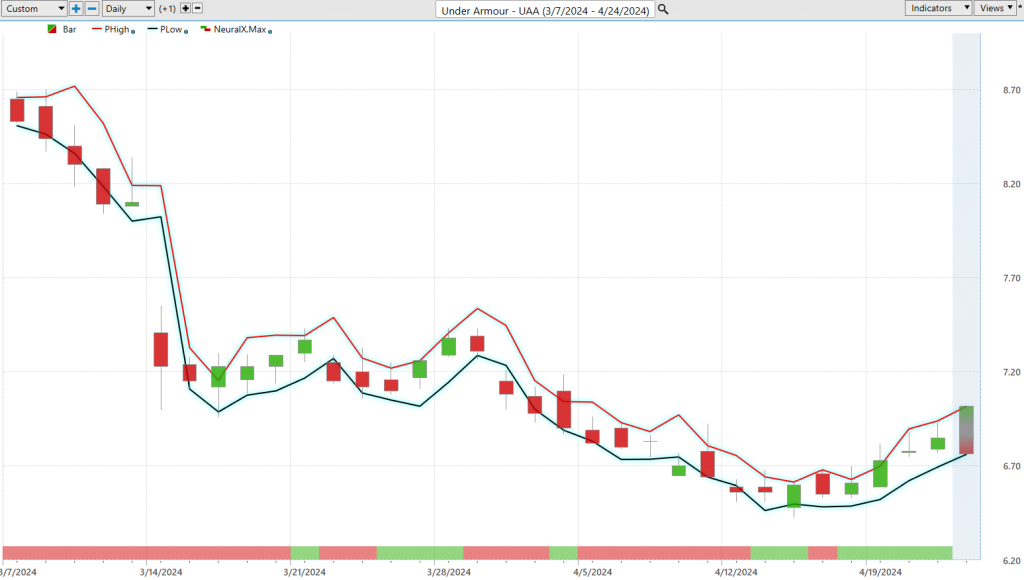
This tool provides detailed insights into expected daily market movements and clearly outlines market trends and anticipated trading ranges. This clarity enables traders to plan their market entry and exit strategies with greater confidence. By applying such sophisticated analytics, traders can transform intricate market data into practical, actionable trading strategies, thereby opening opportunities for significant growth within the volatile realm of financial markets. Such precision in predictive analytics is vital for traders who aim to effectively capitalize on market dynamics.
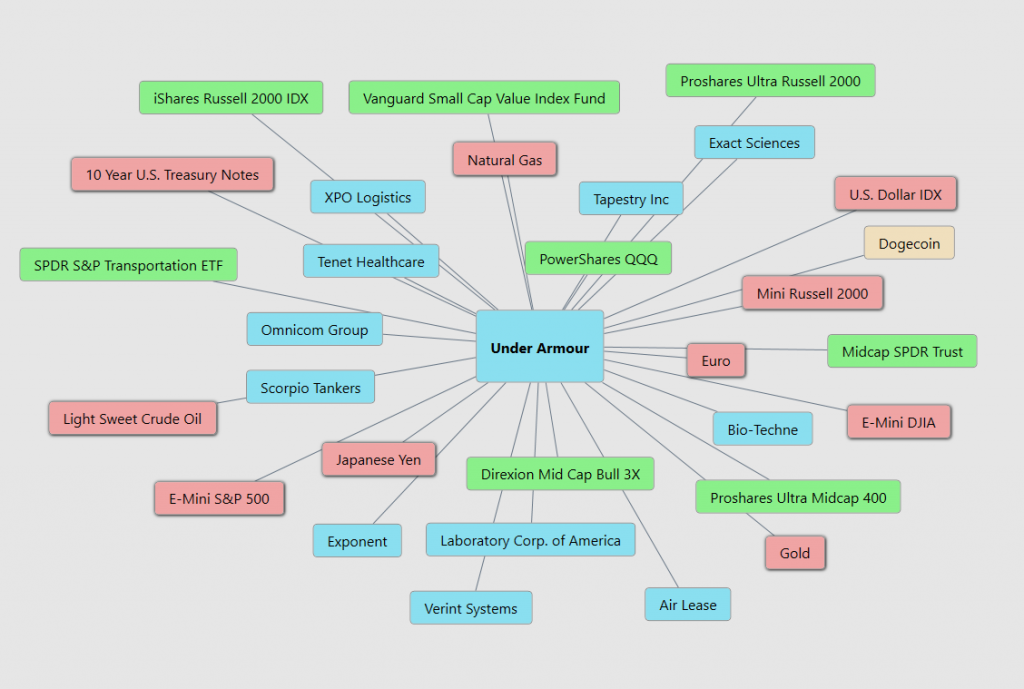
VantagePoint A.I. Intermarket Analysis
Intermarket analysis is a vital tool for traders aiming to comprehend the complex web of relationships among different financial markets such as stocks, bonds, commodities, and currencies. This method provides insight into how movements in one market can influence and are influenced by movements in others, essentially showing how these markets dance together in a sophisticated economic ballet.
For example, a significant increase in oil prices can set off a chain reaction affecting various markets. This rise in oil prices could lead to increased inflation expectations, which may prompt changes in interest rates and bond yields. Such changes, in turn, could impact the stock market, particularly affecting sectors sensitive to fluctuations in oil prices or interest rates. Similarly, the strength of a currency can influence commodity prices, impacting related stocks and sectors.
Understanding these relationships allows traders to anticipate underlying trends and shifts before they become evident through traditional analysis. This broader perspective can enhance decision-making, improve risk management, and uncover trading opportunities that might not be apparent when focusing on a single market.
Intermarket analysis was popularized in the late 20th century by John J. Murphy, a renowned figure in technical analysis. His work, including publications like “Intermarket Analysis: Profiting from Global Market Relationships,” highlighted the importance of understanding global market relationships. This concept was further advanced by Lou Mendelsohn through the development of VantagePoint Software, which uses AI to harness the power of intermarket analysis, enabling traders to navigate the interconnected financial markets more effectively.
By adopting intermarket analysis, traders can gain a holistic view of the financial landscape, moving beyond the confines of single-market analysis to engage with the global dynamics at play. This approach not only fosters a deeper understanding of market relationships but also positions traders to make more informed and strategic decisions, navigating the financial markets with greater foresight and agility.
Here are the 31 key drivers of $UAA’s price:
Our Suggestion
Under Armour’s next earnings call is scheduled for May 14, 2024. This call will address the company’s performance and provide insights into its financial health and strategic direction. The earnings call will be an opportunity for investors and analysts to hear directly from the company’s management about their latest results and future outlook.
Under Armour’s financial indicators are drawing attention in the market. The company’s Price-to-Earnings (PE) ratio stands at 7.70, significantly lower than the industry average and its peers, suggesting potential undervaluation relative to its earnings performance. Additionally, its Price-to-Sales (PS) ratio is positioned at 0.51, indicating how much investors are paying for each dollar of sales, a figure that underscores the company’s sales efficiency.
Despite these promising metrics, Under Armour’s market position involves a degree of volatility. Traders considering this stock should weigh these factors carefully to understand both the opportunities and risks associated with Under Armour’s current market valuation and financial health.
The drama surrounding the CEO change on April 1st will be front and center on the next earnings call. If founder Ken Plank can demonstrate earnings leadership Wall Street will become very excited by the turnaround.
The most bearish Wall Street analyst forecast is $5. With the stock trading at $6.86, a worst-case scenario is looking at roughly a 30% decline over the coming 12 months. Bulls on the other hand are looking for the $UAA to trade back to where it was at the beginning of the year, which is the $8.68 area. This is why $UAA deserves to be on your trading radar. Wall Street’s most bullish analyst see the stock trading at $12 over the next 12 months.
Under Armour has effectively leveraged its focus on innovation and technology to carve a niche in the high-performance sportswear sector, maintaining a strong brand presence among athletes and fitness enthusiasts. As the global interest in health and fitness continues to grow, Under Armour is strategically positioned to capitalize on this trend. Additionally, the brand’s strength is supported by strategic marketing and celebrity endorsements that particularly appeal to a younger demographic. This positioning is proving beneficial as the retail and apparel sectors show signs of post-pandemic recovery, with consumer spending on the rise, positioning Under Armour well to benefit from these market dynamics. The earnings call on May 14th will provide great insight.
Under Armour’s track record of innovation and solid brand equity makes it a compelling consideration for traders seeking to capitalize in the sportswear sector. For traders employing advanced analytical tools like VantagePoint A.I., there is a significant advantage in leveraging these technologies for short term gain. These tools can analyze short term market trends and offer predictive insights that are crucial for strategizing entry and exit points effectively. Given Under Armour’s strong performance post-IPO and its periodic favoritism on Wall Street, these intelligent systems will be key in unlocking patterns that inform optimal trading decisions, offering a promising outlook for informed, strategic trading in a dynamic market environment.
Let’s Be Careful Out There!
Remember, It’s Not Magic.
It’s Machine Learning.
Disclaimer: THERE IS A HIGH DEGREE OF RISK INVOLVED IN TRADING. IT IS NOT PRUDENT OR ADVISABLE TO MAKE TRADING DECISIONS THAT ARE BEYOND YOUR FINANCIAL MEANS OR INVOLVE TRADING CAPITAL THAT YOU ARE NOT WILLING AND CAPABLE OF LOSING.
VANTAGEPOINT’S MARKETING CAMPAIGNS, OF ANY KIND, DO NOT CONSTITUTE TRADING ADVICE OR AN ENDORSEMENT OR RECOMMENDATION BY VANTAGEPOINT AI OR ANY ASSOCIATED AFFILIATES OF ANY TRADING METHODS, PROGRAMS, SYSTEMS OR ROUTINES. VANTAGEPOINT’S PERSONNEL ARE NOT LICENSED BROKERS OR ADVISORS AND DO NOT OFFER TRADING ADVICE.