


Welcome to the Artificial Intelligence Outlook for Forex trading.
VIDEO TRANSCRIPT
Okay, hello everyone. Welcome back. My name is Greg Firman and this is the Vantage Point AI Market Outlook for the week of July the 28th, 2025.
PowerShares DB US Dollar IDN Bullish Fund $UUP
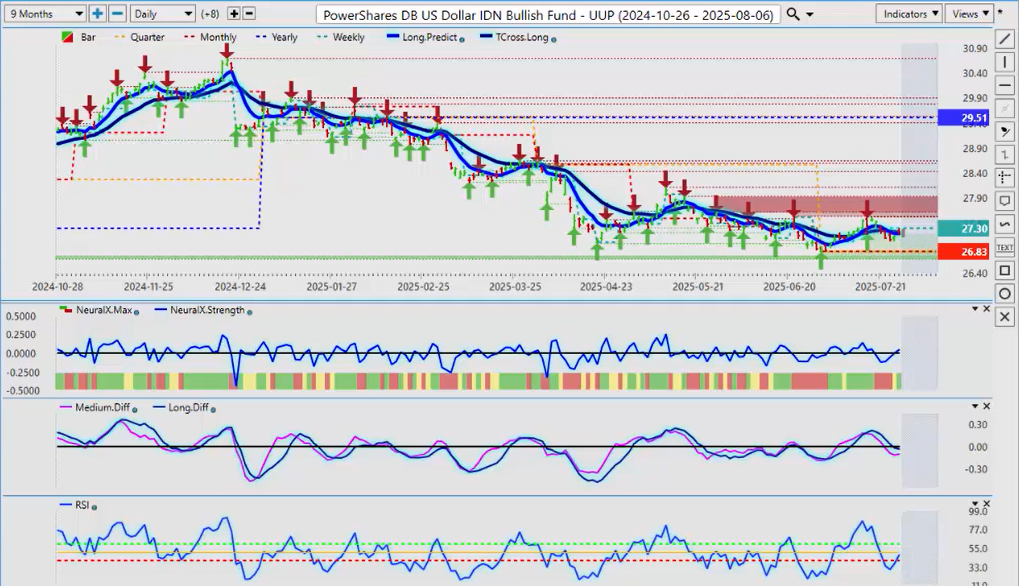
Now, to get started this week, we’ll begin where we always do — with that very important dollar index. Now, what I will point out here is that in each one of the calendar quarters this year in 2025, the dollar index itself and the UUP dollar bull fund has held below its quarterly opening price. Now, price appears to be shifting at this particular time, as we’re now holding above that calendar quarterly opening.
Now, what I’ve pointed out in the last few outlooks is that it is the fiscal fourth quarter for the U.S., and in most cases, there’s demand for U.S. dollars. So, looking at the indicators in VP, the dollar is starting to turn bullish again. Now, there’s a lot of factors that could send the dollar lower: the trade tariffs, Trump’s war with Powell. We also have the event risk this week of the Federal Reserve interest rate announcement. What you really want to watch with that is the press conference to see what Powell’s plan is going forward.
But for now, as you can see, we are holding above the quarterly opening price. That price coming in at 26.83, and the indicators in VP are starting to turn bullish. Now, I would strongly recommend waiting until Monday’s close to see what happens — what media announcements we get on Monday — because I can almost guarantee you there’s going to be something. Trump this weekend, I believe, is in the UK trying to cut a deal with the EU. So, we’ll be watching things very closely. But again, 26.83 — that is a key level.
Gold
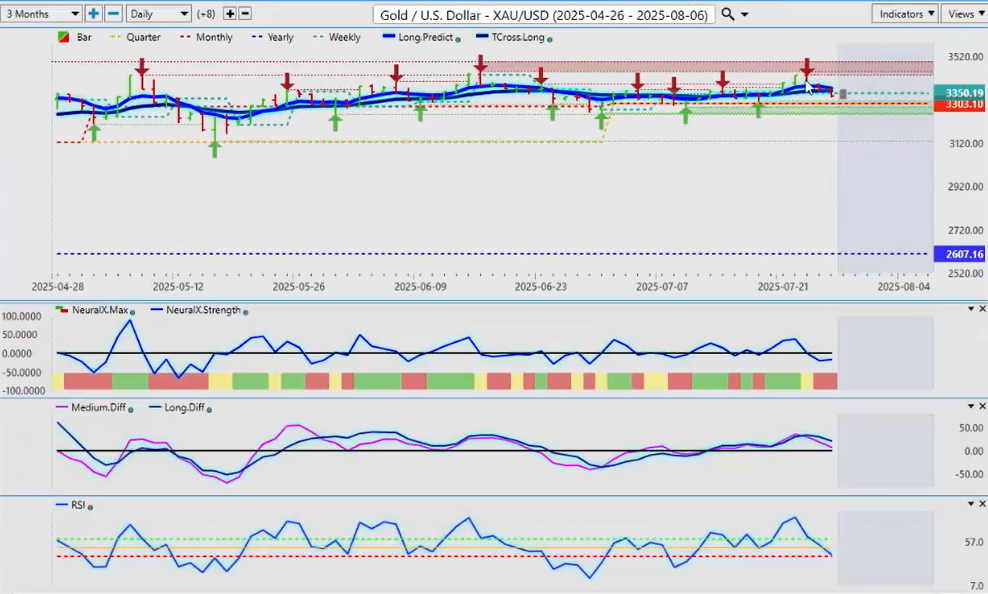
Now, when we do that comparative to gold, we can see that gold also is holding above its quarterly opening price, but it’s not carrying the same bullish tone as the U.S. dollar. We have the MA diff cross that has taken place right here. That’s warning that at the very minimum, we are likely to come down and test that quarterly opening at 3303. In my respectful opinion only, I think that it will likely break if we can get dollar strength. But either way, we are likely to see dollar strength in mid-August into the end of September.
So, gold longs could be difficult here. The indicators are definitely suggesting there’s a bearish tone. We’ve got very stiff resistance up here now — 3449. So, we know where our resistance is, and we know exactly where our main support is at the quarterly opening at 3303. So again, watch for a break of that particular area.
SPDR ETF SPY ($SPY)
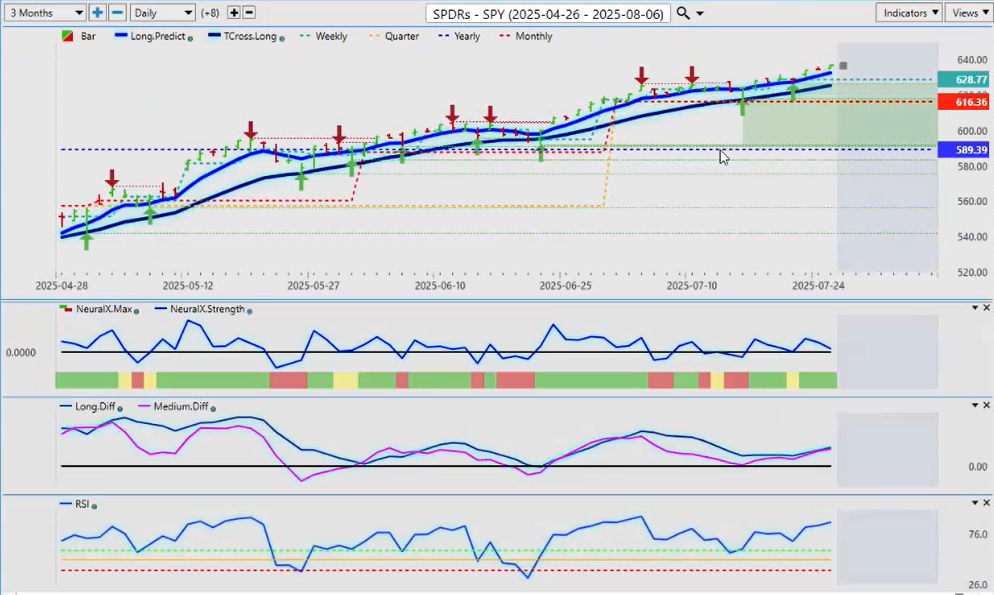
Now, the SPYs have done very well again. They’re starting off the quarter bullish yet again with the dollar. We’ve had one major retracement on July the 16th, directly on the TCROSS long and the quarterly opening price at that time — 61636. That is our key support level. The indicators in VP are a little bit mixed. I would argue we’re a little bit overextended, but I could also say we were overextended months, if not years ago — and it still continues to climb higher.
So, I think if we get a round of dollar strength coming, that could push the equities down, but longs remain in play while above, again, that key level — 61636.
Bitcoin
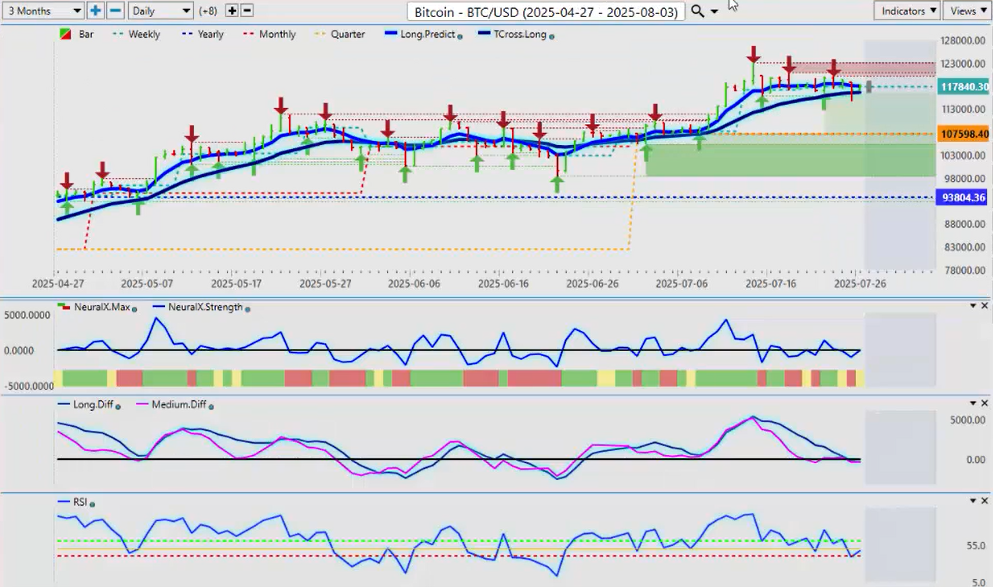
Now, Bitcoin again — having a pretty strong quarter here — but we’re losing momentum, guys. The medium- and long-term predicted difference are pointing down. But here’s a very interesting way to look at the predicted RSI. I’m looking for a break of the 40 level to get shorts moving here. I believe we will retest 107598 before Bitcoin makes its final run-up for the calendar year.
I am expecting a down year next year. Nothing is for sure, but we are in a three-year cycle with Bitcoin — three years up, one year down. We’re in the third year of this particular cycle. So watch, be very cautious. But I think longs are very, very risky up here, looking at those VP indicators. But again, we don’t have momentum to the downside at the current time. But I think a retracement down into this 107598 area is more than reasonable at this time.
U.S. Oil ($USO)
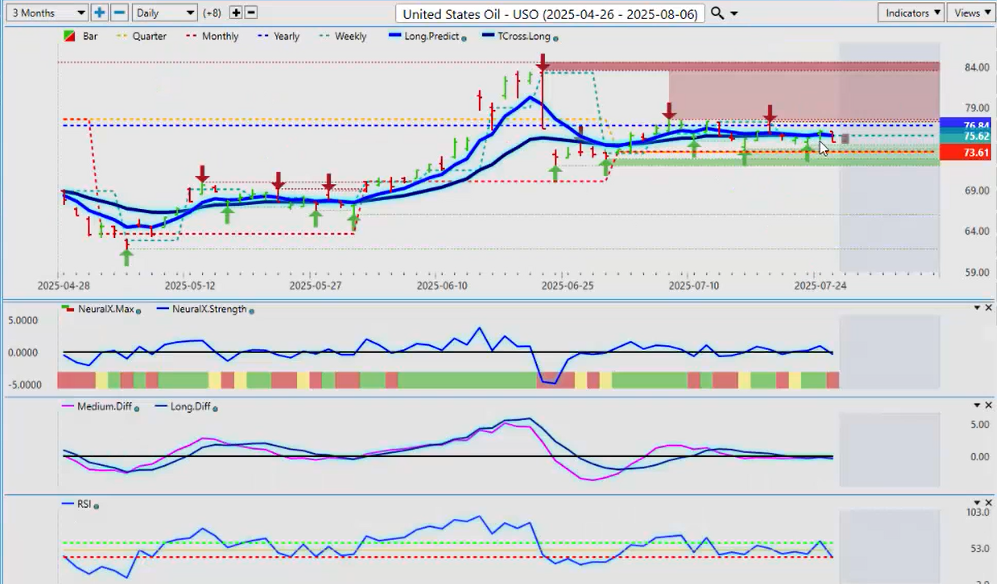
Now, looking at U.S. Oil, right now oil is running pretty much flatline. We’ve had a couple of retracements — again, keeping our trades, trading, investing simple here, guys, without complicating things. We’re in the third quarter — what is this doing? Is it above the quarterly opening or below it? That’s the first question you want to ask yourself. And what is the primary trend?
Primary trend — we’re below the yearly opening price at 76.84. But right now, the market is trapped between the calendar yearly opening price and the third quarter opening price. So, we’re looking for a break on either side of this.
Here’s an alternative way to invest or trade in this, guys: If you put a buy stop order above 76.84 and a sell stop below 73.61, that is probably the best way to play this and wait for this break to occur. But in my respectful opinion only, these indicators are suggesting that that break is going to be lower, not higher. So keep that in mind, but be mindful of those particular areas.
DAX
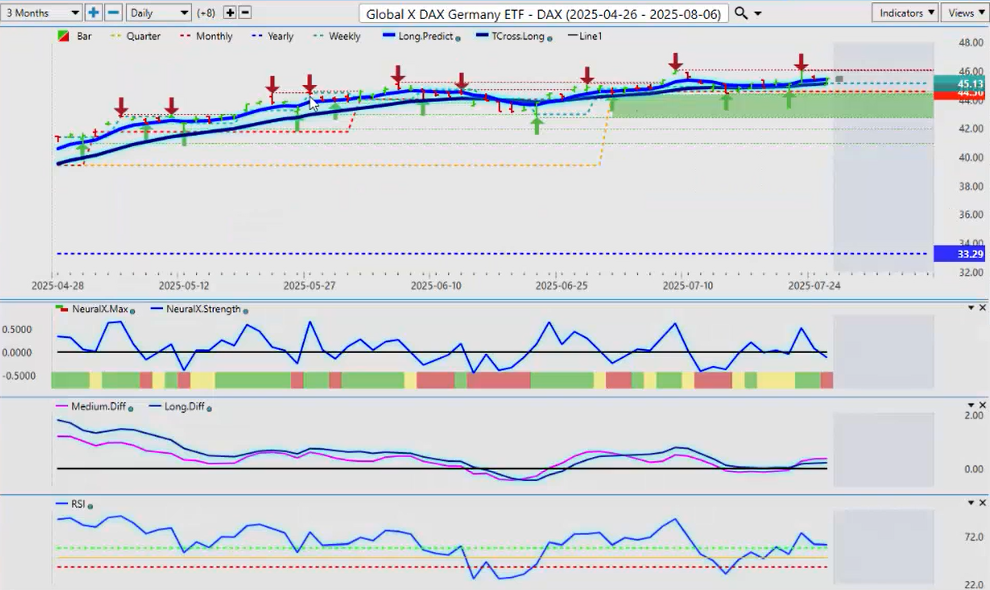
Now, when I look at the German DAX going into next week’s trading — same deal here, guys. Okay, the quarterly opening price is key to hold above. If the DAX is going to remain going higher, we need to hold above 4456. The Tcross long — 4512. Identifying support here is very simplistic.
So again, the same thing: If you believe the DAX is done, then you put a sell stop order just below the quarterly opening at 4456. If it triggers and breaks, then we have a pretty decent retracement area down into the 3329 area.
So again, I think the Fed this week will have something to do with that. And watch your EUR/USD Forex pair also to see what it does. The DAX and the Euro have had a pretty strong positive correlation as of late. So, if the Euro tanks, it’s reasonable to suggest it could pull the DAX down with it. That is the key thing you want to make sure you’re keeping your eyes on.
Volatility Index ($VIX)
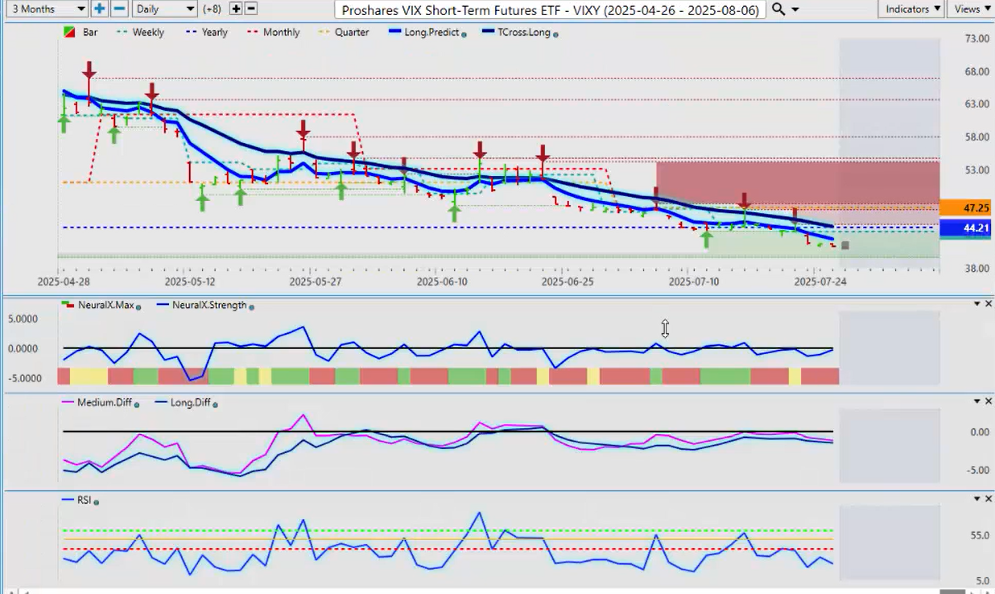
And of course, we want to look at the VIX. What is the volatility? Well, we’re breaking down below the calendar yearly opening price. And again, the quarterly opening is now in position — 47.25. Our main resistance area on the VIX — the VIXY, excuse me — and we’ve got our Tcross long — 44.35. So we know exactly where our resistance is.
But what’s interesting, guys, is that the Tcross long is now intersecting with the calendar yearly opening price, which indirectly suggests there could be a bigger equity rally coming. But my optimism on that still remains heavily guarded given the current conditions with the trade war, the tariffs, Powell versus Trump. There’s a lot of things that could send stocks lower very quickly. But for now, that’s how the VIX looks. It is turning bearish, and it is bearish to start the third quarter.
Euro versus U.S. Dollar ($EURUSD)
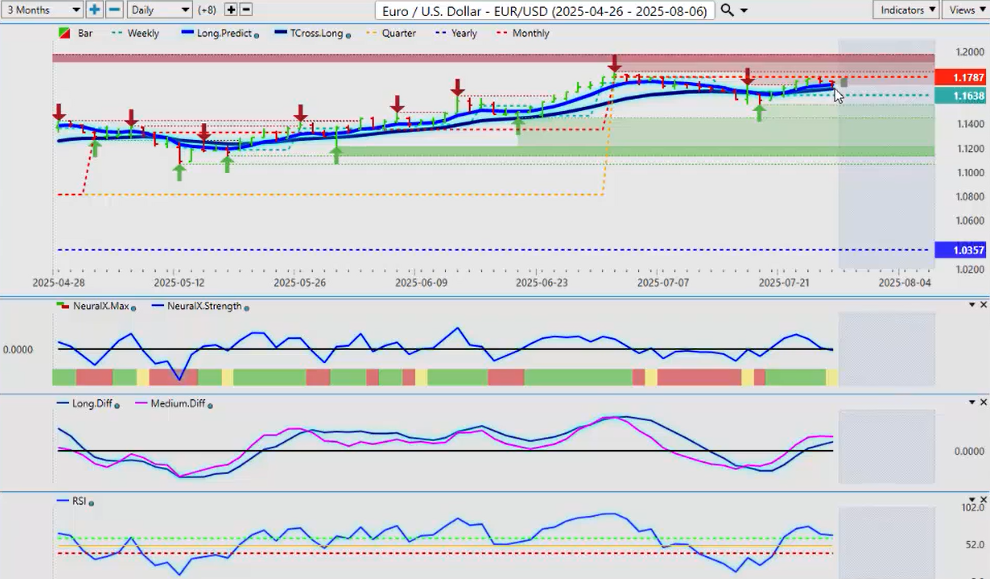
Now, when we look at some of our main forex pairs this week, all of the G7 forex pairs are related to the dollar index or the UUP. So again, when we look at the EUR/USD pair, it is struggling. The dollar index is above its quarterly opening price, the euro is below its.
So what we need — if the euro is going to remain bullish — is to break through 1.1787. That has contained the euro the entire month of July here, guys. And always remember, next week we’re going to get a new monthly opening price, which is likely not going to match the quarterly.
So, if the euro does move lower and we open up the month of August with a new monthly opening price below the quarterly opening, that basically confirms that September is going to be a good month for the dollar. So keep that in mind. Okay?
U.S. Dollar versus Swiss Franc ($USDCHF)
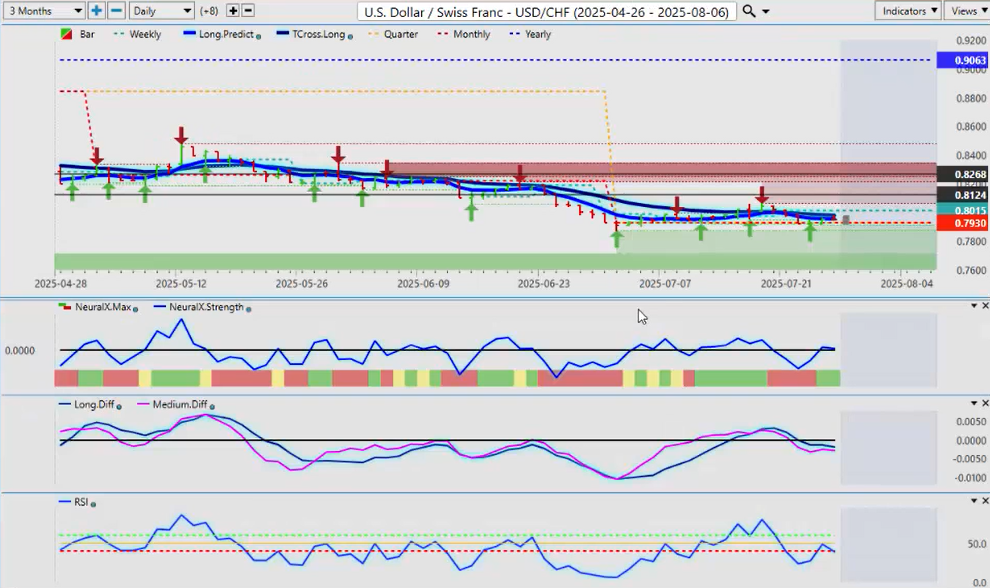
And of course, these other pairs will all follow suit. You’ve got USD/CHF (U.S. dollar / Swiss franc) here. It’s clinging to the quarterly opening price. We are below the Tcross long, but this is a very important time here. Which way is this going to go?
So with the USD/CHF — 0.7930 — if there’s a long here, we need to hold above that particular area. And the indicators in VP are suggesting that this pair is in trouble. So what I have seen is the dollar index can still move higher, but this pair could go lower if it’s a risk-off environment.
U.S. Dollar versus Japanese Yen (USDJPY)
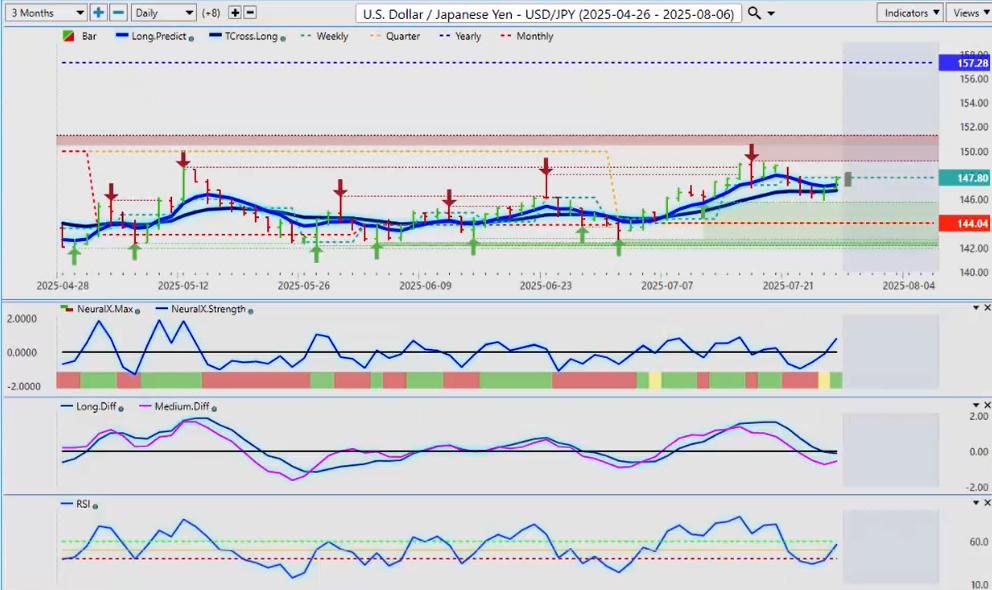
The same thing would apply with the USD/JPY (dollar/yen). If those equity markets remain firm, the USD/JPY can extend higher. I believe this is probably the final push in the next few months to the upside on the USD/JPY, and then it goes lower into the year-end and then lower next year.
But we are bearish on the year — 1.5728 — but on the quarter, the dollar is doing pretty decent against the yen. And always remember: this is a carry trade. So the position of the predicted RSI, the Neural Index Strength — saying there is some upside potential here. And again, if you’re going long, make sure your stops are below 1.4404 or wherever — and again, you can always lower your position size and scale in.
I do believe the USD/JPY will extend higher into at least the end of September, but a lot of that now is going to be decided by Jay Powell and the Fed. It’ll be a very interesting meeting this coming Wednesday.
British Pound versus U.S. Dollar ($GBPUSD)
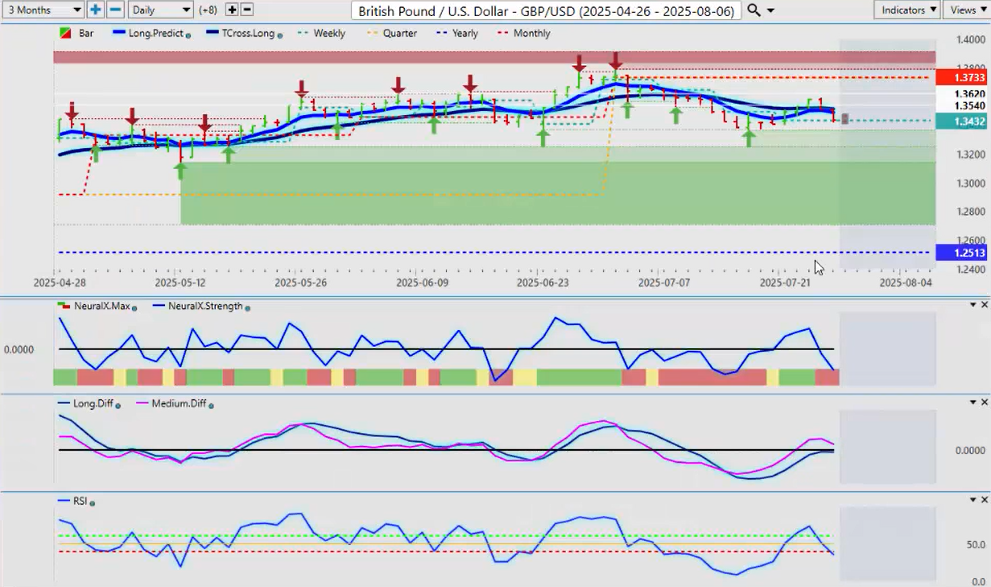
Now, with the GBP/USD (pound/dollar), I’ll circle back to that. We had a good move up this past week, but you can see that if we look at the GBP/USD versus EUR/USD, the pound/dollar is clearly the weaker pair. We’re well below the quarterly opening price here — that number coming in at 1.3733 — and it’s not looking good going forward into next week.
We’re holding and closing below the Tcross long — 1.3515 — but momentum is building on that predicted RSI — 35.5. Most people will use an RSI in a conventional way (overbought, oversold), but it can be a very effective tool when it’s used to gauge momentum. Always remember that, guys. It’s very, very important.
So watch out for Monday trading, and if the GBP/USD is still below the Tcross long at the end of the day on Monday, chances are it’s gearing up for another sell-off.
U.S. Dollar versus Canadian Dollar ($USDCAD)
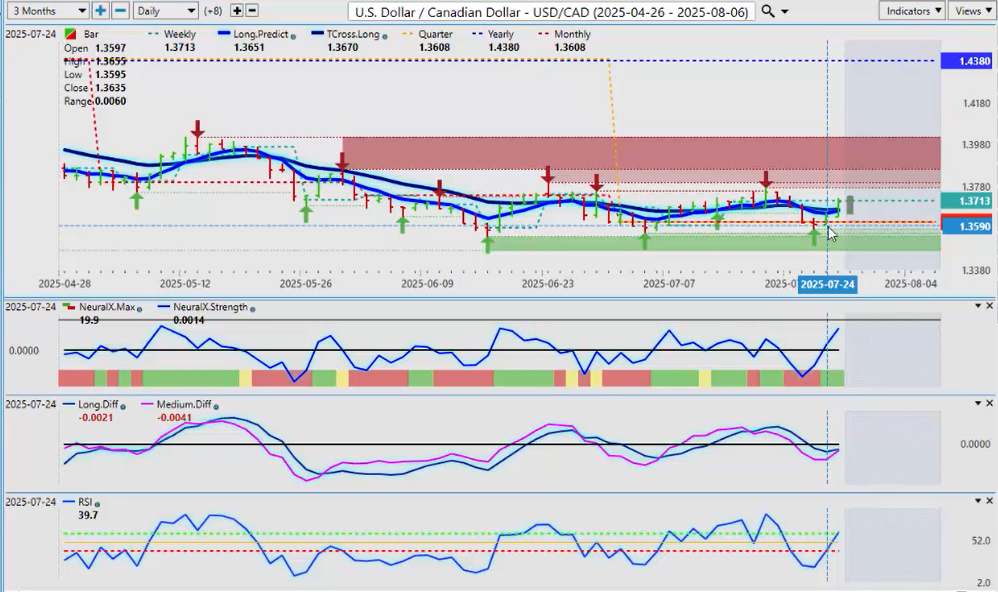
Now, when I look at the USD/CAD (U.S./Canadian) pair — giving back all of the weekly gains — and as you can see, where it’s failing is just below the calendar quarterly opening. So again, we’re in the third quarter, but we’re in the U.S. fiscal fourth quarter. The U.S. dollar has a clear advantage against the Canadian dollar now.
There may be some type of reprieve, and they could start buying Canadian dollars if they get a trade deal. Trump is signaling he’s not really interested in a trade deal with Canada. So, we’ll see how it plays out. But August 1st is the deadline. So again, the USD/CAD could benefit from that.
But these tools here are suggesting we basically have a bottom here going back to June. We have another one on the 7th. You can see how it usually rallies in that first week of the new month and then pulls back again — but it’s all around that quarterly opening price.
So, USD/CAD has largely been above — so above this price — this quarterly opening at 1.3608. Keep an eye on it, guys. But that is the line in the sand. And not only that — if there is any further downside, I need a break below these lows down around 1.3540. I’ve got 1.3557, and over here I’ve got 1.3576. So each one of these — there’s a higher low.
Now, that doesn’t always necessarily mean it’s going to go higher, but certainly, the tools in Vantage Point are suggesting that that is very, very likely.
Australian Dollar versus U.S. Dollar ($AUDUSD)
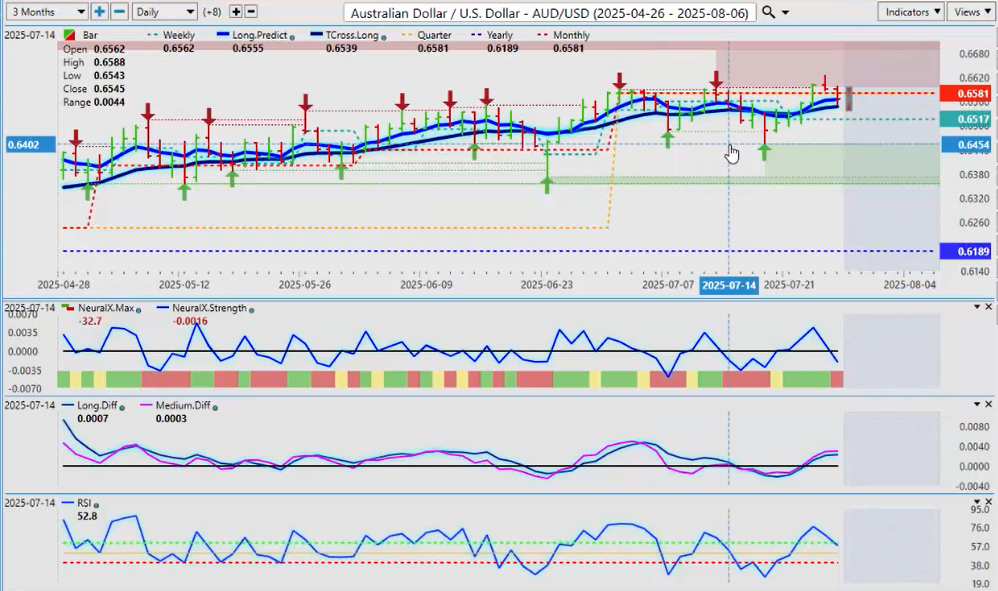
Aussie and the Kiwi — they’re still going to be at the mercy of that China trade deal. We’ll see how this one plays out. But my optimism, again — I just can’t get any momentum on these pairs against the U.S. dollar.
And in most analysis, they throw in 50 different indicators — candlesticks, patterns, Fibonacci — it’s a never-ending list of tools, when the simplicity of measuring it and saying:
“Okay, what kind of quarter is the Aussie having?”
It’s not good.
It’s been failing up in this area repeatedly — and it did again this week. We had a good momentum push and then we closed below the quarterly opening again. So the Tcross long, that’s coming in at 0.6540 — if that breaks down, then the Aussie is likely going to take a run lower to at least the most recent verified support low, which is coming in at 0.6455.
And usually again, that dollar strength starts in mid-August and it goes through the month of September — and sometimes even into early October.
New Zealand Dollar versus U.S. Dollar ($NZDUSD)
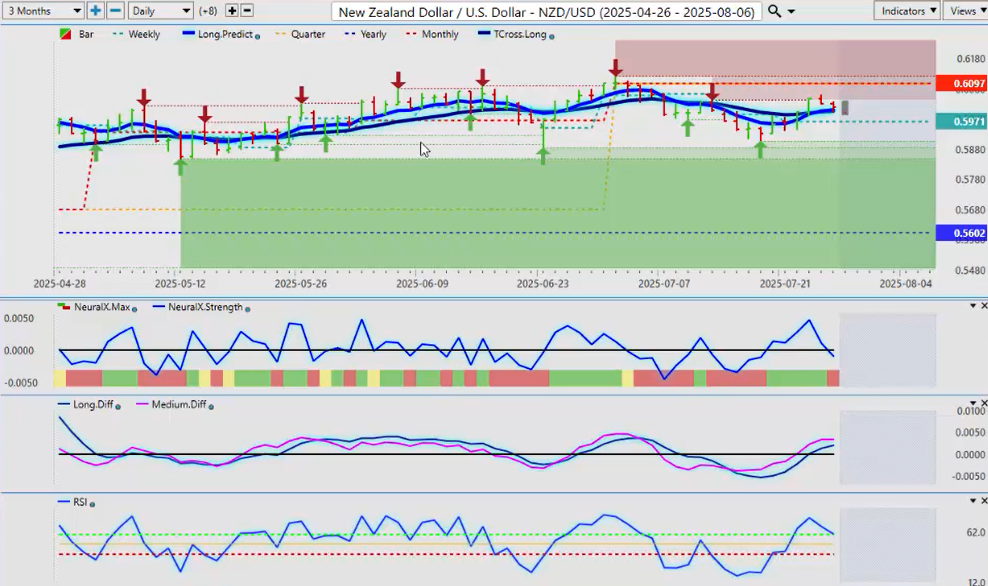
The Kiwi obviously will follow the Aussie, but there’ll be a slight variance between these two — ever so slightly — and that’s usually determined by the AUD/NZD cross pair. So right now, you can see that we have a very — we can differentiate between which currency is weaker — the Aussie or the Kiwi.
Clearly, based on that quarterly opening price, the Kiwi is weaker than the Aussie. So, again, if we’re looking at shorts on one of these two pairs, I would have to say that the Aussie has a slight advantage — because of that — because if we look at the proximity to that quarterly opening, it has plenty of room to run here, whereas the Kiwi, last week, it took the brunt of the hit.
So that could also tell us that there may be a short pending on pairs like AUD/NZD.
So, a lot to think about next week. Volatility will be high. There are multiple trade announcements with the EU, Japan, Canada. Plus, we have the Fed on Wednesday. So there will be no shortage of volatility. But with that, it always brings opportunity.
So with that said, this is the Vantage Point AI Market Outlook for the week of July the 28th, 2025.


