


| This week’s stock analysis is WINGSTOP ($WING) |
One of the huge challenges of trading and investing is determining where you should focus your resources when the broader market turns ugly. One strategy which is worth exploring and often bears very positive results is to determine what stocks or sectors have performed positively during a recent market downturn. We refer to this tactic as the “WHAT IS WINNING?” strategy. What is required is to simply study what stocks or sectors have moved counter the prevailing broader market downtrend.
Applying this concept has led us to take a good hard look at WINGSTOP ($WING) for our weekly stock study. One picture paints a thousand words, and the performance speaks for itself. These performance metrics are not inconsequential and when understood leave powerful clues and evidence to price action.
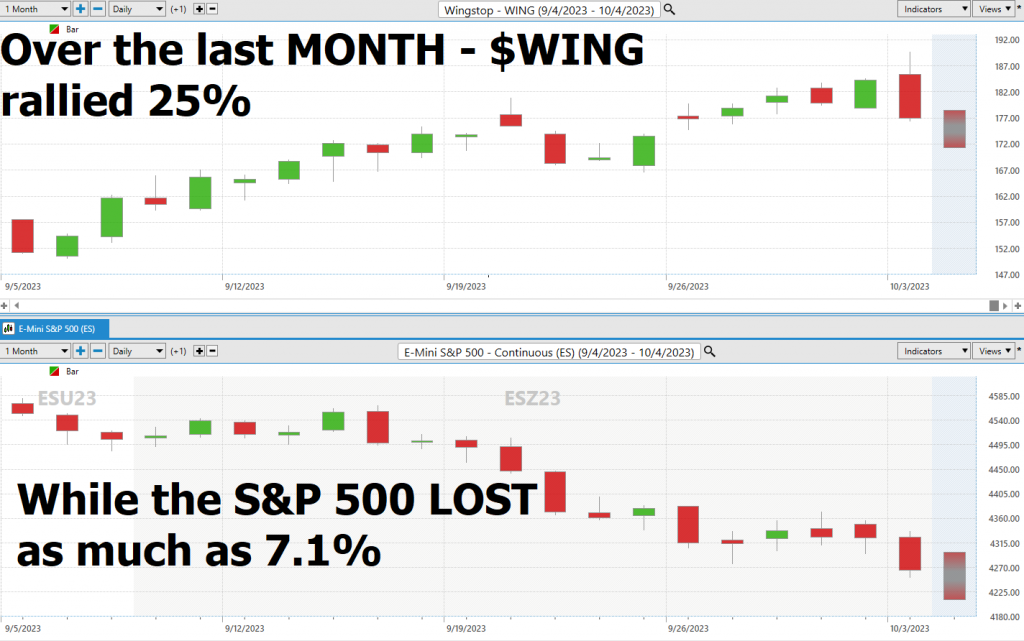
Over the past month, shares of Wingstop, the renowned chicken wing empire, have charted a remarkable journey, rallying as much as a stunning +25%. This stands in stark contrast to the broader market represented by the S&P 500 composite, which endured as much as a -7.1% stumble during the same period.
At the heart of Wingstop’s success lies a simple yet irresistible secret – the chicken wing. These succulent pieces of poultry perfection are offered in an array of mouthwatering flavors and sizes, ensuring that there’s something for everyone. But Wingstop doesn’t stop at wings alone. They’ve masterfully crafted a supporting cast of side dishes, from crispy fries to refreshing coleslaw, and an enticing variety of dipping sauces. It’s a symphony of flavors designed to leave your taste buds singing.
Wingstop’s magic isn’t just in the food; it’s in the way they serve it up. With a laser focus on fast-casual dining, they’ve been dishing out culinary storms, satisfying both dine-in patrons and those who prefer the convenience of takeout or delivery. From its Texas roots, Wingstop has spread its wings across the globe. With its headquarters nestled in Dallas, Texas, the company operates an impressive network of over 1,500 locations worldwide, catering to the cravings of eager customers.
In the cutthroat restaurant industry, Wingstop has had to fend off rivals like Buffalo Wild Wings, Hooters, and a slew of regional competitors. Yet, they’ve managed to soar to great heights by remaining true to their core offerings while boldly expanding into new markets, enhancing their digital ordering options, and adding a dash of spice to their menu. Wingstop’s opportunities lie in riding the chicken wing craze, extending their reach into new territories, and further improving their digital ordering systems. But in the volatile world of dining, they’re not impervious to the risks that come with the territory. Economic fluctuations, supply chain disruptions, and evolving dietary trends could occasionally ruffle their feathers.
Wingstop hasn’t just survived; it has thrived. It’s firmly established itself as the leader in the fast-casual chicken wing niche. Their unwavering commitment to quality, flavor customization, and seamless ordering options has propelled them to the forefront of this fiercely competitive sector. Wingstop ($WING) is a brand that’s recognized far and wide that has promising global expansion prospects. However, critics point out that $WING is vulnerable because it only has one product and is susceptible to supply chain disruptions.
In conclusion, the story of Wingstop Inc. ($WING) is one of flavor, vision, and undeniable success. As they continue to spread their wings in the dynamic world of fast-casual dining, it’s a company worth keeping a keen eye on.
Wingstop is poised to report earnings of $0.51 per share for the current quarter, signifying a robust year-over-year surge of +13.3%.
For the full fiscal year, the consensus earnings estimate stands at $2.17, reflecting a formidable year-over-year growth of +17.3%. This estimate has seen a modest +0.5% uptick in the last month.
Looking beyond into the next fiscal year, analysts expect Wingstop to soar even higher, with a consensus earnings estimate of $2.53. This represents a notable +16.5% change from the previous year’s results. Over the past month, this forward-looking estimate has experienced a modest +0.4% uplift.
Yet, amidst all these numbers, Wingstop has partnered with Morgan Stanley for an accelerated share repurchase agreement, supporting its $250 million share buyback program. Upon completion, $125 million will remain for future repurchases. Wingstop’s board approved a $250 million share buyback program, planning to fund it using existing cash reserves and operating cash flow. A stock buyback, also known as a share, repurchase, is when a company buys back its own shares from the open market. This reduces the number of outstanding shares. This development occurred over the past 5 weeks and is probably the main reason why $WING has moved counter to the prevailing broad market trend over the past 4 weeks.
Buybacks can provide support to a company’s share price, especially if the market perceives it as a positive signal. For remaining shareholders, their ownership percentage in the company increases after a buyback.
In this weekly stock study, we will look at and analyze the following indicators and metrics as are our guidelines which dictate our behavior in deciding whether to buy, sell, or stand aside on a particular stock.
- Wall Street Analysts’ Estimates
- 52-week high and low boundaries
- Best Case – Worst Case Analysis
- Vantagepoint A.I. Forecast (Predictive Blue Line)
- Neural Network Forecast
- Daily Range Forecast
- Intermarket Analysis
- Our trading suggestion
We don’t base our trading decisions on things like earnings or fundamental cash flow valuations. However, we do look at them to better understand the financial landscape that a company is operating under.
Wall Street Analysts’ Estimates
Based on 17 Wall Street analysts offering 12-month price targets for Wingstop in the last 3 months. The average price target is $194.92 with a high forecast of $235.00 and a low forecast of $170.00. The average price target represents an 8.2% change from the last price of $175.46.
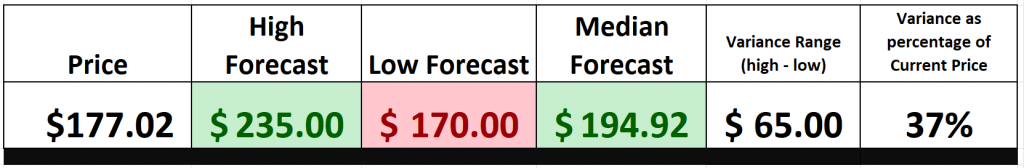
We look at Wall Street Price forecasts primarily to see how much variance there is between the bullish and bearish forecasts. That variance is a valuable estimate that we can use to anticipate future volatility.
52-Week High and Low Boundaries
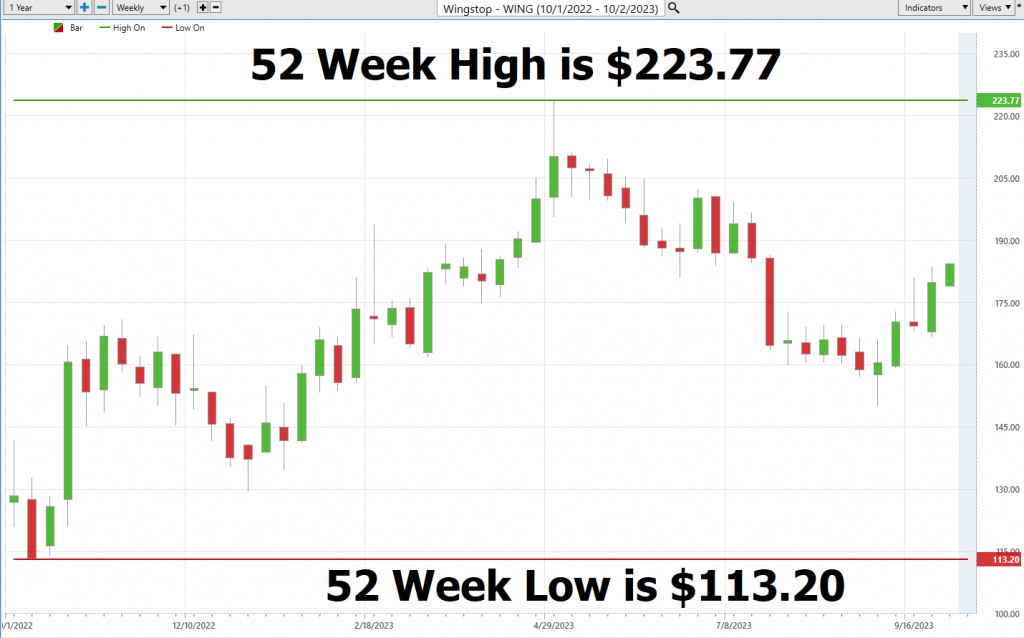
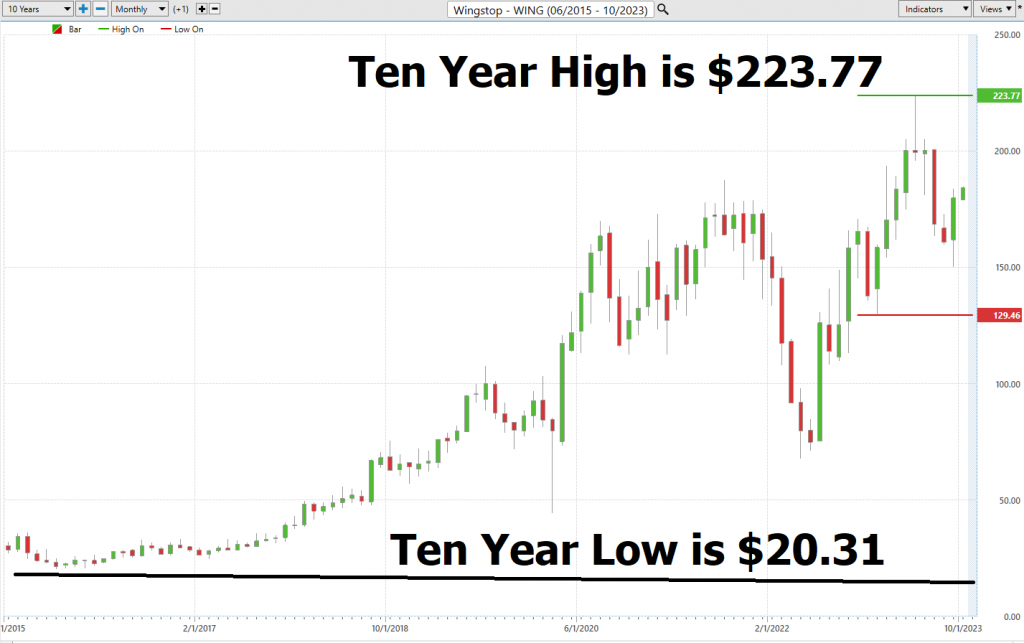
Looking at the Long-Term chart of $WING provides us with the 52-week high and low boundaries. Over the past year we have seen $WING trade as low as $113.20 and as high as $223.77. The annual trading range was $110.57. Currently, the stock is trading at the 59th percentile of its annual range.
Seasoned traders know that in the world of stocks, certain indicators can be like shining beacons in the night. One such beacon is the 52-week high and low boundary. It provides traders with a concise history of the stock’s performance over the past 52 weeks and the annual trading range of the assets we are analyzing.
But there’s more to the story. Savvy traders don’t stop at merely acknowledging these boundaries; they examine the terrain around it with a keen eye. Why? Because this is where the plot thickens. They’re hunting for signs of a trend, akin to catching the opening notes of a new symphony. It’s a subtle hint that security might be poised for a fresh uptrend.
This is where the pros separate themselves from the crowd. They’re adept at identifying potential turnarounds before the rest of the market catches on, much like a seasoned racer recognizing the signs of a race turning in their favor.
So, whether you’re poring over financial data or reading market tea leaves, remember that the 52-week high and low boundary is far more than a line on a chart. It’s a pivotal touchpoint that experts use to inform their trading strategies. Think of these boundaries like a long-distance runner thinks of their best and worst times in a race—crucial markers that can make all the difference in your trading journey.
To estimate volatility, we simply look at the annual trading range of $WING and divide it by the current price. This provides us with an estimate of expected statistical volatility of 61.9%. Simply stated, this metric is a guide for what we can expect moving forward and tells us that it would be perfectly normal for $WING to trade in a range that is plus or minus 61.9% higher and or lower over the coming 52 weeks.
Best Case – Worst Case Scenario
Let’s talk trading opportunities, and I’ll tell you it’s not just about the numbers. No, we’re diving into the depths of market sentiment here. You see, it’s not enough to focus solely on the peaks of those exhilarating rallies; you’ve got to pay heed to the valleys of those declines. That’s where you truly sense an asset’s real-time volatility. But hold on, we’re not stopping there; we’re putting it all into context by comparing it to the big players in the market.
Now, don’t get me wrong; we’re not reducing this to a cold, sterile numbers game. We need a holistic approach. It’s about analyzing both the best-case and worst-case scenarios. When we dissect those charts, that’s when we really grasp the implications of this volatility on potential gains and losses.
In the world of trading, we’re chasing movements, but let’s not forget, it’s a two-way street – a dance of risks and rewards. So, let’s kick it off by scrutinizing those rallies and declines. They reveal whether an asset can maintain its gains.
Now, why do we bother with this baseline analysis? Because it paints a visual picture of how swiftly a stock descends compared to the velocity of its ascent. It’s the kind of insight that separates the savvy from the speculators.
So, as we navigate the world of trading, remember, it’s not just about the numbers; it’s about understanding the ebb and flow of market sentiment.
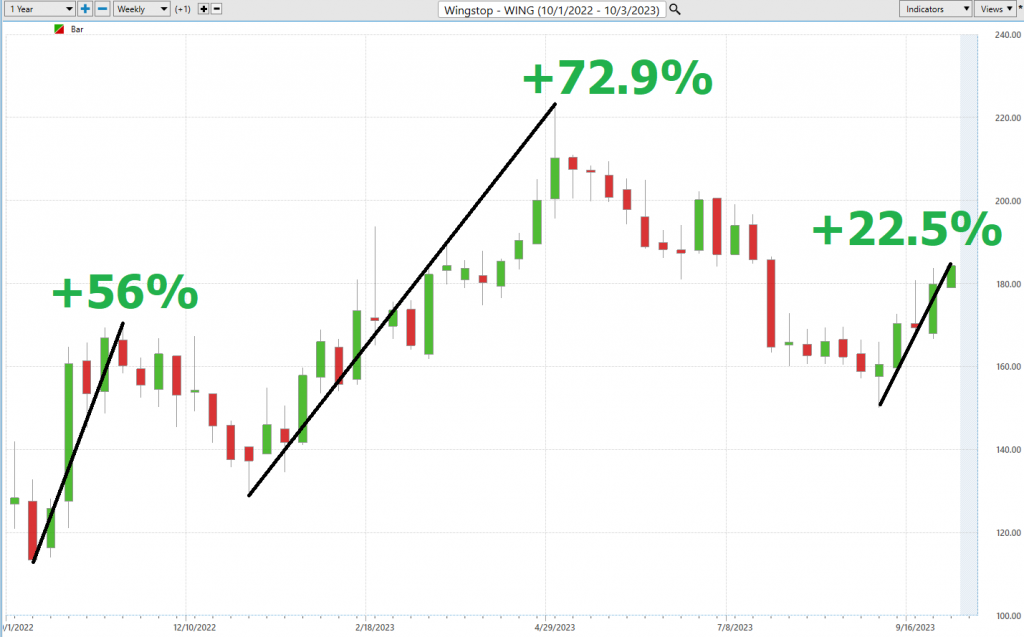
Here is the Best-Case Analysis:
Followed by the Worst-Case Analysis:
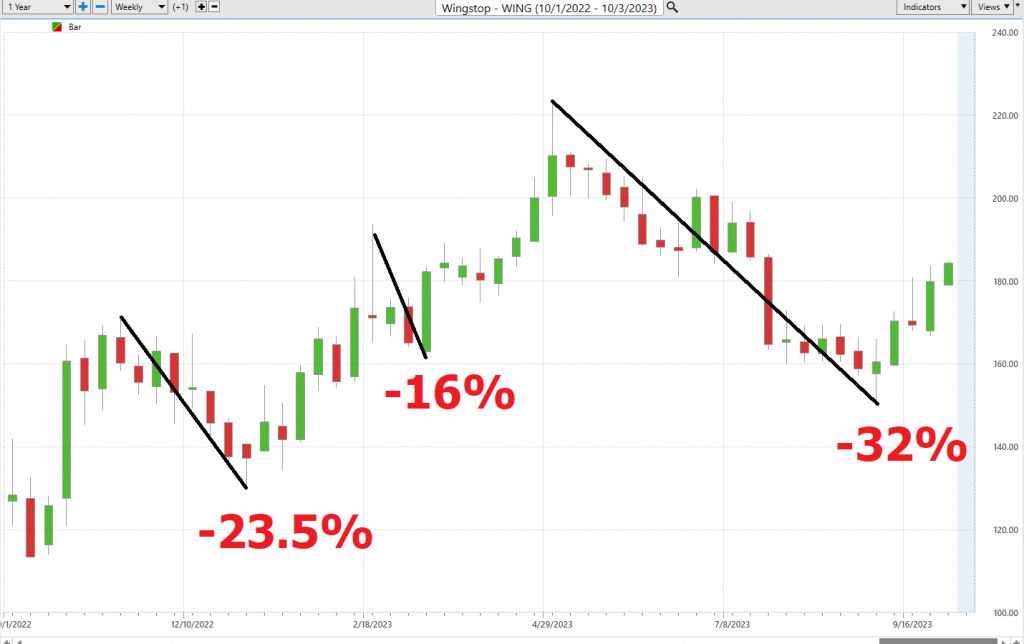
From this simple analysis, you can visualize and compare the rallies to the declines and see how quickly they occurred and whether the gains or losses were sustained.
Next, we want to compare the performance of $WING to the major broad market indexes.
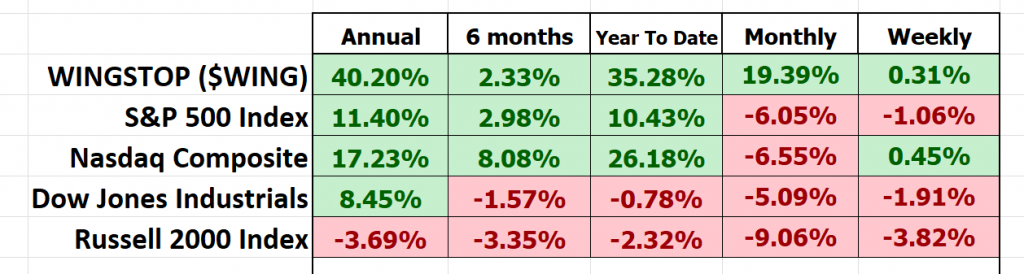
You can see that $WING outperformed all of the broader market indexes in all time frames with the exception of the 6-month time frame. $WING’s performance has been stellar. Now, let’s look at $WING and compare volatility and performance to how it stacks up against the big boys in the market. What we’re talking about here is something traders call BETA. You see, beta (β) is like the Richter scale of the stock world. It tells you how much a stock shakes and rattles compared to the broader market, usually a big index like
the S&P 500. In simpler terms, beta shows us how sensitive a stock is to the market’s ups and downs.
Now, let’s dive into the intricacies of beta, a critical measure for understanding a stock’s relationship with the broader market. Here’s the lowdown:
– **Beta = 1:** This signifies that the stock’s price movements closely mirror those of the overall market. Essentially, if the market takes a 5% leap, a stock with a beta of 1 should also rise by 5%.
– **Beta > 1:** Picture this as the stock market’s wild rollercoaster. A beta exceeding 1, say 1.5, indicates that the stock is 50% more volatile than the market itself. When the market enjoys a 5% climb, this stock might embark on a heart-pounding 7.5% ascent (or tumble with equal fervor).
– **Beta < 1:** Now, here’s where the steadiness comes in. A beta below 1, like 0.5, suggests that the stock is only half as volatile as the market. In a 5% market uptick, this stock might experience a more measured 2.5% rise.
Now, let’s apply this wisdom to $WING, Wingstop Inc. Here’s the deal: $WING flaunts a beta of 1.5, and we’re scrutinizing data spanning a 5-year horizon. However, it’s crucial to remember that beta is firmly rooted in the past, and what’s come before doesn’t necessarily dictate the future. High beta doesn’t equate to guaranteed high returns, my friends; it’s an indicator of the stock’s penchant for ups and downs, signaling an elevated level of risk.
Investors turn to beta to evaluate how risky a stock stands compared to the broader market. Think of it as a risk-o-meter, helping investors construct portfolios that align with their risk tolerance and investment objectives.
So, when it comes to $WING, we’re confronted with an asset that unmistakably exhibits far greater volatility than the broader stock market indices. It’s a high-octane ride, no doubt. And as we’ve emphasized, this heightened volatility can either spell tremendous opportunity or heightened risk.
Vantagepoint A.I. Predictive Blue Line Forecast
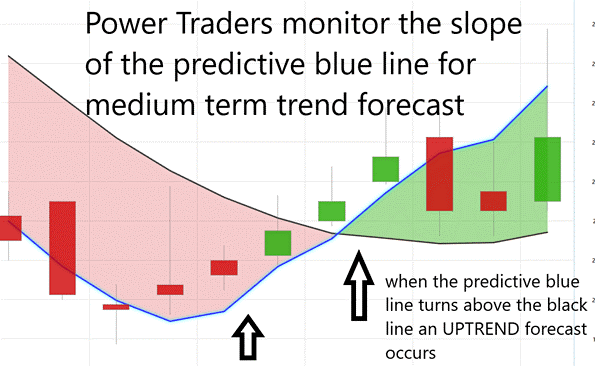
On the following chart you will see the power of the VantagePoint Predictive blue line which determines the medium term trend price forecast.
The guidelines we abide by are as follows:
- The slope of the predictive blue line determines the trend forecast and general direction of $WING.
- Ideally, the VALUE ZONE is determined to try and find buy opportunities at or below the predictive blue line, or to sell opportunities above the predictive blue line during a downtrend.
Let me paint you a vivid picture… Imagine having a trustworthy guide in the tumultuous world of trading. Well, VantagePoint provides just that with its ingenious tool known as the predictive blue line, and it’s no smoke and mirrors. This line, fueled by VantagePoint’s cutting-edge Neural Network and Intermarket Analysis, is a product of some serious brainpower—artificial intelligence, machine learning, and statistical analysis all in one. It’s like having your own North Star in the trading cosmos.
Now, let’s dive into the golden rule, shall we? And remember, this rule applies whether you’re in for a quick trading stint or planning to ride the waves for weeks. The name of the game is staying in harmony with the prevailing trend at precisely the right moment. And that’s where our trusty predictive blue line steps in, lighting up our path.
Here’s the kicker: When you spot two consecutive closes above that blue line, it’s like the market’s whispering an uptrend might be brewing. On the flip side, if you notice two consecutive closes below the blue line, it’s akin to a warning signal that a downtrend could be in the making. This is a grounded, logical approach to decipher the enigmatic world of market trends and mold your investment/trading strategies accordingly. It’s all about staying on the right side of the right trend at the right time.
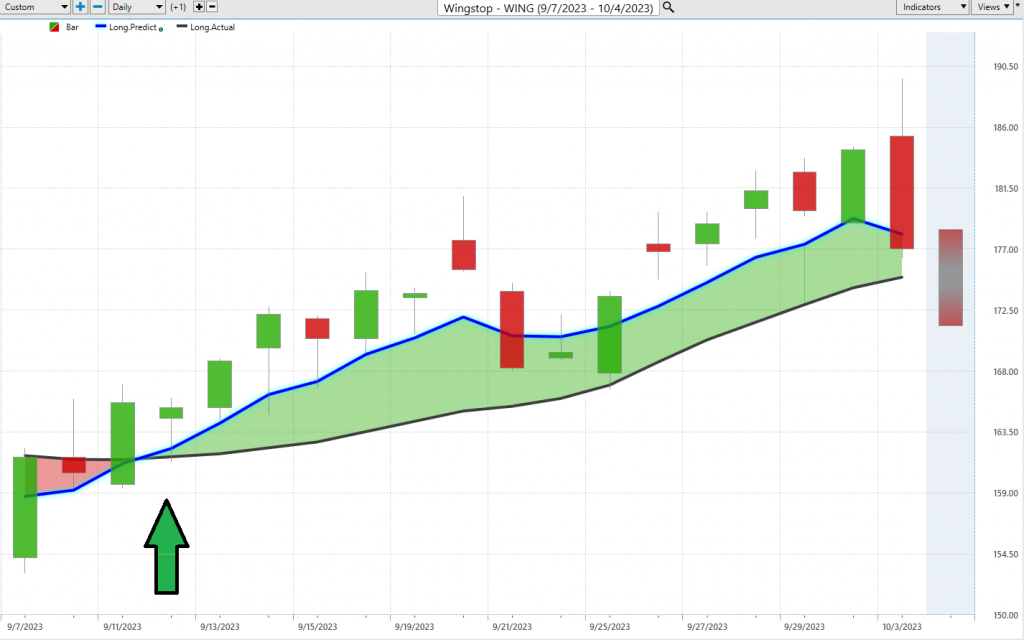
So, remember, in the world of trading, VantagePoint’s predictive blue line isn’t just a fancy tool; it’s your compass in the sea of market trends. What is noteworthy and something to remember is that this UPTREND unfolded while the rest of the broader market was in a downtrend. By asking the question, “what is winning” you would quickly be focused on those assets which were moving counter to the prevailing market trend.
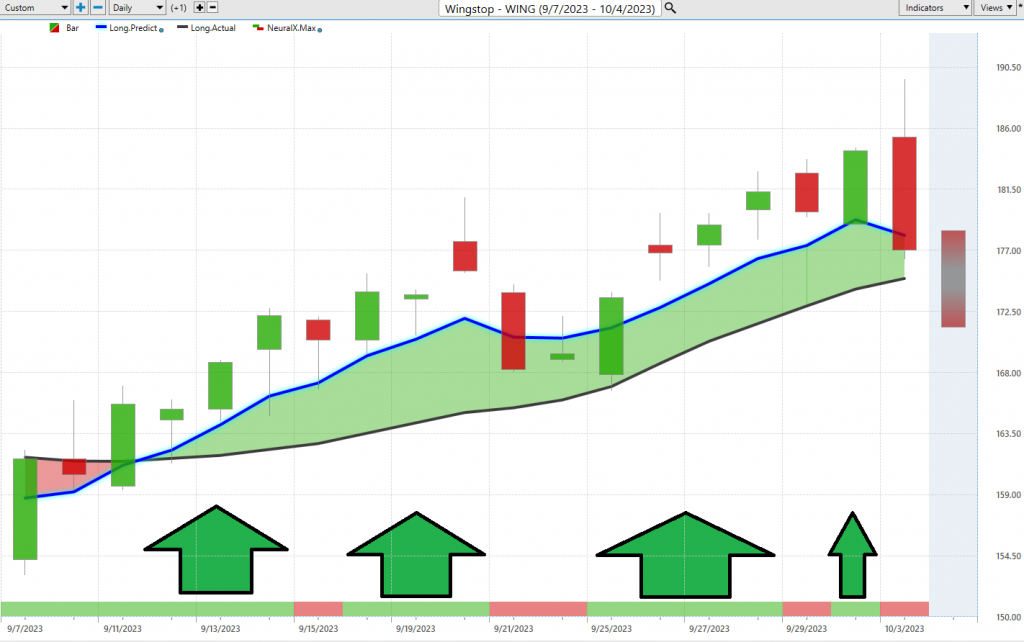
Neural Network Indicator (Machine Learning)
Let’s dive right into a powerhouse tool in the world of trading — the Neural Network Indicator. Picture this: It’s sitting right there at the base of your trading chart, acting like your very own market weather forecaster.
When that indicator flashes green, it’s like a sun-soaked day in the market, signaling strength and opportunity. But when it switches to red, it’s akin to a storm cloud gathering, warning of potential short-term market weakness ahead. And if it’s a cool shade of yellow, consider it a market weather report whispering, “Expect some sideways action.”
Now, let’s unravel what makes this indicator tick. A Neural Network is like having a smart, artificial brain in your trading toolkit. It takes a colossal amount of data, churns it through its virtual gears, and spits out insightful predictions. Just like we constantly strive to improve our trading skills, these Neural Networks are always learning and refining themselves.
Powered by cutting-edge AI, they’re the Sherlock Holmes of trading. They delve deep into market data, from technical intricacies to global events and even corporate forecasts. And here’s the kicker—they’re lightning-fast. They can spot connections between different market factors and outcomes at a pace that puts us mere mortals to shame. For instance, they might uncover a link between shifts in oil prices and unexpected movements in a specific regional stock index. Insights like these can give traders a significant advantage.
Now, what’s the secret sauce for success? It’s all about confirmation, my friends. The seasoned Power Traders know it’s savvy to cross-check both the predictive blue line and the Neural Network Indicator. When these two signals align in the same direction, it’s akin to a green light for trading. And if they both turn red, well, it’s time to ponder hitting that sell button.
These Neural Networks are like trading superheroes, the next-gen supercomputers. They uncover hidden patterns and connections that traditional technical analysis methods can’t even dream of. Hence, Power Traders are always on the lookout for these high-probability forecasts, grounded in historical insights.
In a nutshell, when you’re a Power Trader, you’ve got your eye on both the Neural Network and the A.I. forecast. It’s like having a dynamic duo guiding your trading decisions. When they both shine green, that’s your buy signal. And when they both flash red, it’s a clear sell signal. So, remember, in the world of Power Traders, double confirmation is the name of the game.
In a nutshell, when you’re a Power Trader, you’ve got your eye on both the Neural Network and the A.I. forecast. It’s like having a dynamic duo guiding your trading decisions. When they’re both green, that’s a buy signal. And when they’re both red, it’s a sell signal. So, remember, folks, double confirmation is the name of the game for Power Traders.
VantagePoint Software Daily Price Range Prediction
Let’s get right into it — VantagePoint Software’s Daily Price Range prediction forecast. This gem right here is what separates the pros from the rookies, helping seasoned traders pinpoint their market entry and exit points with surgical precision.
Now, listen up, because every trader faces a daily battle, a real struggle, deciding when to dive into the market and when to sit it out. It’s a decision that can keep you tossing and turning at night. But here’s where VantagePoint’s A.I. swoops in, making your life a whole lot easier. It serves up the predicted high and low points on a silver platter, painting a crystal-clear picture of the opportunity and trend. No more second-guessing, folks.
Take a gander at these average trading range metrics for $WING over the past year, spanning daily, weekly, and monthly time frames.
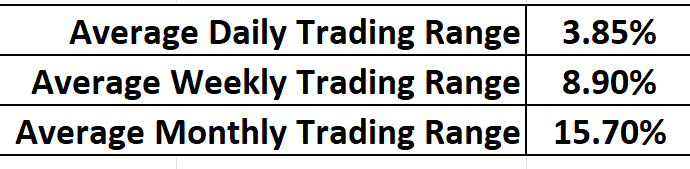
Now, here’s the golden rule of trading, and pay attention, because this is where the magic happens—it’s all about nailing the perfect moment to enter and exit the market. VantagePoint doesn’t just help you find that moment; it does it with breathtaking precision. The Daily Range forecast gets updated daily, giving you invaluable insights into where prices might be headed. Think of it as having a wise old mentor whispering market wisdom in your ear.
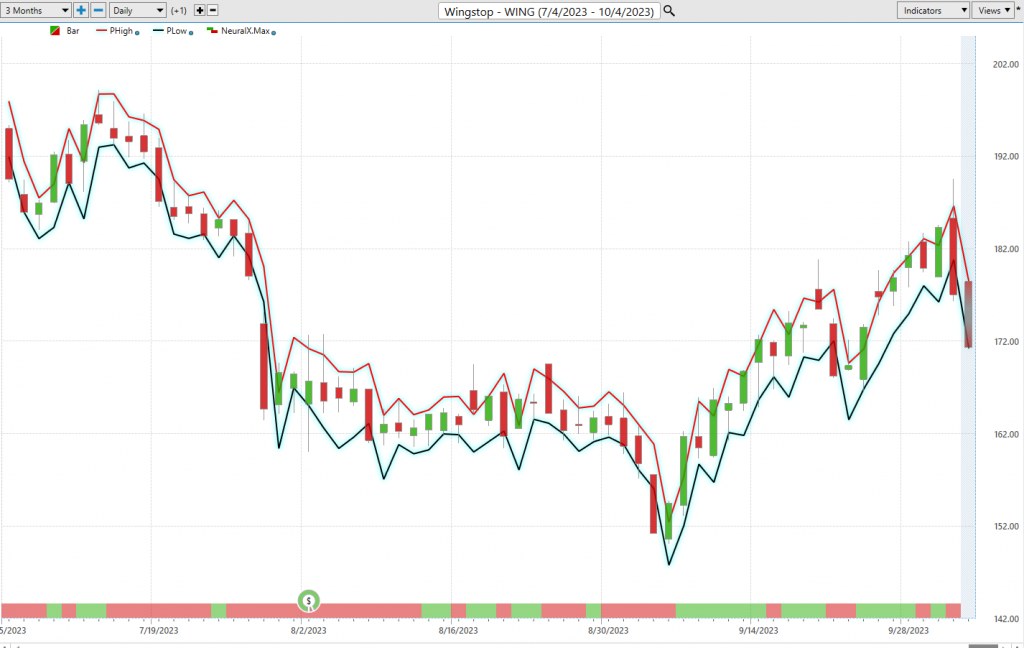
Now, feast your eyes on that chart. It’s not just fancy lines; it’s your trusty guide for placing stops and managing risk. Notice how price rarely ventures below that dark line? That’s your cue for ideal buy stop placements right in that specific vicinity. It’s risk management at its finest.
Those upper and lower bands of the price range forecast carve out a clear channel of trading activity. And here’s a tip for the sharp swing traders out there: Look for buying opportunities near the channel’s bottom and selling chances near the top. It’s a cautious approach, but it’s brimming with potential for success.
When Power Traders merge this daily range forecast with the double confirmation setup, it’s like wielding a precision instrument for spotting swing trading opportunities. Just glance at that chart, and you’ll witness the daily range forecast in action, making moves with surgical precision. That is the remarkable power of VantagePoint.
Intermarket Analysis
In the world of trading, one of the paramount truths is this: What’s driving the price? Headlines may spin intriguing narratives, but those “stories” only tantalize the imagination. Traders, on the other hand, crave and require something more to understand the cause and effect of price movement.
So, how do we get to the heart of this crucial question? Well, folks, it’s through a discipline called Intermarket analysis, which dissects statistical price correlations of assets like never before.
Intermarket analysis serves as the trader’s compass, offering insight into the intricate relationships between different asset classes and markets. In this realm, we tip our hats to three esteemed leaders—John Murphy, Martin Pring, and Lou Mendelsohn—who have navigated these waters with distinction. Murphy penned “Intermarket Technical Analysis,” regarded by many as the Bible on this subject, unveiling techniques such as correlation studies and divergence interpretations. He put a spotlight on stock indexes, commodities, bonds, and currencies as pivotal pieces of investment market data. Pring, in his books like “Intermarket Analysis: Profiting from Global Market Relationships,” unravels how trends in equities or commodities can be unraveled by dissecting correlated movements across markets, from bonds to stock indexes. And Lou Mendelsohn, the trailblazer behind Vantagepoint Software, pioneered a robust means to quantify and qualify Intermarket relationships for traders.
Now, here’s a fact we can’t escape: We live in a global marketplace where everything is interconnected. Interest rates, Crude Oil Prices, Dollar volatility, and a multitude of other variables cast their shadows over the decisions companies must make to thrive and prosper in these challenging times. It’s a puzzle that keeps investors and traders up at night, trying to decipher these multifaceted factors.
But remember you always have a choice. You can tune in to the media talking heads spinning fear-laden tales, or you can lean on hard facts to guide your decision-making.
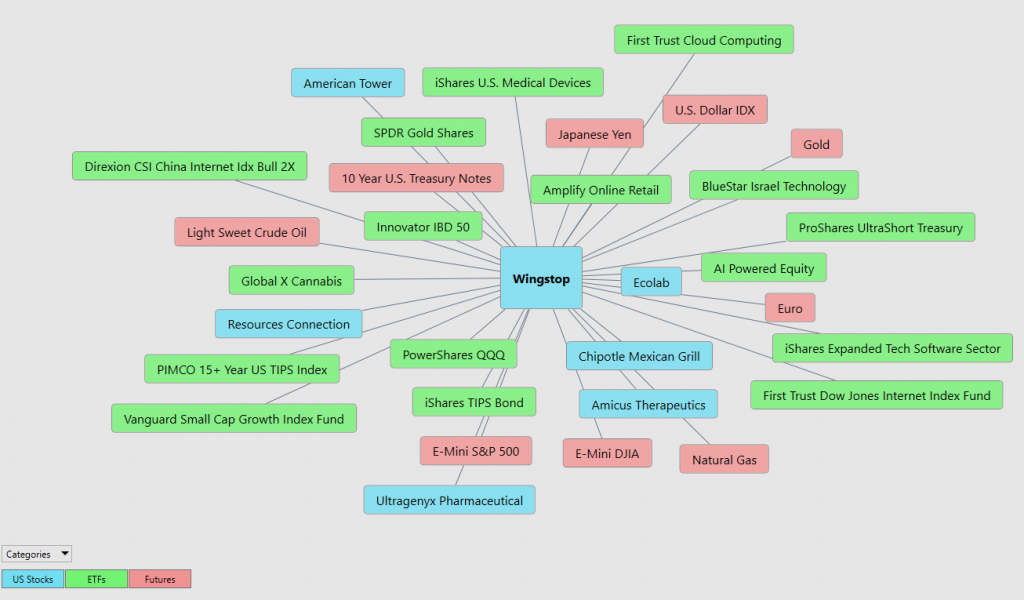
Now, feast your eyes on the following graphic—it unveils the top 31 drivers behind WINGSTOP’s ($WING) price action. It’s not conjecture or conjecture, its real data, the kind that savvy traders rely on to navigate the unpredictable tides of the market.
Our Suggestion
Let’s talk about Wingstop and their impressive streak. They’re not just flying high; they’re soaring to new heights! They’re all set to achieve a 20th consecutive year of growing sales per location. Now, that’s consistency you can bank on.
What’s driving this momentum, you ask? It’s a winning combination of opening new locations and a transaction boom that’s set to pump up their revenue nicely this year.
But here’s the real kicker, and it’s a testament to their strength: Same-store sales have been on an upward trajectory for 19 years straight at U.S. locations. In the first quarter alone, they clocked in with domestic same-store-sales growth of a whopping 20.1%, putting them firmly on track for that 20th consecutive year of growth.
As of the end of Q1, Wingstop had nearly 2,000 locations spanning the globe. And they’re not slowing down. Management’s got big plans, aiming to open roughly 200 more locations before we bid farewell to 2023. Pair that with the ongoing same-store sales growth, and you’ve got a recipe for meaningful revenue growth.
Now, let’s add a little spice to the mix. Wingstop’s currently in the midst of a $250 million share buyback program. That’s the kind of move that can turn heads, and it’s no wonder this stock’s been among the top movers over the past month.
So, keep your trading radar tuned in to $WING. While it might not be the bargain it once was, it’s poised to offer a multitude of trading opportunities in the year ahead. As this stock study gets published only 18% of all stocks are trading above their 20 day moving averages. $WING is winning in a very challenging stock market environment.
Mark your calendars because the next earnings call is set for Wednesday, October 25, 2023. And remember, we’re guided by the power of artificial intelligence as we navigate these exciting trading waters.
We like the reality that the stock is highly volatile, which gives our trading style an edge. We will continue to explore the long side of the market for short-term swing trading opportunities.
Our recommendation is to follow the A.I. trend analysis as outlined in this stock study and practice good money management on all trades.
We will re-evaluate daily based upon:
- New Wall Street Analysts’ Estimates
- New 52-week high and low boundaries
- Vantagepoint A.I. Forecast (Predictive Blue Line)
- Neural Network Forecast
- Daily Range Forecast
The trend in $WING is UP. Pay attention to the next earnings call in $WING on October 25, 2023. Earnings and the company’s share buyback program make $WING a unique trading opportunity.
Let’s Be Careful Out There!
It’s Not Magic.
It’s Machine Learning.
Disclaimer: THERE IS A HIGH DEGREE OF RISK INVOLVED IN TRADING. IT IS NOT PRUDENT OR ADVISABLE TO MAKE TRADING DECISIONS THAT ARE BEYOND YOUR FINANCIAL MEANS OR INVOLVE TRADING CAPITAL THAT YOU ARE NOT WILLING AND CAPABLE OF LOSING.
VANTAGEPOINT’S MARKETING CAMPAIGNS, OF ANY KIND, DO NOT CONSTITUTE TRADING ADVICE OR AN ENDORSEMENT OR RECOMMENDATION BY VANTAGEPOINT AI OR ANY ASSOCIATED AFFILIATES OF ANY TRADING METHODS, PROGRAMS, SYSTEMS OR ROUTINES. VANTAGEPOINT’S PERSONNEL ARE NOT LICENSED BROKERS OR ADVISORS AND DO NOT OFFER TRADING ADVICE.


